Introduction
Nuclear data measurements are important in multiple fields, including fission physics, fast reactors, accelerator-driven systems for the transmutation of nuclear waste, and global security. The prompt fission neutron spectrum (PFNS) is a key nuclear data quantity of particular interest and has traditionally played a crucial role in understanding and modeling fission processes. In the context of PFNS, the concept “prompt” refers to emission times much less than 1 ns before the onset of a delayed β decay. However, experimental data relating to PFNS are rather scarce and show discrepancies in the low- and high-energy parts [1, 2]. This is partly attributed to the small fission cross sections and low neutron yield at the high-energy side of the Maxwell distribution and the large background from incident neutrons and neutrons from sources other than fission.
Several problems regarding nuclear fission remain to be investigated, including the properties of transitional states around the fission barrier, redistribution of excitation energy between the fission fragments, and the mechanism of evolution to the scission point. Particularly, scission neutrons, which are emitted during the transition from nuclear equilibrium to the scission point, can reveal information on fission dynamics. From an experimental perspective, distinguishing scission neutrons from neutrons emitted by fission fragments is impossible. This problem can only be resolved by comparing the observed PFNSs with those obtained from theoretical calculations. Various theoretical models have been developed for calculating the PFNS, including neutron evaporation models [3, 4], the Scale Method [5], and the Los Alamos Model [7, 6]. These models, which are intrinsically phenomenological and tuned to experimental data, have been widely used to predict and calculate PFNS for present and past evaluations. Currently, more complex and computationally intensive models such as those in Refs. [2, 8, 9] have tracked the decay paths of fission fragments and considered many more observable fission quantities in the modeling process. Analog Hauser-Festival calculations [10] and statistical approaches [11] have also been developed. A recent study revealed that the yield branch of scission neutrons varies between experiments (see Ref. [12]), which is a manifestation of discrepancies in PFNS studies. Thus, reliable experimental data, a good understanding of the discrepancies, and realistic uncertainty estimates are required to guide the evaluation and development of reasonable model predictions.
To determine the time at which fission occurs, fission fragments are conventionally deposited in a gas volume inside fission chambers. These chambers have high efficiency for detecting fission fragments, but they suffer from a limited mass of fission material because of the necessity of allowing fission fragments to escape from the sample [13, 14]. To increase the sample mass that can be used for PFNS measurements, prompt fission γ rays are utilized as the time reference, making the deposition of fission fragments in the sample acceptable. This γ tagging method considers any γ event as the fission start time for spontaneous fission [15], whereas for neutron-induced fission, multiple γ tagging is implemented because the incident neutron beam is accompanied by an intense γ background [16, 17]. At the Lawrence Livermore National Laboratory (LLNL), a parallel-plate avalanche counter (PPAC) was developed for PFNS measurements [18]. The incident neutron energy was calculated from the neutron time-of-flight (TOF) deduced from the difference between the reference timing signal provided by the neutron source and the signal fired by fission fragments on PPAC. The energy spectra of prompt fission neutrons were determined by the time difference between the fission fragment signal and the constant fraction discrimination (CFD) signal from a neutron detector. The use of PPAC is beneficial because its bias voltage is optimizable to improve the signal-to-noise ratio and discriminate α-decay background and fission fragments. In addition, it has a temporal resolution of ∼ 1 ns, which matches that of a liquid scintillation detector, thereby improving the neutron energy resolution. A PPAC with a similar principle and structure was designed and manufactured at the China Institute of Atomic Energy (CIAE), where multiple sample cells were introduced to increase the total sample mass that could be utilized for the PFNS measurement, as described in the next section.
Organic scintillators produce light via both prompt and delayed fluorescence, the decay times of which are typically a couple of nanoseconds and hundreds of nanoseconds, respectively. The majority of the fluorescent light yield is produced by prompt decay, whereas the amount of light in the delayed component often varies as a function of the type of particle, exciting the scintillation material [13]. This difference, known as pulse shape discrimination (PSD), can distinguish between different types of particles. Neutron interactions in organic scintillators produce protons through elastic scattering. These protons have a short range and generate a high concentration of triplet states, which decay by delayed fluorescence. Alternatively, γ-ray interactions in organic scintillators mainly produce scattered electrons. Electrons have a longer range than protons and generate a lower concentration of triplet states (electrons are more likely to produce excited singlet states that decay by prompt fluorescence) [19]. The significant difference in the pulse shape of the signal resulting from the ratio of prompt to delayed fluorescence produced by different types of radiation makes PSD a popular method for high-energy neutron detection in environments comprising γ rays. A high neutron detection efficiency and fast timing features are also required for neutron background characterization. Liquid scintillation detectors have been successfully implemented for nuclear data measurement [20-24] because of their excellent time resolution characteristics, neutron/γ PSD ability, and neutron detection efficiency, making them particularly suitable for fast neutron and γ-ray energy spectrum measurements when γ rays and neutrons coexist. In this study, a fast neutron detector array comprising 48 liquid scintillator detectors was developed. The array was intended to measure the PFNS of actinide nuclei, such as 235U/238U, from 1-15 MeV induced by neutrons at different energies. In addition, it can be utilized to select neutron channels for in-beam γ spectroscopy [25] or analyze the energy spectrum and angular distribution of prompt fission γ in neutron-induced reactions. The implementation of multiple detectors greatly increases the detection efficiency and is beneficial for the clarification of the discrepancies in the literature.
The remainder of this paper is organized as follows. Section 2 describes the experiment, including the liquid scintillators, PPAC, and targets. Section 3 describes the test results of the performance of the liquid scintillator. Section 4 provides the details of the Geant4 simulation of the proposed neutron detection array. A pilot measurement of the 252Cf spontaneous fission source is presented in Sect. 5, and a summary is provided in Sect. 6.
Experimental configuration and data acquisition system
The liquid scintillator
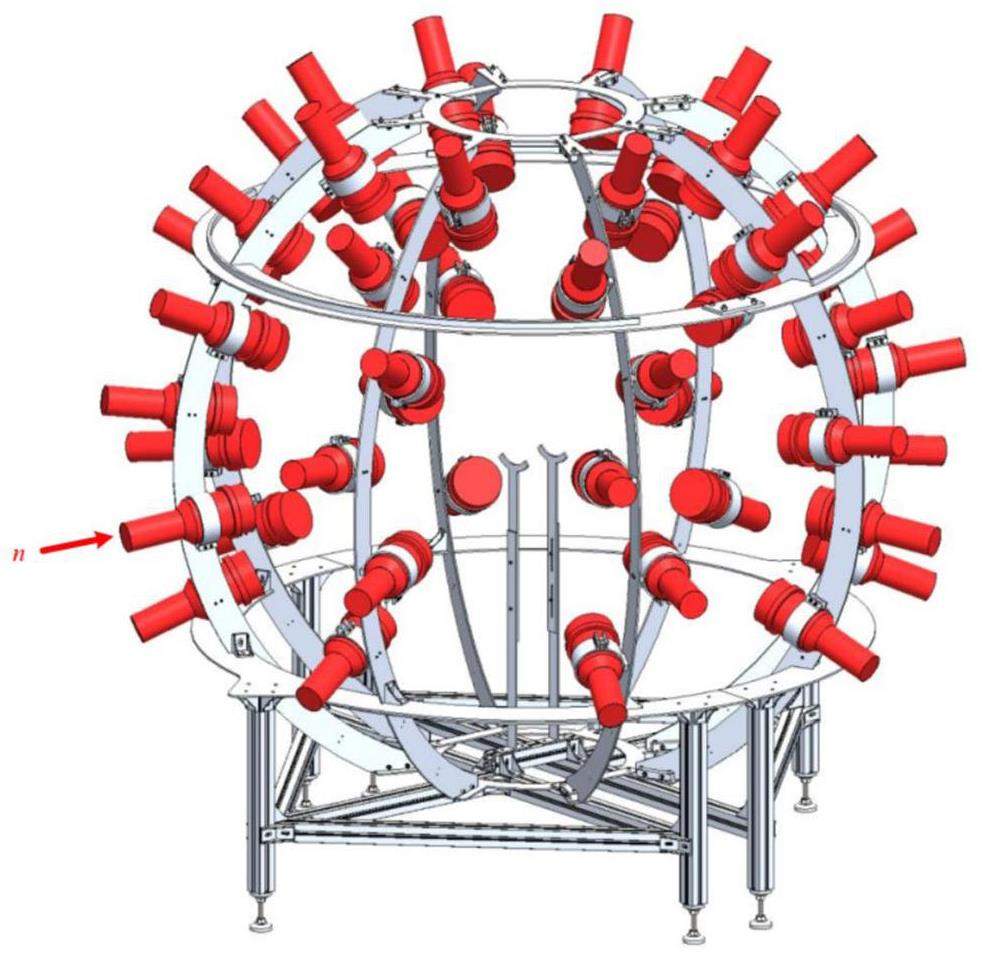
The specific parameters of the liquid scintillator are presented in Table 1. The sensitive volume of the liquid scintillator was Ø12.7 cm×5 cm, coupled with a 5-inch ET9823B photomultiplier tube (PMT). The PMT was powered by the EHS F020n module from iSeg [26] and the negative bias voltage was adjusted such that the measured energy for each detector ranged from 0 keVee to 6000 keVee. The housing material of the detector was aluminum. A schematic of the liquid scintillator detector array is shown in Fig. 1, consisting of eight columns, each with six detectors. The azimuthal angles between two adjacent columns were equal.
| Properties | Parameter |
|---|---|
| Light Output (% Anthracene) | 78 |
| Decay Time, Short Component (ns) | 3.2 |
| Specific Gravity | 0.874 |
| No. of H Atoms (cm-3) | 4.82×10²² |
| No. of C Atoms (cm-3) | 3.98×10²² |
| No. of Electrons (cm-3) | 2.27×10²³ |
The PPAC
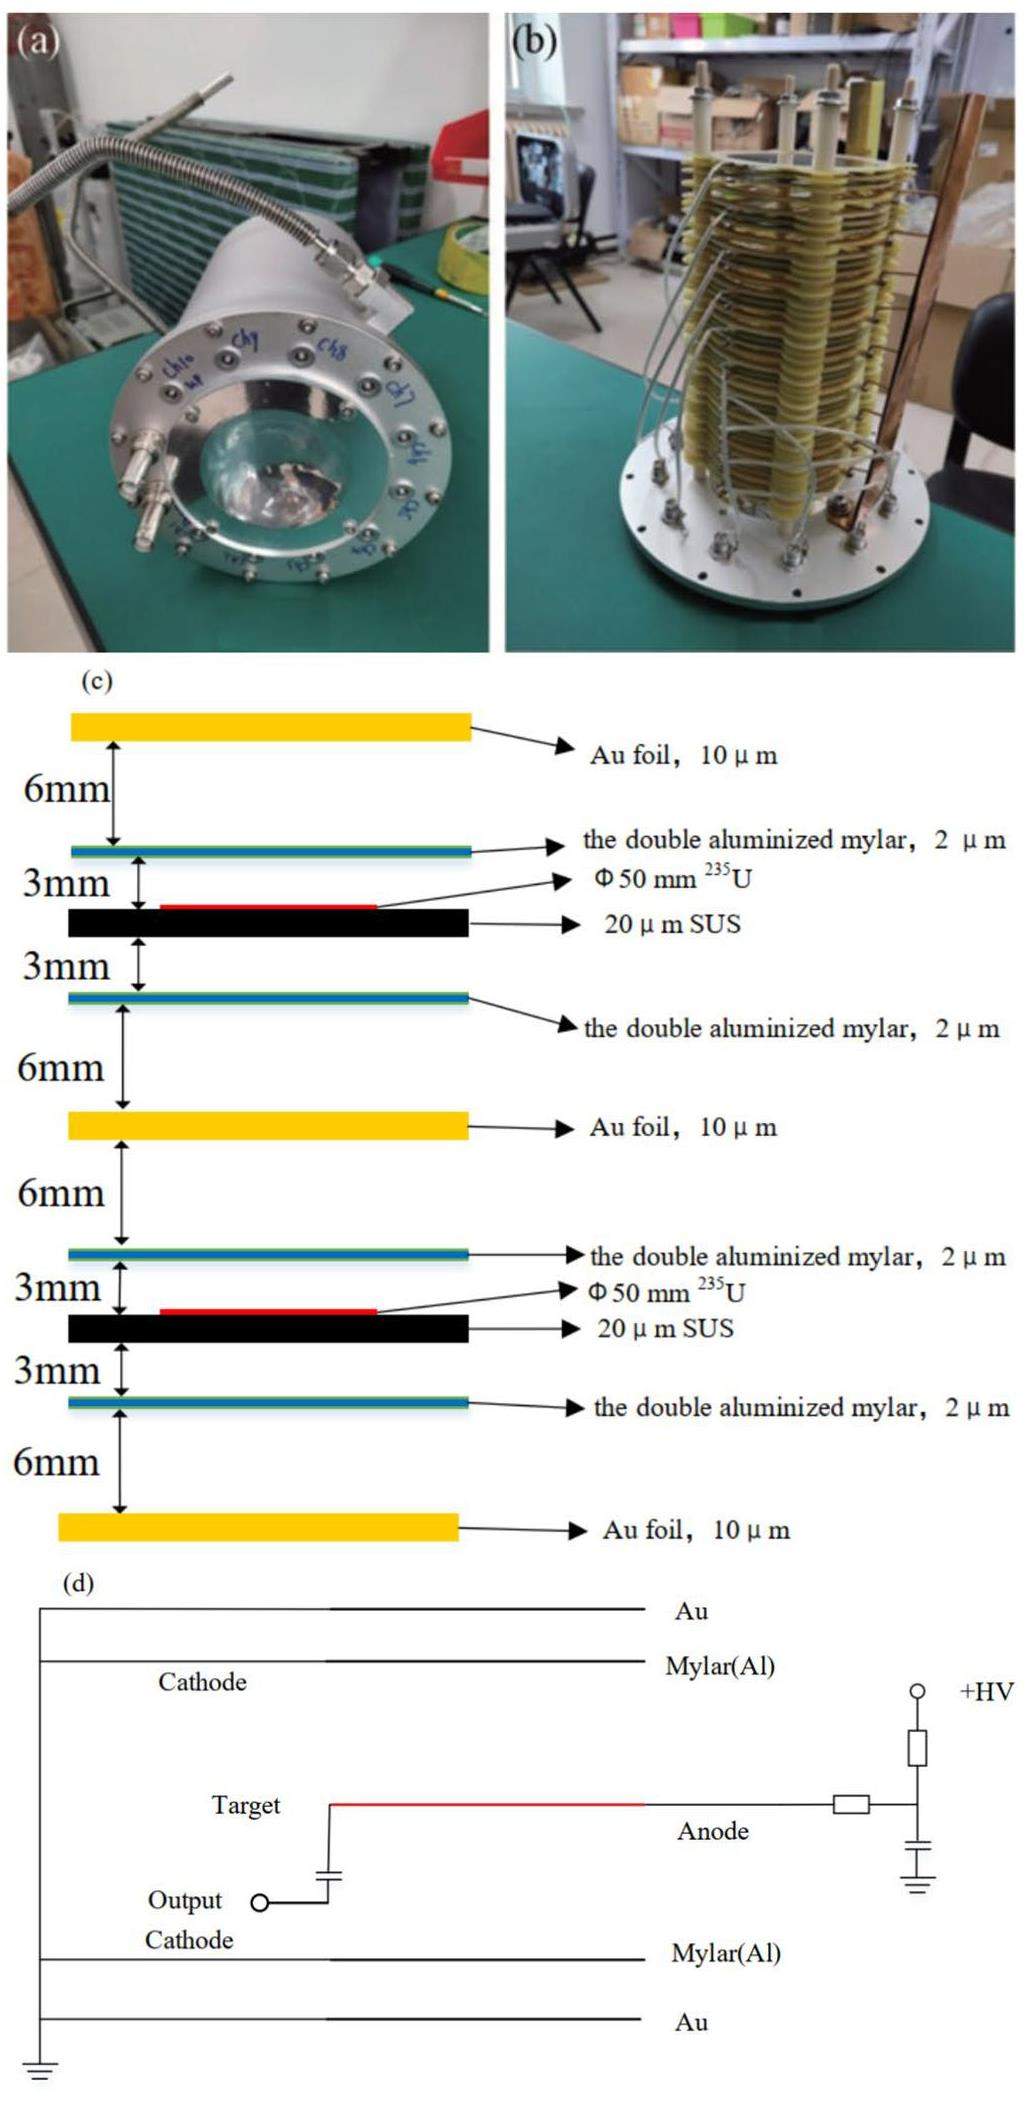
A PPAC was developed to measure the PFNS detailed in other publications [27]; only its main features are described here. The structure of PPAC is shown in Fig. 2, which has a maximum of 10 sample cells, each consisting of a target and aluminized Mylar on both sides. The aluminized Mylar was grounded, and the target was connected to a positive or negative high voltage. A gold foil with a thickness of 10m was used to prevent the impact of fission fragments from different cells. Each 235U target weighed approximately 5 mg to avoid stopping the fission fragments. During the experiment, the PPAC was filled with continuously flowing perfluoropropane gas at 750±50 Pa and used to measure neutron-induced fission events. The PPAC was made of aluminum and had an incident window with a diameter of 60 mm at each end. The incident window was made of Kapton film with a thickness of 25 μm. The bias voltage was 520 V. The detection of a fission fragment in a PPAC cell provides a starting signal for the TOF measurement of the outgoing fission neutrons. The structure of PPAC in the 252Cf test shown in Fig. 3 is simplified compared with the 235U experiment in Fig. 2, which is described in detail in Section 5.

Digital data acquisition system
The data acquisition system adopted was the GDDAQ [29, 30], developed by Peking University. It is easy to use without requiring special technical expertise and has been widely used in multiple nuclear physics experiments [31-36]. The GDDAQ used in this study comprised four 16-channel Pixie-16 500 MSPS 12 bit modules. PPAC signals were connected to module 0, and all liquid scintillators were connected to modules 1–3.
The incoming signals of liquid scintillators and the PPAC were digitized and a digital CFD filter, a fast and a slow trapezoidal filter were applied. The CFD, implemented in a signal processing field-programmable gate array (FPGA), provided a time signal related to the occurrence of the event. The CFD algorithm was unique for 500 MHz when compared to the one implemented in the 100 MHz and 250 MHz Pixie-16 modules since the Analog-to-Digital Converter (ADC) data arriving into the FPGA was initially slowed down by a ratio of 1:5 and the FPGA then utilized the weighing method to locate the CFD trigger point between two adjacent 2 ns ADC samples. The CFD algorithm is as follows [37].
The FPGA digitally implemented pulse registration, triggering, discrimination, pile-up detection, and a trapezoidal energy filter. The waveforms of each event could be customized by user-defined functions, such as the trigger threshold value, filter rise time, and flat-top time. The Digital Signal Processor (DSP) processed validated signals on an event-by-event basis, and non-validated events were eliminated with zero dead time. The DSP read the energy filter resulting from the FPGA, computed the pulse height, and performed other tasks such as constant fraction discrimination timing. It communicated with the host computer via an interface through a direct memory access (DMA) channel. A more thorough and detailed description can be found in Ref. [38]. The DSPs onboard the memory allowed it to expand and store the spectra.
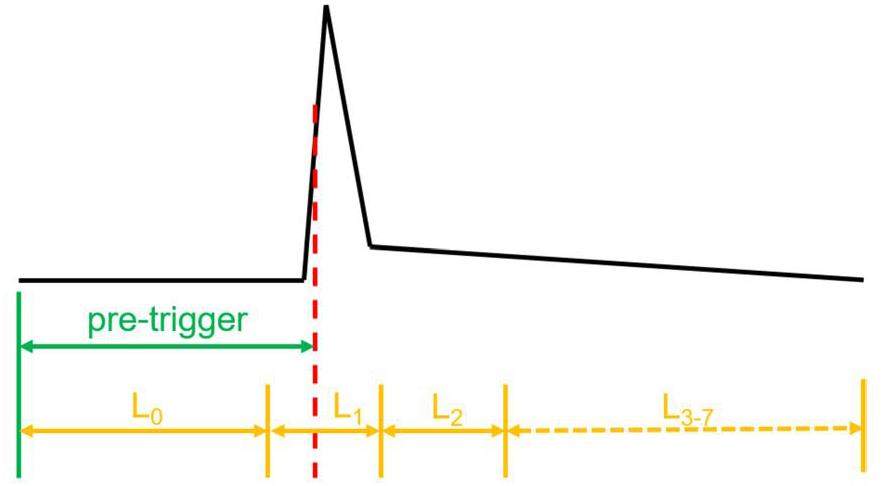
PSD was applied to the ADC traces of liquid scintillator to identify neutrons and γ-rays. Since PSD based on offline-recorded waveforms was limited by loadings and memory, the eight Charge-to-Digital Converter (QDC) sums of the Pixie-16 modules were utilized to perform PSD analysis online. The recording of QDC sums started at the pre-trigger trace, which preceded the trigger point. Subsequently, the eight QDC sums were computed individually without overlapping and ended when all eight intervals had passed. As shown in Fig. 4, at least three of the eight sums are required to obtain the short and long sums of the PSD, which can be expressed as
Performance Test
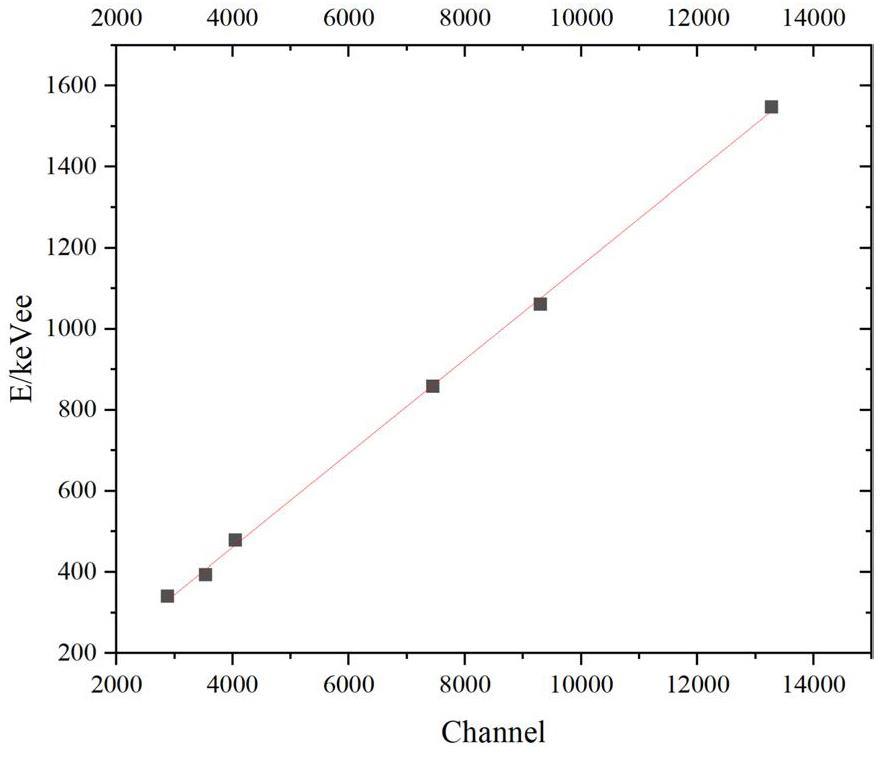
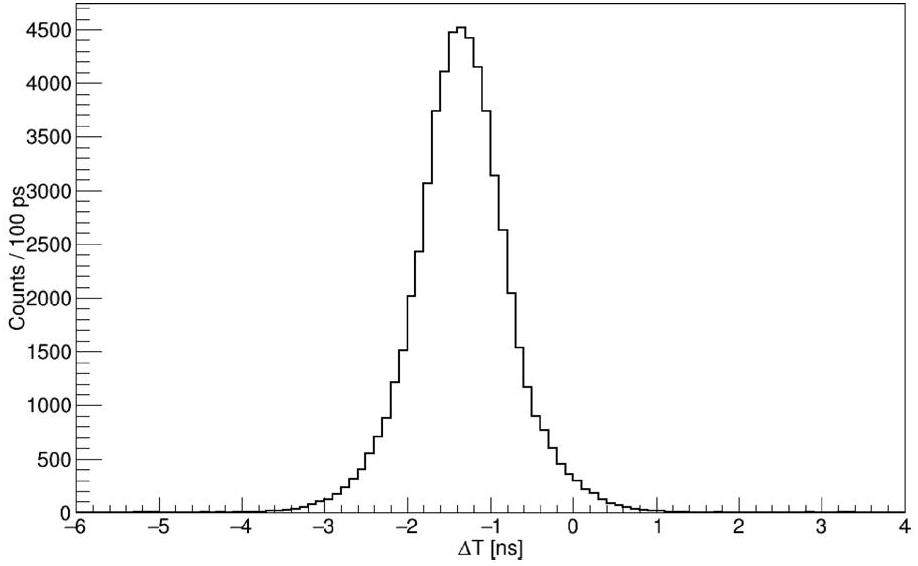
The liquid scintillation detector was energy-calibrated using radioactive sources. The entire energy range was divided into 65,536 channels, and the Compton edge of the 137Cs radioactive source was adjusted to 4000 ± 200 channels by tuning the high voltage of the liquid scintillation detector. Energy calibration was then performed using the 22Na and 207Bi radioactive sources; the resulting energy calibration curve of the liquid scintillation detector is shown in Fig. 5. The fast-time feature of the liquid scintillation detector was clearly demonstrated with a time resolution of 1.16 ns (Full width at half maximum, FWHM) and a 200 keVee threshold in the 207Bi source test, with two liquid scintillation detectors placed 20 cm away from the source. The time difference distribution is shown in Fig. 6. Additionally, the time resolution of PPAC was obtained as 1.08 ns (FWHM) by analyzing the time difference between the PPAC and liquid scintillation detector.
All the detectors in the liquid scintillator array are expected to have identical neutron detection efficiencies for precise measurement of the angular distribution in future 235U/238U experiments. The consistency of each liquid scintillation detector was tested in pairs using a 238Pu–13C neutron source. During the test, the 238Pu-13C neutron source is placed in the middle of the two liquid scintillation detectors on a three-dimensional (3D)-printed mold, as shown in Fig. 7a. The relative positions of the liquid scintillation detector and the 238Pu-13C neutron source were fixed, with a measurement time of 10 h.
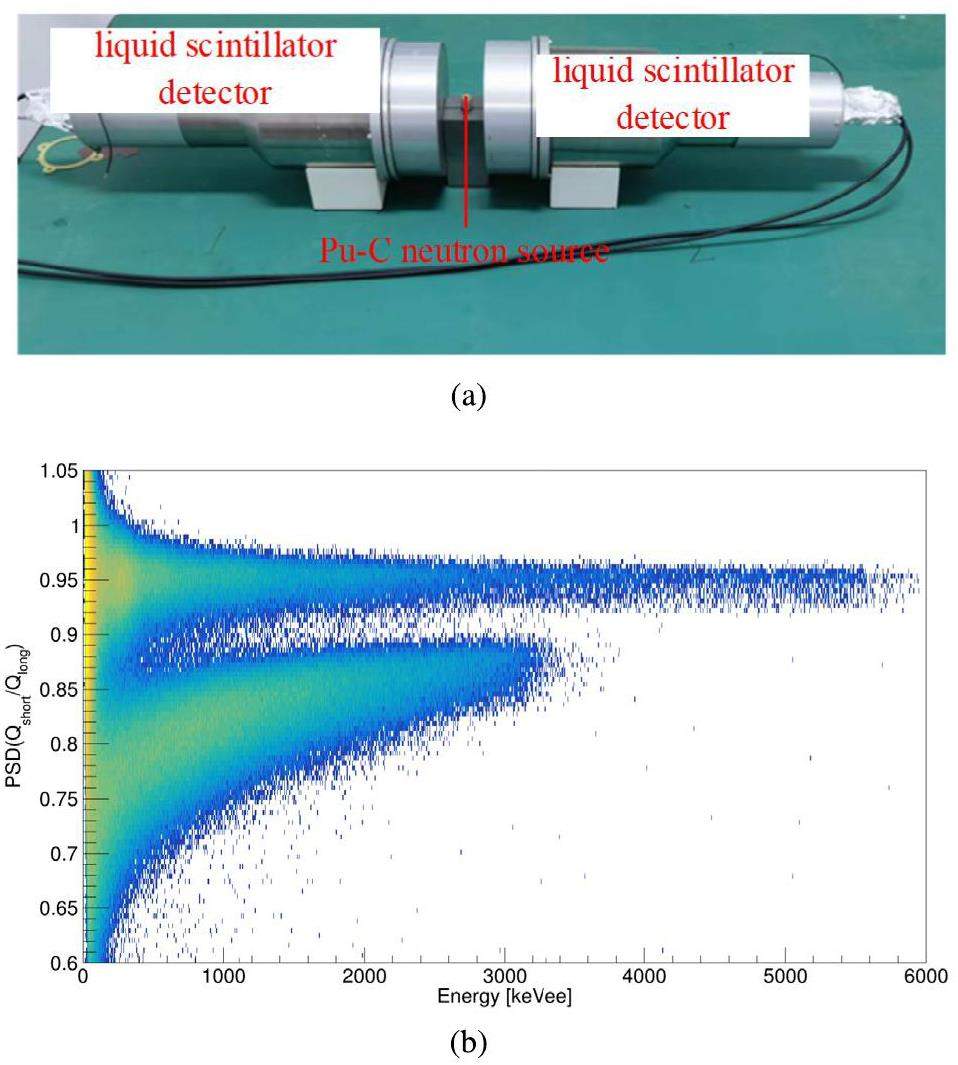
As mentioned in the previous section, the PSD techniques used to distinguish between pulses from neutrons and γ rays rely on differences in the generated pulse shapes. The pulses generated by neutrons have a longer tail than those generated by γ rays because the neutron pulses originate from triplet state interactions (delayed fluorescence), and the pulses produced by γ rays result from a singlet state de-excitation (prompt fluorescence). Therefore, the difference in the ratio of the charge in the fast component to the total charge in the pulse (PSD value) from the two sources can be calculated and used to discern the type of incident particles. The PSD value of the neutron pulses should be lower than that of the γ-ray pulses for the same deposited total charge. By performing PSD on the measured data (Fig. 7b, the number of neutrons and γ events detected by the liquid scintillator detectors were obtained and normalized to the average values according to the counts detected by the entire array. The results of the consistency test showed that the fluctuations in the neutron and γ event counts detected by almost all detectors were within 5%, which satisfied the experimental requirements.
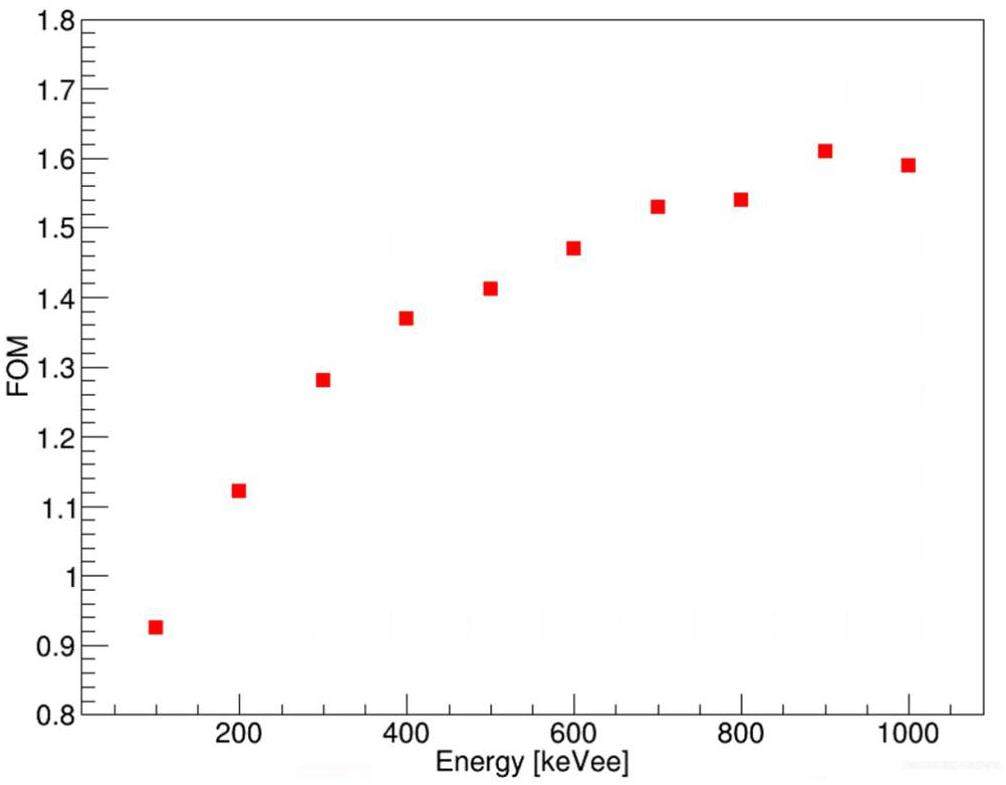
The separation between the neutron and γ-ray signals can be quantified and used to determine the performance metrics. A standard figure of merit (FOM) has been identified for fast neutron detectors and is used to establish their ability to discriminate between pulses generated by γ rays and neutrons. The FOM is calculated from the histogram of the PSD value versus the peak height data after performing PSD to identify the neutron and γ-ray pulses and is defined as follows (note that this definition assumes that the pulse distributions are Gaussian):
Geant4 Simulation
Precise PFNS measurement requires the counts of scattered neutrons whose energy spectra deviate from those of the primary prompt fission neutrons to be discarded. Multiple-neutron scattering has been demonstrated to significantly influence the detected low-energy neutron spectrum [39]. The primary consequence is that the PFNS must be extracted from the measured neutron spectrum using a deconvolution procedure or other methods that fully account for multiple-neutron scattering. In addition, multiple scattered γ-rays invade the fast neutron region in the TOF spectrum, forming a smooth background and overestimating the neutron yield. Therefore, a Monte Carlo simulation is required to assist the experimental data analysis.
The model of the liquid scintillator detectors, as well as its aluminum casing and support, was first constructed using SolidWorks software. To import such complex geometries into the Geant4 simulation program [40], the CADMesh method [41] was chosen to enable the Geant4 program to read ASCII STL files. Advantageously, the CADMesh method can be easily used to handle complex 3D shapes and curved surfaces, such as detector arrays comprising numerous intricate or irregular geometric elements. A geometric simulation and typical subassemblies are shown in Fig. 9. All the PMTs were ignored in the simulation. A cement wall surrounding the array was constructed due to its significant effect on neutron scattering. The horizontal distance from the array to the wall was approximately 4 m, whereas the distance from the ceiling was 6 m.

Two types of primary sources were implemented in the simulation: a neutron source and a γ source. The neutron energy was subject to a Maxwell distribution, whereas the energy spectrum of γ ray was adopted from Ref. [42]. Both the neutrons and γ rays were isotropically emitted at a 4π solid angle.
Selecting an appropriate physical model is crucial for Geant4 simulations. We considered neutron elastic scattering, inelastic scattering, fission, and capture processes using G4NeutronHPElastic, G4NeutronHPinelastic, G4NeutronHPFission, and G4NeutronHPCapture models. The interaction between γ rays and charged particles and materials has been well described by G4EmStandardPhysics. The deposited energy can be traced at each step of the particle transportation using the embedded algorithms of Geant4. The particles were designed to be transported via the functions of the action class in each step until they were absorbed in certain volumes or escaped preset cutoff areas. During the simulation, each particle was labeled with a generation number. The information associated with the particles was transferred via a user-set customized function to the TrackingAction class for further processing.
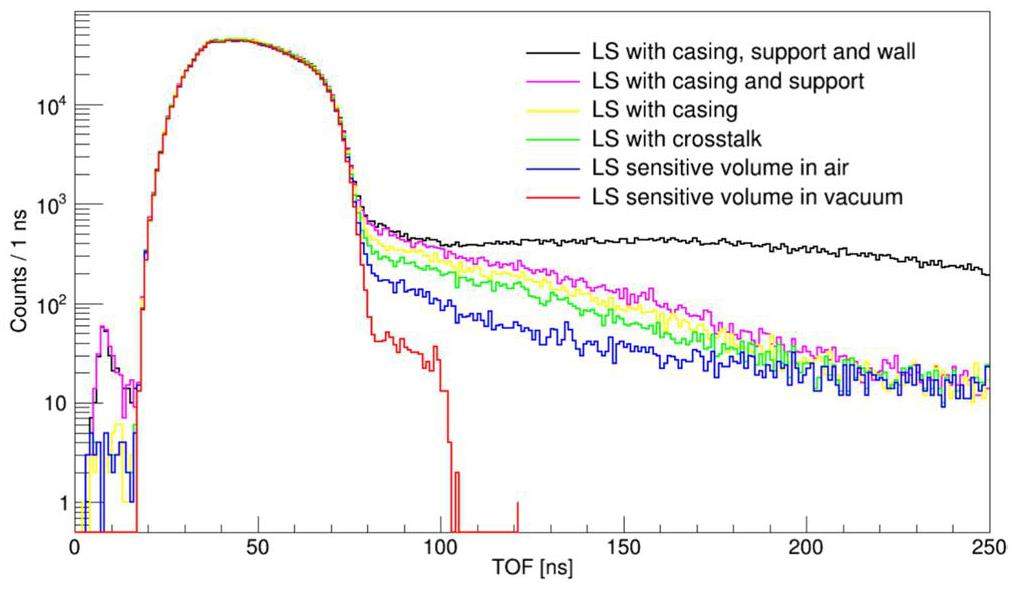
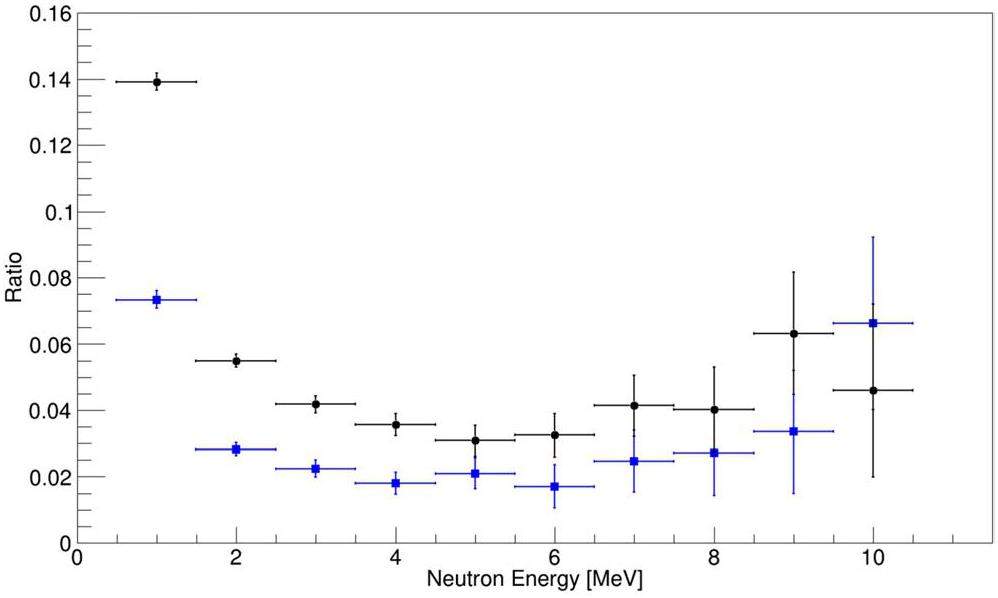
The neutron scattering contributions for each component at the 200 keVee threshold are listed in Table 2. The major contribution was attributed to the cement wall around the array, followed by the liquid scintillation material and its appurtenances. The simulated neutron spectra, including multiple scattering under different conditions, are shown in Fig. 10. When the neutron flight time was greater than 100 ns, the counts were mainly contributed by the neutrons scattered by the environment. Because the effectively measured energy of the fission neutrons ranged from 1 MeV to 10 MeV for the liquid scintillator (the corresponding flight time ranged from 22.9 ns to 72.3 ns), the scattered neutrons had no significant effect on the parts of interest of the PFNS. Figure 11 compares the growth of the simulated neutron count yield after considering only the detector crosstalk and all components in Table 2, indicating that the contributions from the environment are comparable to those from the crosstalk between the liquid scintillation detectors.
| Component | Contribution (%) |
|---|---|
| Air in the Room | 0.56 |
| LS crosstalk | 3.73 |
| LS casing | 2.04 |
| Support | 1.30 |
| Wall | 6.19 |
252Cf test results
The neutron fission spectrum of 252Cf is often regarded as the standard energy spectrum because it has been extensively studied experimentally and theoretically [28]. The branching ratio of the 252Cf spontaneous fission was 3.09%, the average number of neutrons emitted per spontaneous fission was 3.756, and the neutron yield was 2.31× 10¹² s-1·g-1. The relative efficiency of the liquid scintillation detector was calibrated using a 252Cf radioactive source, which underwent approximately 2400 fissions/s at the time of measurement. Most fissions were from 252Cf, with small contributions from 250Cf(sf) (0.2%) and 248Cm(sf) (6×10⁻⁵%). The different decay rates resulted in an increasing fraction of 250Cf and 248Cm relative to 252Cf. However, the fission contributions from 250Cf(sf) and 248Cm(sf) were negligible and thus ignored in further analyses. The structure of the PPAC in the 252Cf test was simplified compared to that in the 235U experiment. As shown in Fig. 3, the 252Cf radioactive source is placed inside the PPAC, and the generated fission fragments pass through the aluminized Mylar, ionizing the perfluoropropane gas between the Mylar to produce a starting signal.
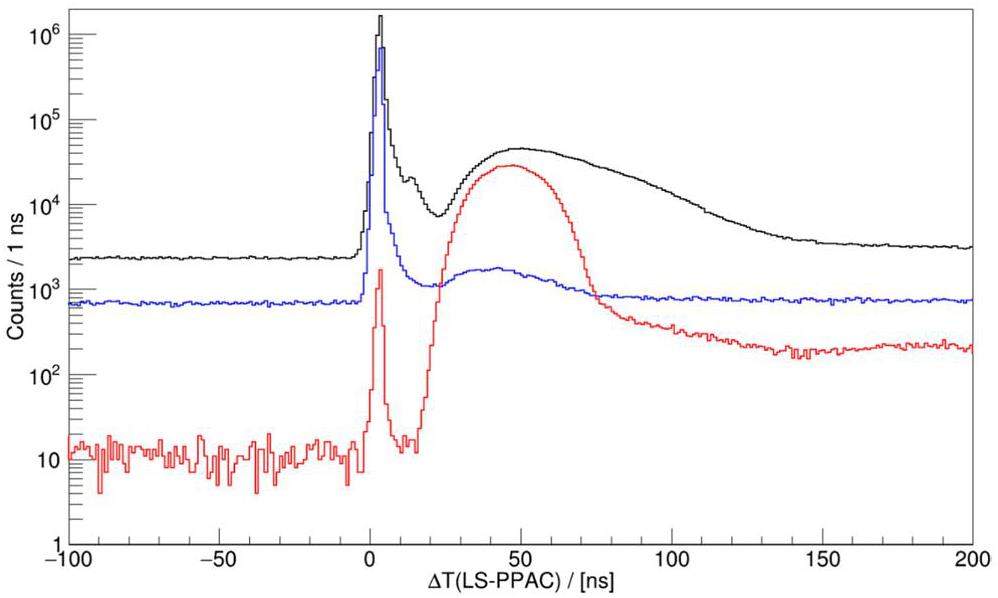
The measurement data for the 252Cf source were collected for approximately 290 h. The liquid scintillation detectors were placed on the detector array support, and the PPAC was placed at the center of the array, 1 m from the detector surface. Each detector was characterized as both a neutron and γ detector in the analysis, with signals passing through a PSD gate separated and treated accordingly in the subsequent analysis steps. The discrimination threshold was set to 200 keVee, which corresponded to a neutron energy of 1 MeV. Figures 12a and b show the TOF spectra of the liquid scintillator signals before and after PSD, respectively. The PSD greatly suppresses the contamination from γ rays, whereas there are still some γ events that survive the PSD cuts appearing at 3.3 ns, corresponding to the TOF of light propagating a distance of 1 m. The TOF spectra (Fig. 13 shows the discrimination of neutrons and γ rays by PSD.

α particles were emitted from 252Cf simultaneously with spontaneous fission, which generated indistinguishable signals in PPAC. These α events produce spurious coincidences with the neutron events detected in the liquid scintillator detectors because they do not correlate with fission fragments. As shown in the energy spectrum of PPAC (Fig. 14, α particles are typically detected at low-pulse integrals and fissions at higher integrals. Therefore, fission events in PPAC targets have a minor overlap with spontaneous α detection in the pulse integral space. Although no clear separation exists between α and fission detection integrals, a cut is introduced into the PPAC integral spectrum to eliminate as many α particles as possible while retaining most of the detected fission signals, as shown in Fig. 14.
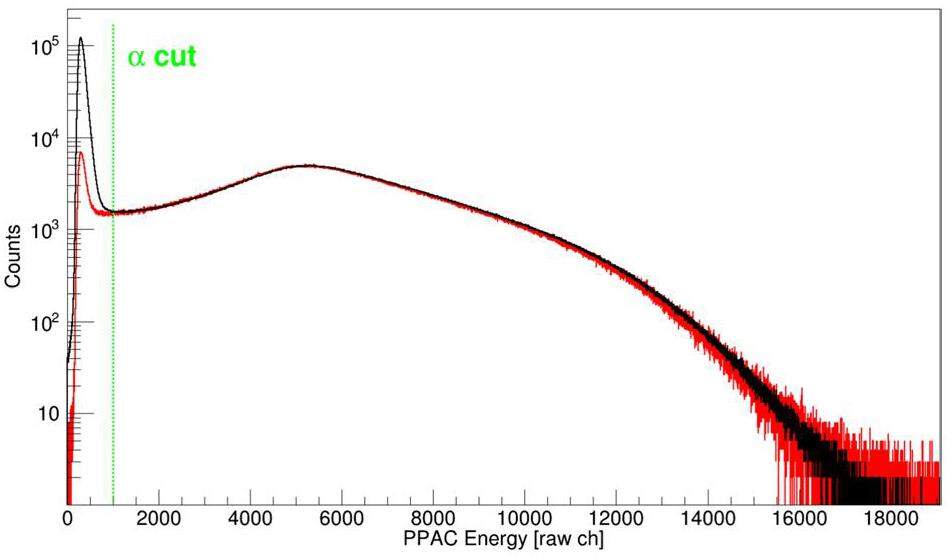
The random coincidence background measurement must be subtracted to obtain accurate PFNS. It is mainly generated by random coincidences between the PPAC and liquid scintillator signals, i.e., between fission neutrons and α signals, fission neutrons and fission signals that do not produce neutrons, or fission events and non-fission neutron signals. In Fig. 13, the counts in the negative time region are random coincidence backgrounds, and the backgrounds in the positive time region should be symmetrical and can be subtracted accordingly to obtain a clean fission neutron spectrum. Notably, the data obtained after cutting, as shown in Fig. 14, inevitably includes a portion of the detected α-particles. Nevertheless, since these are random detections, not in true coincidence with fission neutrons, they can be easily removed using the random coincidence background technique.
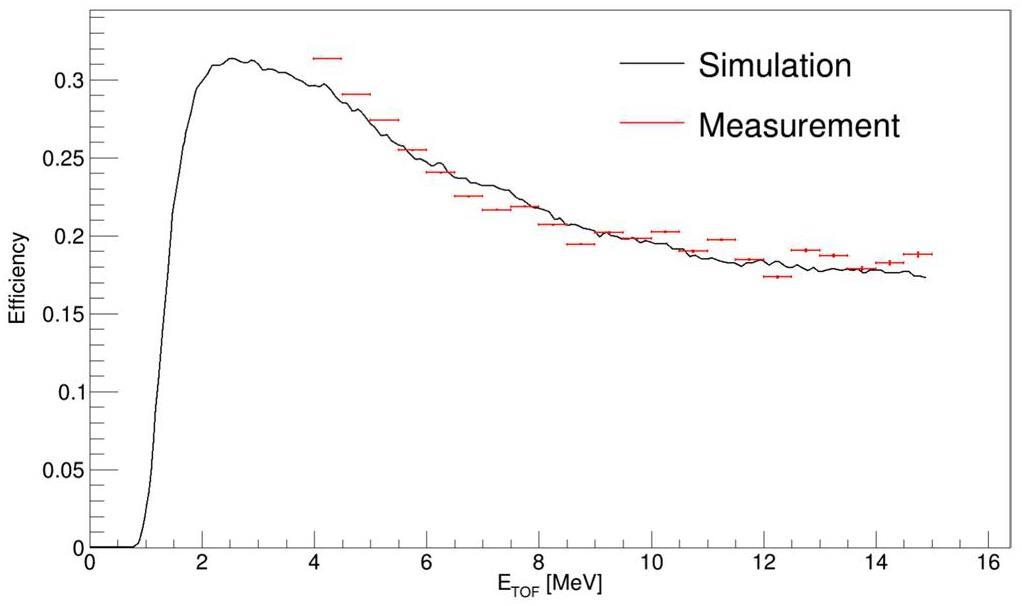
The efficiency of the detection array with 48 scintillation detectors after data reduction is shown in Fig. 15. The neutron yield detected at energies below 4 MeV was significantly affected by the support and wall, which could not be perfectly simulated. This influence increased at 4 MeV (Fig. 11, which was difficult to evaluate. Therefore, the neutron efficiency at low energies was not displayed. Nevertheless, the experimental measurements clearly agree with the Geant4 simulation results, which demonstrates the reliability of the detection array.
Conclusions and outlook
An array composed of 48 liquid scintillation detectors and a PPAC was developed in CIAE to measure the PFNS of the actinide nuclei. Efficiency and energy calibrations were performed for all the liquid scintillators, and their efficiency consistency was found to be better than 5%. The time resolutions of the PPAC and liquid scintillator were measured to be 1.08 ns and 1.16 ns using 252Cf and 207Bi sources, respectively. The PSD of the liquid scintillator was utilized to identify neutron and γ signals on an event-by-event basis, and the FOM was deduced as 1.12 at 200 keVee threshold. The contribution from multiple scattered neutrons to the PFNS was evaluated using Geant4 simulations, and those originating from the environment were found to be comparable to the crosstalk between the detectors. The neutron efficiency of the entire detection array was calibrated by measuring the 252Cf spontaneous fission source and was demonstrated to be consistent with the Geant4 simulation results, which verified the reliability of the detection array.
Uncertainty quantification of prompt fission neutron spectrum for n (0.5 MeV) + 239Pu
. Nucl. Sci. Eng. 166, 254-266 (2010). https://doi.org/10.13182/NSE09-10Event-by-event study of prompt neutrons from 239Pu(n,f)
. Phys. Rev. C 80,Energy spectrum of neutrons from thermal fission of 235U
. Phys. Rev. 87, 1037-1041 (1952). 10.1103/PhysRev.87.1037https://doi.org/10.1103/PhysRev.87.1037Fission neutron spectra and nuclear temperatures
. Phys. Rev. 113, 527-541 (1959). 10.1103/PhysRev.113.527https://doi.org/10.1103/PhysRev.113.527Scale method for evaluation of fission neutron spectra
. Nucl. Sci. Eng. 169, 290-295 (2011). https://doi.org/10.13182/NSE11-6New calculation of prompt fission neutron spectra and average prompt neutron multiplicities
. Nucl. Sci. Eng. 81, 213-271 (1982). https://doi.org/10.13182/NSE82-5Improved Los Alamos model applied to the neutron induced fission of 235U and 237Np
. Ann. Nucl. Energy 28, 419-435 (2001). https://doi.org/10.1016/S0306-4549(00)00069-4Monte Carlo Hauser-Feshbach predictions of prompt fission γ rays: Application to nth+235U, nth+239Pu, and 252Cf (sf)
. Phys. Rev. C 87,Investigation of phenomenological models for the Monte Carlo simulation of the prompt fission neutron and γ emission
. Phys. Rev. C 82,Prompt fission neutron spectra of 238U and 232Th above emissive fission threshold
. Phys. Rev. C 69,Prompt fission neutron emission in neutron and proton induced reactions at intermediate energies
. Phys. Rev. C 75,Experimental determination of the yield of “scission” neutrons from the spontaneous fission of 252Cf
. J. Exp. Theor. Phys. 125, 619-637 (2017). https://doi.org/10.1134/S1063776117080209A new fission chamber dedicated to Prompt Fission Neutron Spectra measurements
. Nucl. Instrum. Methods Phys. A 833, 1-7 (2016). https://doi.org/10.1016/j.nima.2016.06.137Validation of Geant4 and MCNPX-PoliMi simulations of fast neutron detection with the EJ-309 liquid scintillator
. Nucl. Instrum. Methods Phys. A 714, 98-104 (2013). https://doi.org/10.1016/j.nima.2013.02.017Measurement of U-235 fission neutron spectra using a multiple gamma coincidence technique
, in Aip Conf. Proc. 769, pp. 1051-1053 (2005).A method to measure prompt fission neutron spectrum using gamma multiplicity tagging
. Nucl. Instrum. Methods Phys. A 805, 95-100 (2016). https://doi.org/10.1016/j.nima.2015.08.060Li-glass detector response study with a 252Cf source for low-energy prompt fission neutrons
. Nucl. Instrum. Methods Phys. A 703, 213-219 (2013). https://doi.org/10.1016/j.nima.2012.10.137Pulse shape discrimination in impure and mixed single-crystal organic scintillators
. IEEE T. Nucl. Sci. 58, 3411-3420 (2011).Measurement and simulation of the leakage neutron spectra from Fe spheres bombarded with 14 MeV neutrons
. Nucl. Sci. Tech. 34, 182 (2023). https://doi.org/10.1007/s41365-023-01329-6Benchmark experiment on slab 238U with D T neutrons for validation of evaluated nuclear data
. Nucl. Sci. Tech. 35, 29 (2024). https://doi.org/10.1007/s41365-024-01386-5Measurement of the prompt neutron spectrum from thermal-neutron-induced fission in U-235 using the recoil proton method
. Nucl. Sci. Tech. 30, 112 (2019). https://doi.org/10.1007/s41365-019-0633-zNeutron detector array at IUAC: Design features and instrumentation developments
. Pramana J. Phys. 83, 807-815 (2014). https://doi.org/10.1007/s12043-014-0872-9Characterization of the neutron/γ-ray discrimination performance in an EJ-301 liquid scintillator for application to prompt fission neutron spectrum measurements at CSNS
. Radiation Measurement 151,Evidence for spherical-oblate shape coexistence in 87Tc
. Phys. Rev. C 106,Development of parallel plate avalanche counters for prompt fission neutron spectrum measurement
. Nucl. Tech. 44, 55-62 (2021). https://doi.org/10.11889/j.0253-3219.2021.hjs.44.120403A general-purpose digital data acquisition system (GDDAQ) at Peking University
. Nucl. Instrum. Methods Phys. A 975,A general-purpose data acquisition system and a waveform analysis algorithm based on digitization
. Chin. Sci. Bull. 66, 3553-3560 (2021). https://doi.org/10.1360/TB-2021-0552Development of a pile-up pulse recovery algorithm for the LaBr3 detector
. Nucl. Instrum. Methods Phys. A 1063,Progress on the magnetic rotation in the nuclei of A~60 and A~80 mass regions
. Chin. Sci. Bull. 68, 1082-1089 (2023). https://doi.org/10.1360/TB-2022-1103Probing the nature of the conjectured low-spin wobbling bands in atomic nuclei
. Phys. Lett. B 828,Performance of digital data acquisition system in gamma-ray spectroscopy
. Nucl. Sci. Tech. 32, 79 (2021). https://doi.org/10.1007/s41365-021-00917-8First observation of candidate chiral doublet bands in Z=37 Rb isotopes
. Phys. Rev. C 104,Performance of the CAT-TPC based on two-dimensional readout strips
. Nucl. Sci. Tech. 32, 85 (2021). https://doi.org/10.1007/s41365-021-00919-6CFD Algorithm for 500 MHz Pixie-16, Tech. rep.
,PIXIE-16 User's Manual. Version 3.03
, 2018. http://www.xia.comMultiple-scattering corrections to measurements of the prompt fission neutron spectrum
. Nucl. Data Sheets 123, 135-139 (2015). https://doi.org/10.1016/j.nds.2014.12.024Geant4—a simulation toolkit
. Nucl. Instrum. Methods Phys. A 506, 250-303 (2003). https://doi.org/10.1016/S0168-9002(03)01368-8A CAD interface for Geant4
. Australas Phys. Eng. Sci. Med. 35, 329-334 (2012). https://doi.org/10.1007/s13246-012-0159-8LLNL Fission Library
. https://nuclear.llnl.gov/simulation/The authors declare that they have no competing interests.

