Introduction
Formation density is a key parameter in geological analysis, interpretation, and evaluation during petroleum exploration and development. It plays an important role in lithology classification, porosity calculation, and the identification of hydrocarbon-bearing formations. The traditional gamma-gamma density (GGD)-logging technique uses 137Cs radioisotope sources to determine formation density by measuring the intensity of Compton-scattered gamma rays in the formation. This technique has been used for decades and was proven reliable; however, its engineering application is becoming increasingly restricted because of the potential risks and hazards associated with the use of chemical sources [1-5]. Therefore, using controllable sources instead of chemical radioactive sources for measurements is an inevitable trend in the development of density logging [6-10].
Wilson et al., Odom et al., and Badruzzaman et al. proposed that secondary gamma-ray sources generated through the emission of fast neutrons from a deuterium-tritium (D-T) neutron generator (a type of controllable neutron source) can be used instead of chemical sources in cased holes for density measurements [11-13]. The formation density is determined by measuring the attenuation of gamma rays produced by neutron inelastic scattering (neutron-gamma density (NGD) logging) [14-16]. Compared with GGD logging, NGD logging involves more complex response mechanisms and physical processes. The NGD measured response is related to the attenuation of gamma rays and is affected by the fast-neutron-transport process that dominates the spatial distribution of secondary gamma-ray sources [17, 18]. Therefore, NGD-logging measurements require dynamic monitoring and correction for the effects of neutron transport to enhance the contribution of gamma-ray attenuation. Odom et al. designed a three-detector NGD measurement system based on the analysis of NGD-logging principles [19]. The measured fast-neutron counts and inelastic gamma-diffusion lengths were converted to formation densities using the established transformation grids. Jacobson et al. combined the captured gamma-ray ratio with the inelastic gamma-ray ratio measured by near and far detectors to determine the density-response relationship using multiple regression [20]. In 2005, Schlumberger developed an integrated logging-while-drilling (LWD)-tool prototype, known as the EcoScope, that can provide multiple formation-evaluation services [21]. It uses the epithermal-neutron count rate to compensate for the effect of neutron transport in the NGD measurements. Schlumberger launched NeoScope, the only commercial LWD tool that can provide NGD-measurement services. However, its density-measurement accuracy is lower in complex gas-filled and heavy-mineral formations than in conventional formations [22, 23]. Yu et al. further analyzed the effects of various borehole conditions on NGD measurements using Monte Carlo simulations [24]. Zhang et al. and Zhang et al. proposed a new theoretical NGD-calculation method based on neutron-gamma-coupled field theory, which achieved high-density calculation accuracy in simulated conventional formations [25, 26]. Inanc et al. and Yu et al. comparatively analyzed the energy levels and attenuation processes of gamma rays released by chemical and secondary gamma-ray sources, and concluded that relatively high-energy secondary gamma rays are more affected by pair production [27, 28]. Wang et al. introduced gamma-ray count rates within high- and low-energy windows into the derived density-calculation algorithm to reduce the impact of pair production [29, 30]. However, the effectiveness and performance of the algorithm were only verified based on theoretical modeling data. Most studies on NGD logging have focused on theoretical methods and numerical simulations. Furthermore, algorithms for accurate density calculations under complex formation conditions have not been adequately studied. In addition, detailed data-processing algorithms for the NeoScope tool have not yet been fully disclosed. Therefore, systematic data-processing methods combined with real engineering measurements are lacking, which restricts the design and development of related controllable source-density logging tools.
In this study, the relationship between formation density and the measured inelastic gamma count rate is theoretically derived based on the principle and related physical processes of NGD logging. Subsequently, a Monte Carlo model is established using the NeoScope tool as reference. Data-processing methods for extracting the net inelastic gamma count rate and correcting for the effect of neutron transport are studied using simulation data from different formations. To solve the problem of low calculation accuracy in complex gas-filled and heavy-mineral formations, the cause of inaccurate neutron-transport corrections is analyzed based on the physical mechanism. A new correction method for the fast-neutron effect is proposed based on theoretical analysis. Finally, the measured data are processed and used to verify the effectiveness and performance of the proposed data-processing algorithms. This study is of great significance for promoting the research and development of controllable-source density-logging tools and techniques.
D-T source NGD-logging technique
In neutron-gamma density logging while drilling, a controllable neutron source is used instead of a chemical source to measure the formation density. The 14 MeV monoenergetic fast neutrons emitted by a D-T controllable source enter the formation and undergo inelastic scattering with the atomic nucleus of the formation, releasing high-energy inelastic gamma-rays [31]. These secondary gamma rays are mainly attenuated by the Compton-scattering effect in the formation and are then received by the detectors. Because Compton scattering is highly correlated with the formation density, the formation density can be determined based on the measured inelastic gamma count rate.
Compared with traditional GGD measurements, NGD logging involves more complex physical processes that are affected by a higher number of factors. The secondary gamma-ray source used in NGD measurements is no longer a point source, but a volumetric source. However, its position and intensity are not fixed. The spatial distribution of secondary gamma-ray sources is determined by the transport process of fast neutrons in the formation. Therefore, the measured inelastic gamma count rate is affected by two physical processes: neutron transport and gamma-ray attenuation. The relationship between the inelastic gamma count rate and formation density must be derived to study theoretical density-calculation methods for controllable-source NGD logging to provide a theoretical basis for subsequent research on data-processing algorithms.
The inelastic gamma count rate measured by a gamma-ray detector can be expressed as [32] follows:
Considering its complex quantitative characterization and the subsequent solution process, the above equation must be simplified. Only the attenuation of neutrons and gamma rays in a single energy group is considered, and the influence of energy on the neutron cross section and gamma-ray-attenuation factor is ignored. Differences in the number of gamma-rays produced by inelastic scattering for different atomic nuclei are simultaneously ignored. Based on the assumptions above, Eq. (1) can be simplified as follows:
The gamma-ray-transmission function follows an exponential decay law:
The following equation can be obtained by substituting Eq. (3) into Eq. (2):
According to Eq. (5), the fast-neutron-scattering cross section ∑fast in the density-response relationship reflects the effect of the neutron-transport process, which must be corrected using fast-neutron detectors. Owing to factors such as detector size and downhole high-temperature and high-pressure conditions, a fast-neutron detector with high neutron sensitivity and a small volume suitable for LWD measurements in the practical development of logging tools can be difficult to obtain. Therefore, the use of downhole fast-neutron detectors is limited. This study uses the epithermal-neutron count rate to compensate for the influence of neutron transport on the NGD measurements using the NeoScope tool [21]. However, the effect of neutron transport in complex gas-filled and heavy-mineral formations cannot be accurately corrected, which seriously affects measurement accuracy. To solve this problem, the reason for this must be further analyzed, and corresponding additional correction methods should be explored.
Computational model
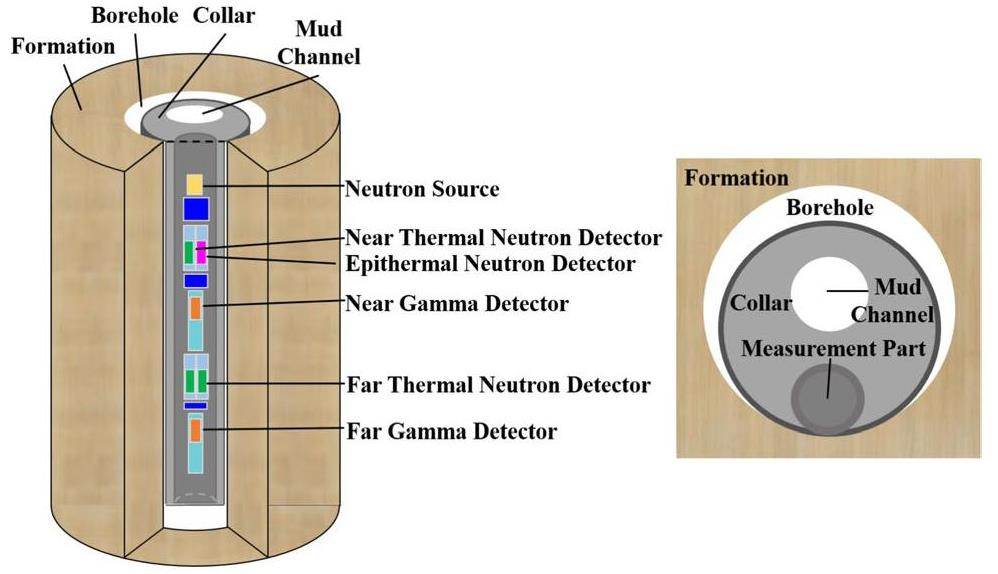
In this study, a 3D numerical model comprising a logging tool, borehole, and formation is built based on the Super Monte Carlo Program for Nuclear and Radiation Simulation (SuperMC) (as shown in Fig. 1 [33]. The logging tool consists of a controllable D-T neutron generator, an epithermal-neutron detector (adding a moderator and shielding outside the 3He counting tube to measure epithermal neutrons), two NaI gamma-ray detectors, and three 3He thermal neutron detectors. Shields are placed between the detectors and between the D-T neutron generator and detectors. Specific structural parameters such as dimensions and detector spacing are set using the NeoScope tool as a reference. The mud channel and logging-tool components are placed eccentrically in the drill collar. The side of the logging tool with detectors is placed against the borehole wall. The borehole diameter is 22 cm. The borehole and mud channel are filled with fresh water. The pulse period of the neutron generator is set to 35 μs, including 10 μs for the pulse emission and 25μs for the delay measurement. Each pulse period comprises three measurement time gates: the Burst time gate (0-10 μs), Early time gate (11-15 μs), and Late time gate (16-35 μs). The inelastic gamma count rate can be obtained by setting the cutoff energy of neutrons to 0.1 MeV to control the reaction type. Neutron-interaction processes with energies below 0.1 MeV are ignored to eliminate the contribution and impact of neutron-capture interactions. The energy range for measuring the net inelastic gamma count rate is set as 0.1-10 MeV. During each simulation, 3×10⁸ neutrons are sampled to ensure that the statistical error of each simulation is less than 1%.
Data-processing methods
To further study the data-processing methods for NGD logging, the responses of the logging tool in three conventional formations and four mudstone-mineral formations (alumina, illite, kaolinite, and glauconite) with varying porosities and water-/gas-bearing conditions are simulated using the established Monte Carlo numerical model. Data-processing algorithms for the entire process, from the initial measurement of the signals by the detectors to the output of the final density-calculation results, are studied. They primarily include methods for extracting the net inelastic gamma count rate, correcting for the effects of neutron transport, and the identification and additional correction of fast-neutron effects. The accuracy and performance of the data-processing algorithms for various formations are verified using simulated data, which provides theoretical guidance for subsequent actual measurement-data processing.
Net inelastic gamma-count-rate extraction
In addition to the inelastic scattering between fast neutrons released by the D-T source and formation nuclei, gamma rays are also produced by neutron-capture interactions (captured gamma rays) [34, 35]. The net inelastic gamma count rate can be obtained by appropriately setting the cutoff energy during theoretical modeling; however, the gamma response measured by the logging tool used in the field is a mixed signal of gamma rays produced by inelastic scattering and neutron capture (the effect of the gamma background is ignored in this study). Therefore, the methods for extracting the net inelastic gamma count rate must be studied to extract the inelastic gamma signal from the measured total gamma-ray signal and eliminate the impact of captured gamma rays on NGD measurements.
The response-time spectra of the total gamma-rays, inelastic gamma-rays, and captured gamma-rays within a single pulse period are obtained by Monte Carlo simulations, as shown in Fig. 2. In Fig. 2(a), the blue area represents the contribution and distribution of inelastic gamma rays, and the orange area represents the contribution and distribution of captured gamma rays. The inelastic gamma-ray signals are mainly concentrated in the pulse-emission stage, whereas the captured gamma-ray signals are distributed throughout the pulse period. Among the gamma-ray responses measured in the Burst time gate, the inelastic gamma-ray signals are dominant, and a small number of captured gamma-ray signals is observed. The Early and Late time gates mainly correspond to the captured gamma rays. Based on the analysis of the distributions of inelastic and captured gamma rays within the pulse period and preset time gates for measurement, the net inelastic gamma count rate can be calculated as follows:
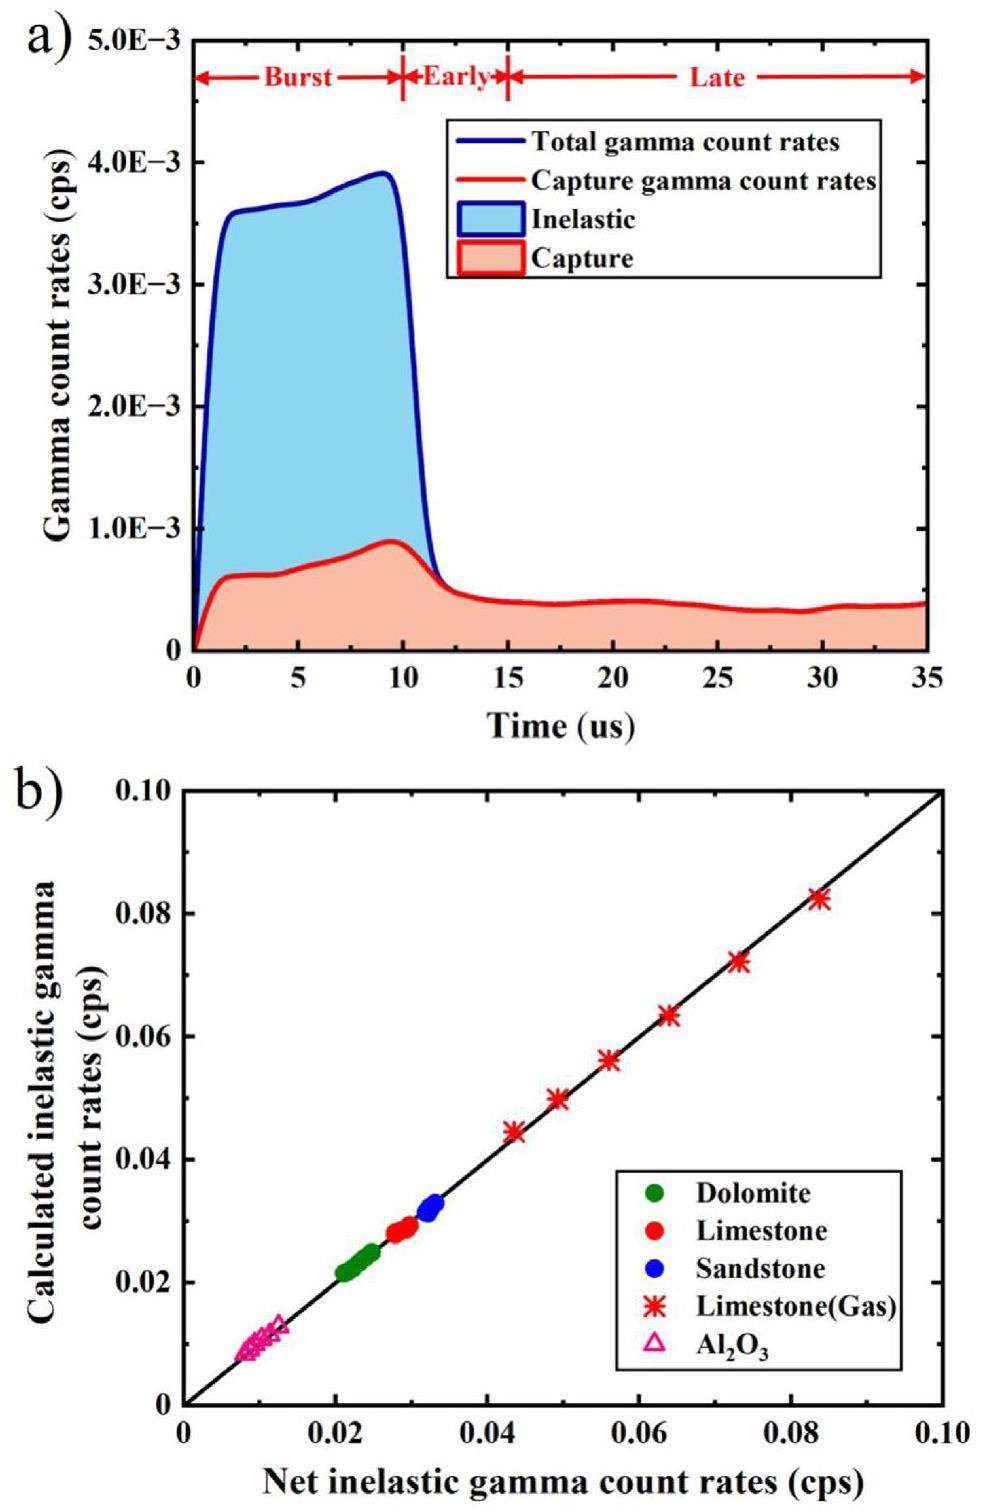
Figure 2(b) shows the extraction results of the net inelastic gamma count rates for different formations, according to Eq. (6). As shown in Fig. 2(b), the data points for formations containing different lithologies and pore fluids generally fall near the diagonal line. The calculated results are consistent with the theoretical values of the net inelastic gamma count rate obtained by setting the neutron-energy cutoff, which verifies the effectiveness of the proposed extraction method.
Neutron-transport correction
In NGD logging, secondary gamma-ray sources are produced by the inelastic scattering of fast neutrons, and their spatial distribution and strength depend on the transport process of the fast neutrons in the formation. Under different formation conditions, changes in the spatial distribution of fast neutrons lead to differences in the spatial distribution of the secondary gamma-ray sources. The measured inelastic gamma response includes the contribution of gamma-ray attenuation and is closely related to the neutron-transport process. The density-response functions derived in the previous section (Eq. (5)) includes the fast-neutron scattering cross section of the formation, which results in poor correspondence between the measured inelastic gamma response and formation density. Thus, quantitatively determining the formation density is difficult. Therefore, methods for dynamically monitoring the spatial distribution of fast neutrons and correcting for neutron-transport effects must be studied to eliminate the impact of neutron transport on NGD measurements.
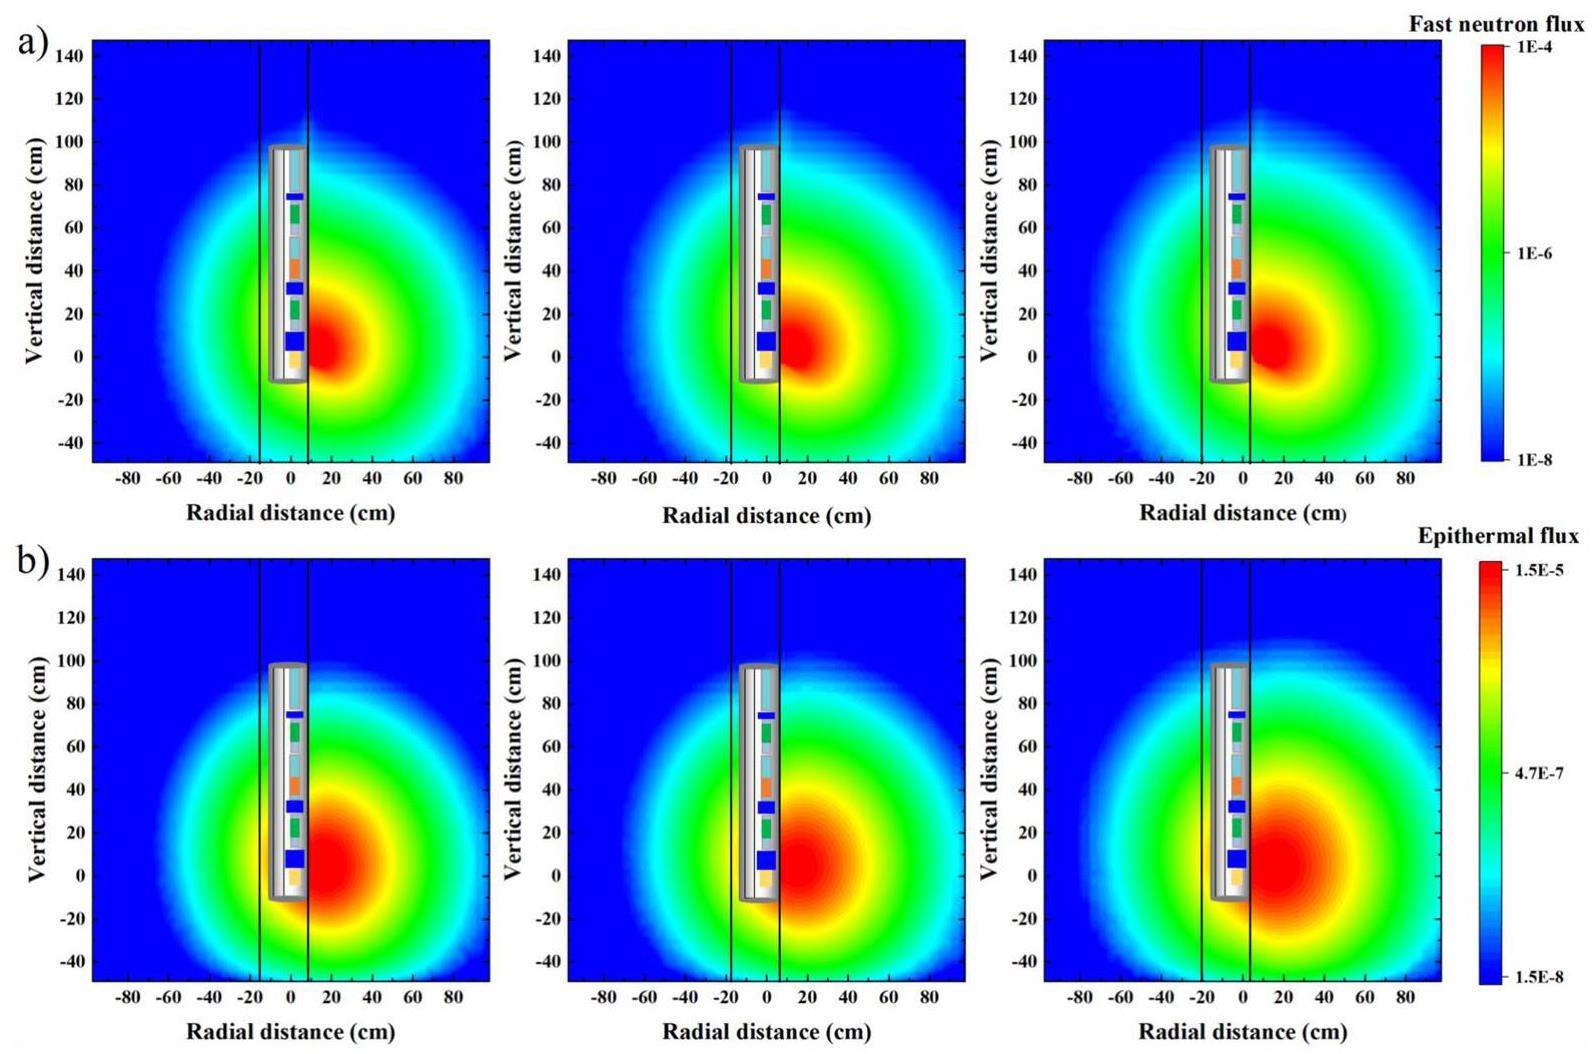
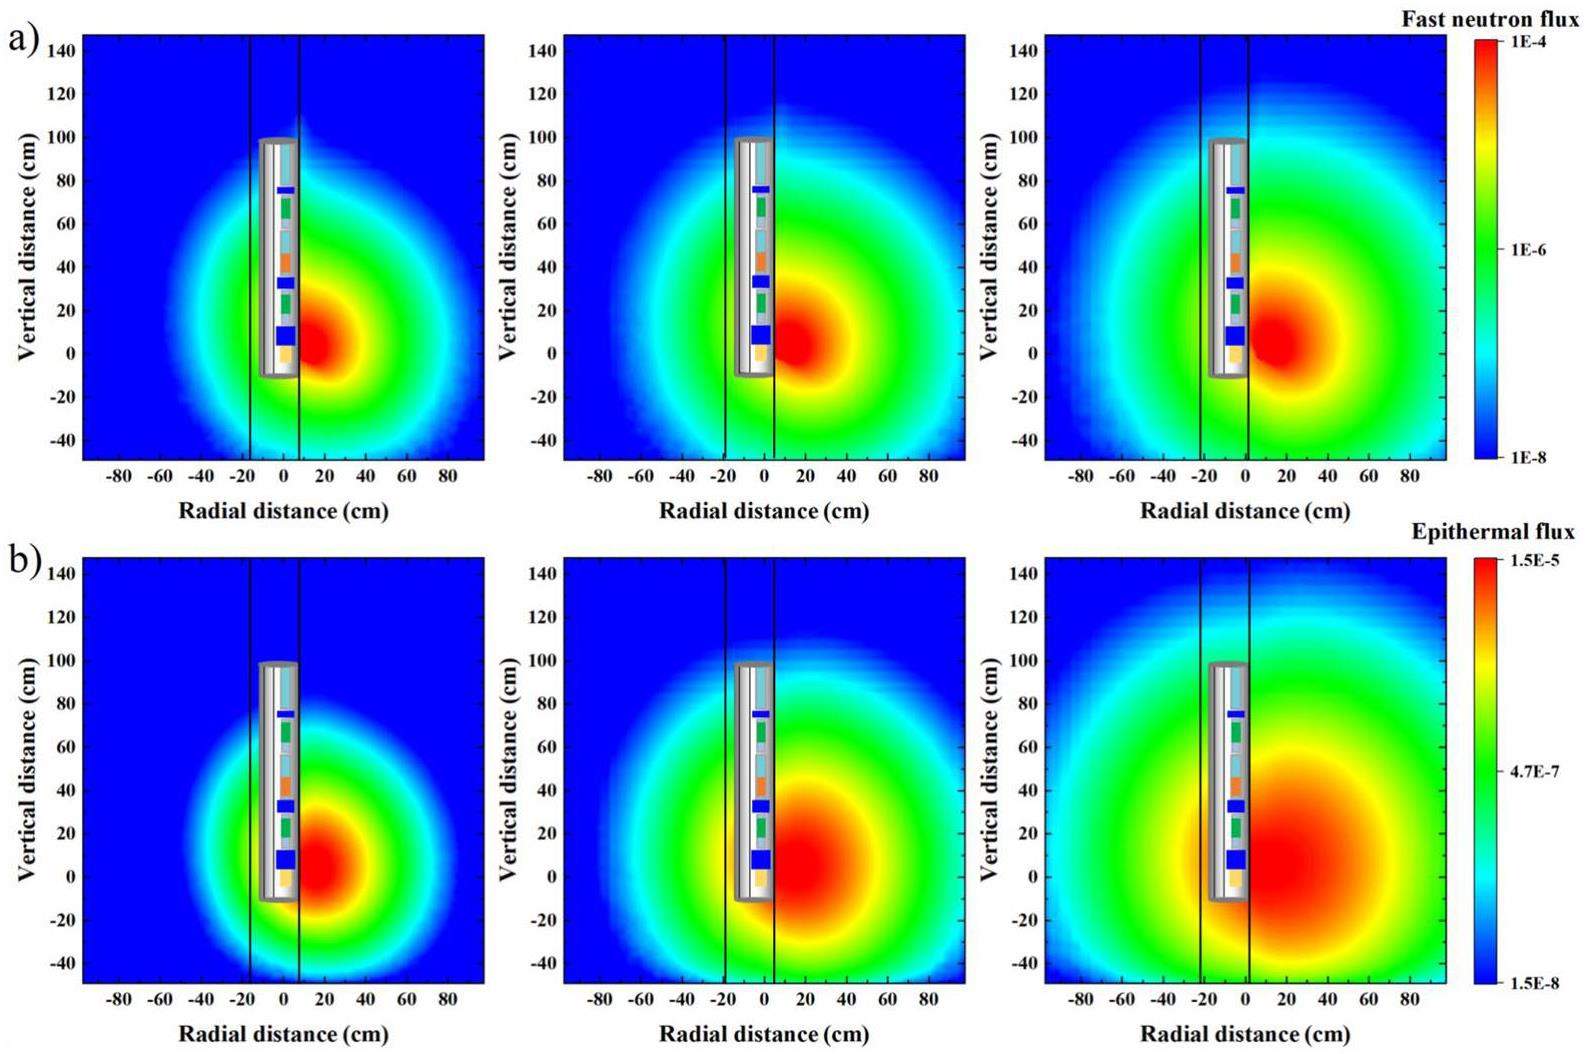
The fast- and epithermal-neutron flux distributions of three different lithological formations with the same density are compared to analyze the feasibility and application effects of using the epithermal-neutron count rate to quantitatively characterize the neutron-transport process. The results are presented in Fig. 3 (from left to right: 30 p.u. water-bearing dolomite formation, 23.5 p.u. water-bearing limestone formation, and 20.7 p.u. water-bearing sandstone formation). The different colors in the figure, from blue to red, indicate the relative intensity of the neutron flux. In Fig. 3, the neutron generator (source) is located at point (0, 0) and emits neutrons at an angle of 45° obliquely upward through the side of the logging tool pressed against the borehole wall. The neutron flux is large around the neutron source and decreases as the distance from the neutron source increases. The neutron flux in the formation zone near the side where the logging tool is pressed against the borehole wall is relatively large. Owing to their different elemental compositions and contents, the three formations have different neutron-scattering cross-sections and slowing capabilities, resulting in different neutron-flux distributions. The spatial distribution of fast neutrons has the largest range in the sandstone formation, the second largest range in the limestone formation, and the smallest range in the dolomite formation. A comparison of the fast- and epithermal-neutron flux distributions shows that the changes in the spatial distribution of epithermal neutrons between these three formations are consistent with those in the spatial distribution of fast neutrons. The relative strength of epithermal neutrons corresponds well with that of fast neutrons. Therefore, the epithermal-neutron count rate can be used to monitor changes in the fast-neutron spatial distribution to a certain extent.
In this study, an epithermal-neutron detector is used to monitor the spatial distribution of fast neutrons. Therefore, selecting an appropriate epithermal-neutron detector for tool development is relatively easy. However, epithermal-neutron detectors can also provide other additional measurement parameters for the tool such as epithermal-neutron porosity and the neutron-slowing time. Using the epithermal-neutron count rate to approximately characterize the fast-neutron scattering cross section, the theoretical density calculation relationship, including neutron-transport correction, can be obtained as follows:
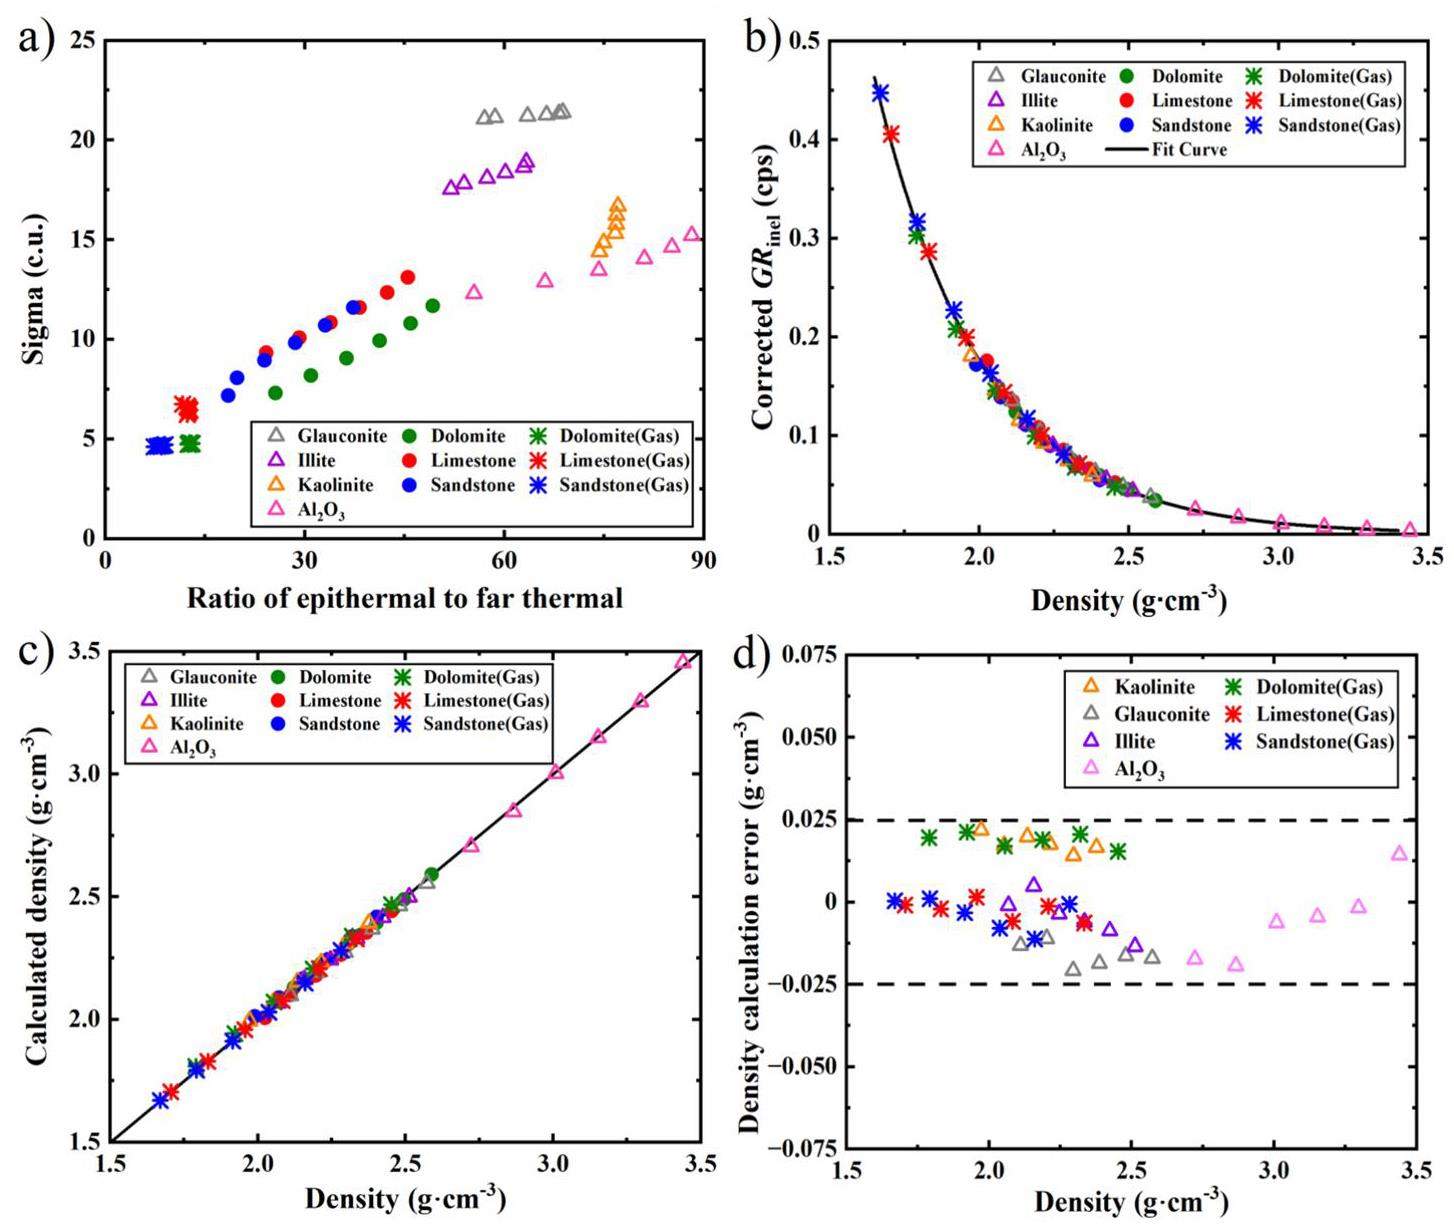
To enhance the contribution of gamma-ray attenuation, the extracted data of the net inelastic gamma count rate measured by the far gamma-ray detector are used in combination with the epithermal neutron count rate to calculate the formation density based on Eq. (7). The corrected results are shown in Fig. 4. Because the errors in the results for gas-filled and heavy-mineral formations are excessively large, only the errors of the conventional formation-processing results are quantitatively analyzed. As shown in Fig. 4, the relationship between the corrected inelastic gamma count rate and formation density in water-bearing conventional lithology formations after neutron-transport correction is similar to that of GGD logging [13, 27], and it approximately follows the exponential decay law. The density values calculated based on the fitted exponential curve are highly consistent with the true formation density. The density errors of conventional water-bearing formations are generally within ± 0.02 g/cm3, which meets the accuracy requirements of NGD logging [21, 22]. However, relatively large errors remain in the calculated density results for gas-filled and heavy-mineral formations. Figure 4(a) shows that the data points for gas-filled formations fall below the fitting curve. The corrected inelastic gamma count rate of these formations is low, resulting in a high calculation density. In contrast to the gas-filled formations, the data points for the heavy-mineral formations fall above the fitting line. Owing to the high inelastic gamma count rate after the neutron-transport correction, the density-calculation results are slightly low.
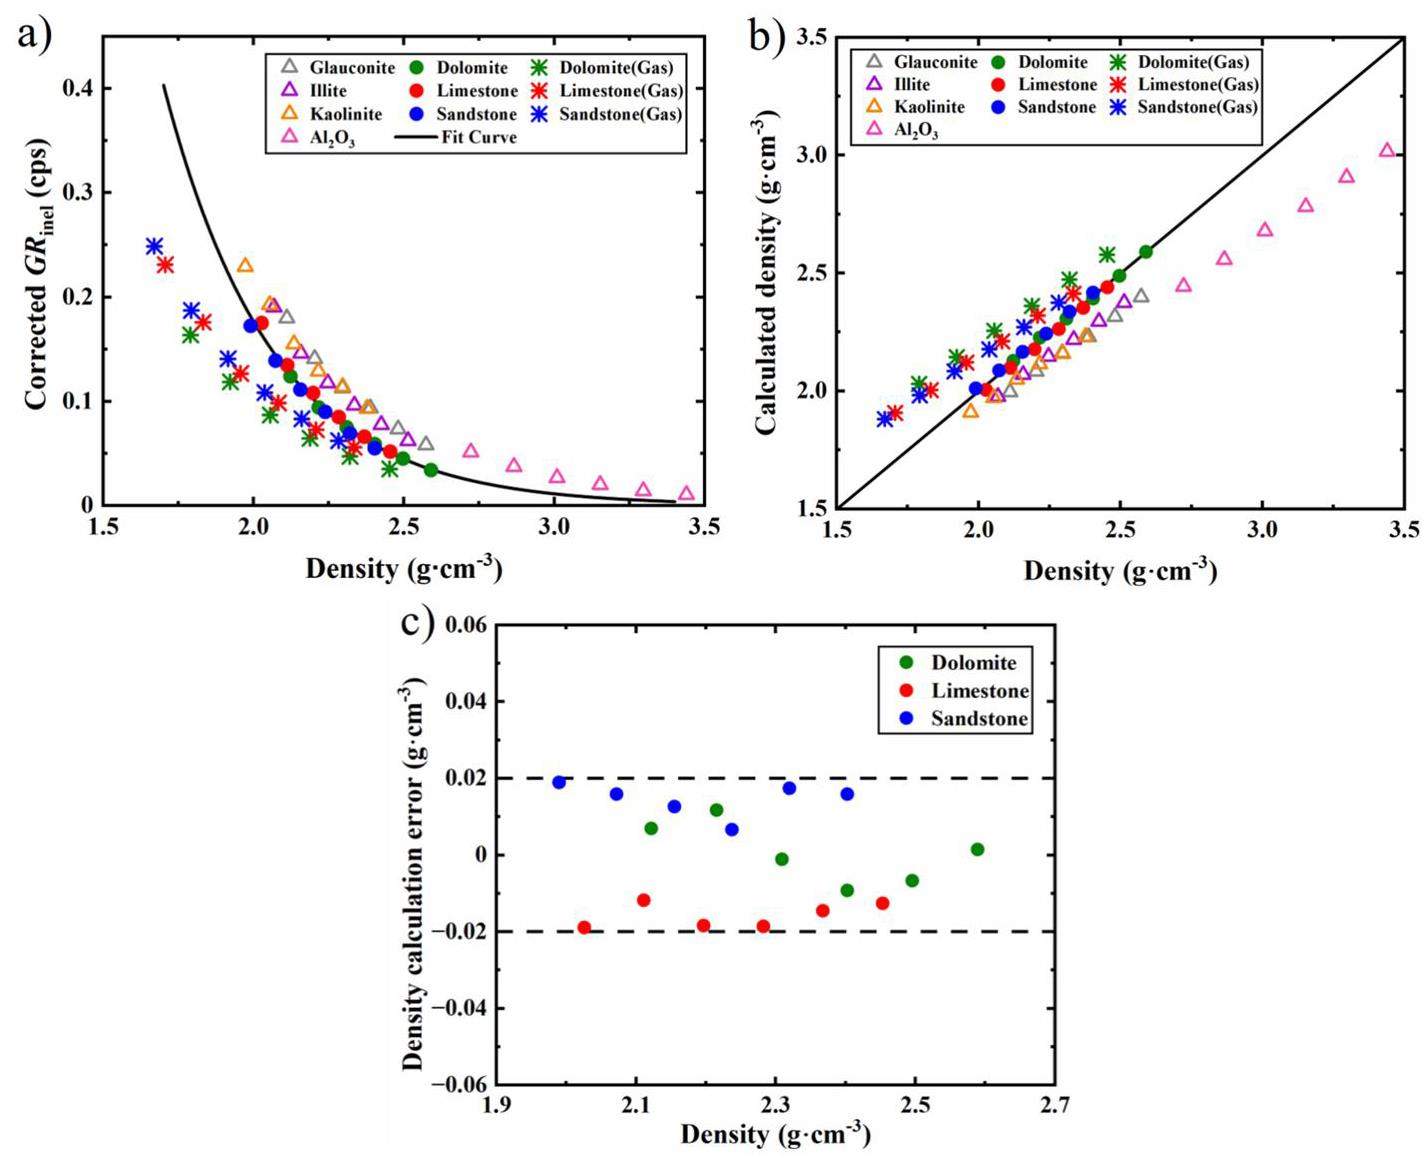
In summary, after the neutron-transport correction proposed in this study, the calculated density values of conventional water-bearing formations meet the accuracy requirements, and the errors therein are within ± 0.02 g/cm3. However, large errors in the calculated density values of gas-filled and heavy-mineral formations still exist. Therefore, the reason for the low-density calculation accuracy must be further analyzed and the related correction methods must be studied to improve the accuracy of the calculated results for these formations.
Fast-neutron effect additional correction
Fast- and epithermal-neutron flux distributions in three formations (water-bearing alumina, water-bearing sandstone, and gas-bearing sandstone) with the same densities are obtained through Monte Carlo simulations. Alumina formation is used to represent heavy-mineral formations in the analysis. The results of the comparison are shown in Fig. 5. In Fig. 5, compared with the water-bearing sandstone formation, the spatial-distribution range of fast neutrons in the alumina formation is clearly smaller, whereas that in the gas-bearing sandstone formation is significantly larger. The epithermal-neutron count rate can accurately characterize the spatial distribution of fast neutrons in water-bearing sandstone formations. However, for gas-filled and heavy-mineral formations, the epithermal-neutron count rate corresponds poorly to the spatial distribution of fast neutrons. Therefore, accurately correcting for the effect of neutron transport in gas-filled and heavy-mineral formations based solely on the epithermal-neutron count rate is difficult. Inaccurate neutron-transport correction leads to large errors in these formations in the density calculations of NGD logging.
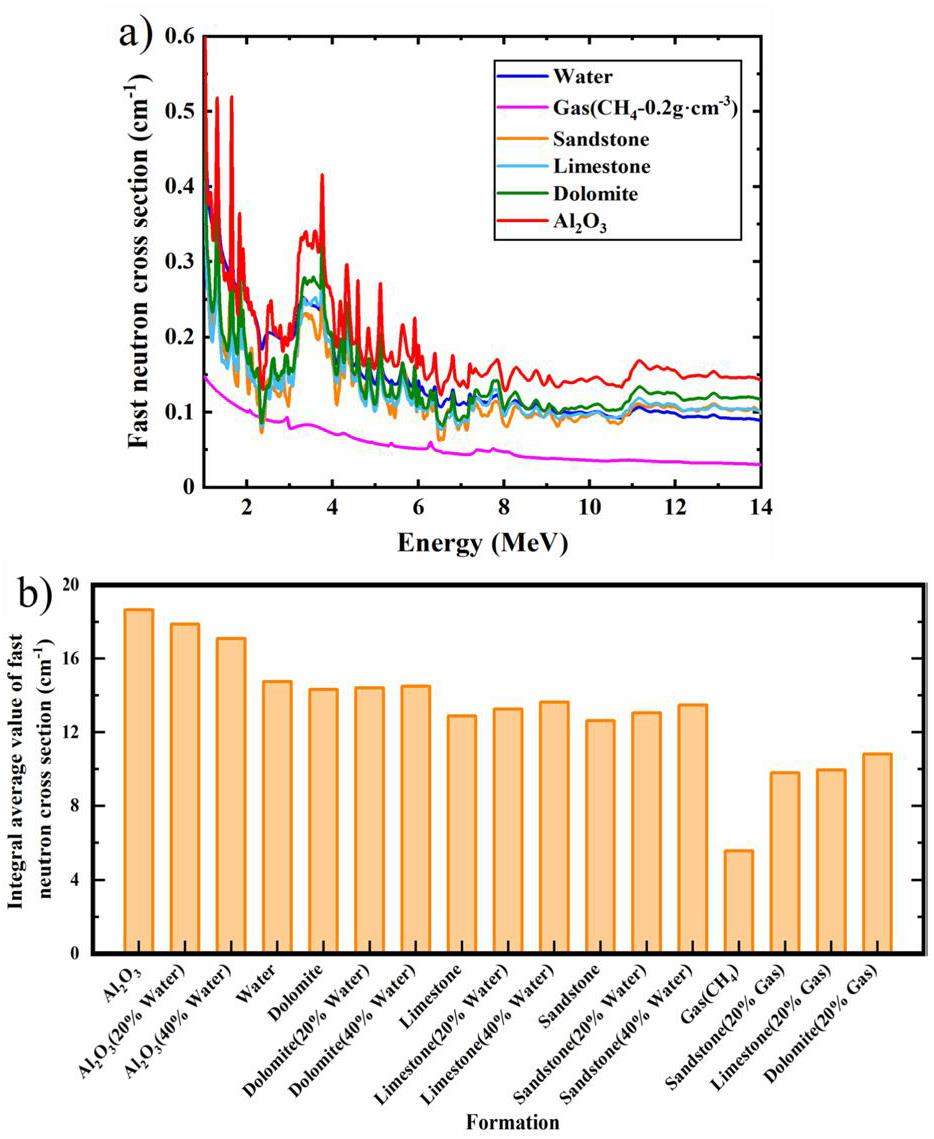
To further analyze why the effect of neutron transport in gas-filled and heavy-mineral formations cannot be accurately corrected, fast-neutron scattering cross sections of different minerals and pore fluids are determined from the ENDF/B-VII.0 nuclear data library [36]. The integral average values of the fast-neutron scattering cross-sections in different formations are calculated to quantitatively reflect the influence of the fast-neutron interaction process. The results are presented in Fig. 6. In Fig. 6(a), the fast-neutron scattering cross sections of sandstone, limestone, dolomite, and water are similar. However, the fast-neutron scattering cross sections of alumina and methane are relatively large and small, respectively. The calculated macroscopic fast-neutron cross sections of various formations are shown in Fig. 6(b). The fast-neutron cross sections of gas-filled and heavy-mineral formations differ greatly from those of conventional water-bearing formations, which results in the influence of the fast-neutron effect on the density measurement [22, 23]. For alumina formations with a large fast-neutron scattering cross section, the distribution range of fast neutrons is significantly reduced owing to strong neutron-scattering effects. The correction of the neutron-transport effect based on the epithermal-neutron count rate is inadequate. Owing to the residual effect of neutron transport on heavy-mineral formation after correction, the corrected inelastic gamma count rate is relatively large, and the calculated density is relatively small. In contrast, the fast-neutron scattering cross sections of gas-filled formations are small. Owing to the over-correction for the neutron-transport effect, the corrected inelastic gamma count rate is relatively small, whereas the calculated density is relatively high.
A new method for the additional correction of the fast-neutron effect is proposed in this study to solve the problem of inaccurate neutron-transport correction and large density errors caused by the fast-neutron effect in gas-filled and heavy-mineral formations. This method includes the identification of fast-neutron effects and subsequent additional corrections, as shown in Fig. 7. Combined with the formation sigma (thermal neutron macroscopic capture cross section, which can be obtained through the gamma time spectrum of the gamma-ray detector, reflecting the ability of formations to capture thermal neutrons) and relevant measurement information of the neutron detector, the gas-filled and heavy-mineral formations are divided. As shown in Fig. 7(a), the values of sigma and the count-rate ratio of the epithermal-neutron detector to the far thermal neutron detector measured in the heavy-mineral formations are relatively large. The corresponding data points are shown in the upper right section of the figure. The sigma and count-rate ratio of epithermal neutrons to far thermal neutrons of the gas-filled formations are both relatively small and distributed in the lower-left section of the figure. The data points for the water-bearing formations of conventional lithology are located in the middle of the above two formations and have a clear boundary distinction. Therefore, the fast-neutron effect can be identified by combining the measured sigma and ratio of the epithermal-neutron count rate to the far thermal neutron count rate. The gas-filled and heavy-mineral formations that require additional correction of the fast-neutron effect are separated from the measured data points based on the two types of measurement information.
By introducing an additional term into Eq. (7) to compensate for the fast-neutron effects, the density-processing algorithm for gas-filled and heavy-mineral formations can be established as follows:
According to Eq. (8), the data involving fast-neutron effects are processed with additional fast-neutron-effect corrections. The results are presented in Fig. 7. Fig. 7(d) shows only the density-calculation errors for the gas-filled and heavy-mineral formations. The calculation errors of the conventional formations are shown in Fig. 4 and satisfy the accuracy requirements; therefore, they are not presented here.
Unlike the large deviations in the gas-filled and heavy-mineral formations shown in Fig. 4, the data points in Fig. 7 return to the fitting curve after additional corrections for the fast-neutron effect. The density response relationship of the two formations is in good agreement with that of the water-bearing formations of conventional lithology. The calculated density results of these two formations correspond well to the theoretical density values, and the errors are within ± 0.025 g/cm3. These results show that the proposed method for additional fast-neutron-effect corrections in gas-filled and heavy-mineral formations can significantly reduce the impact of fast-neutron effects on data processing and improve the accuracy of the calculated density results.
Processing of measured data
To verify the effectiveness of the proposed data-processing methods on actual well logging data, the original measured data from the NeoScope tool used in a well are processed based on the data-processing flow shown in Fig. 8. The parameters of the data-processing algorithms are calibrated according to the measured data, and the net inelastic gamma count rate is extracted from the original data measured in the three time gates (Burst, Early, and Late). After neutron-transport correction and additional fast-neutron-effect correction, the final processing results of the algorithms are obtained and compared with the density results from the NeoScope tool. Detailed results are shown in Fig. 9.
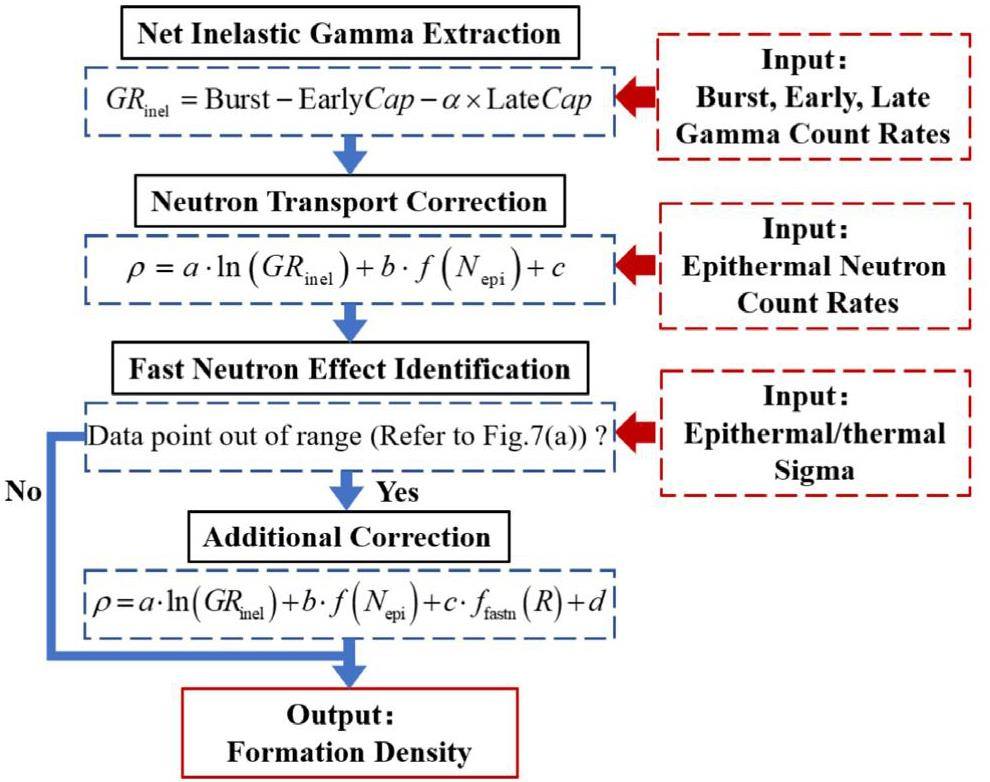
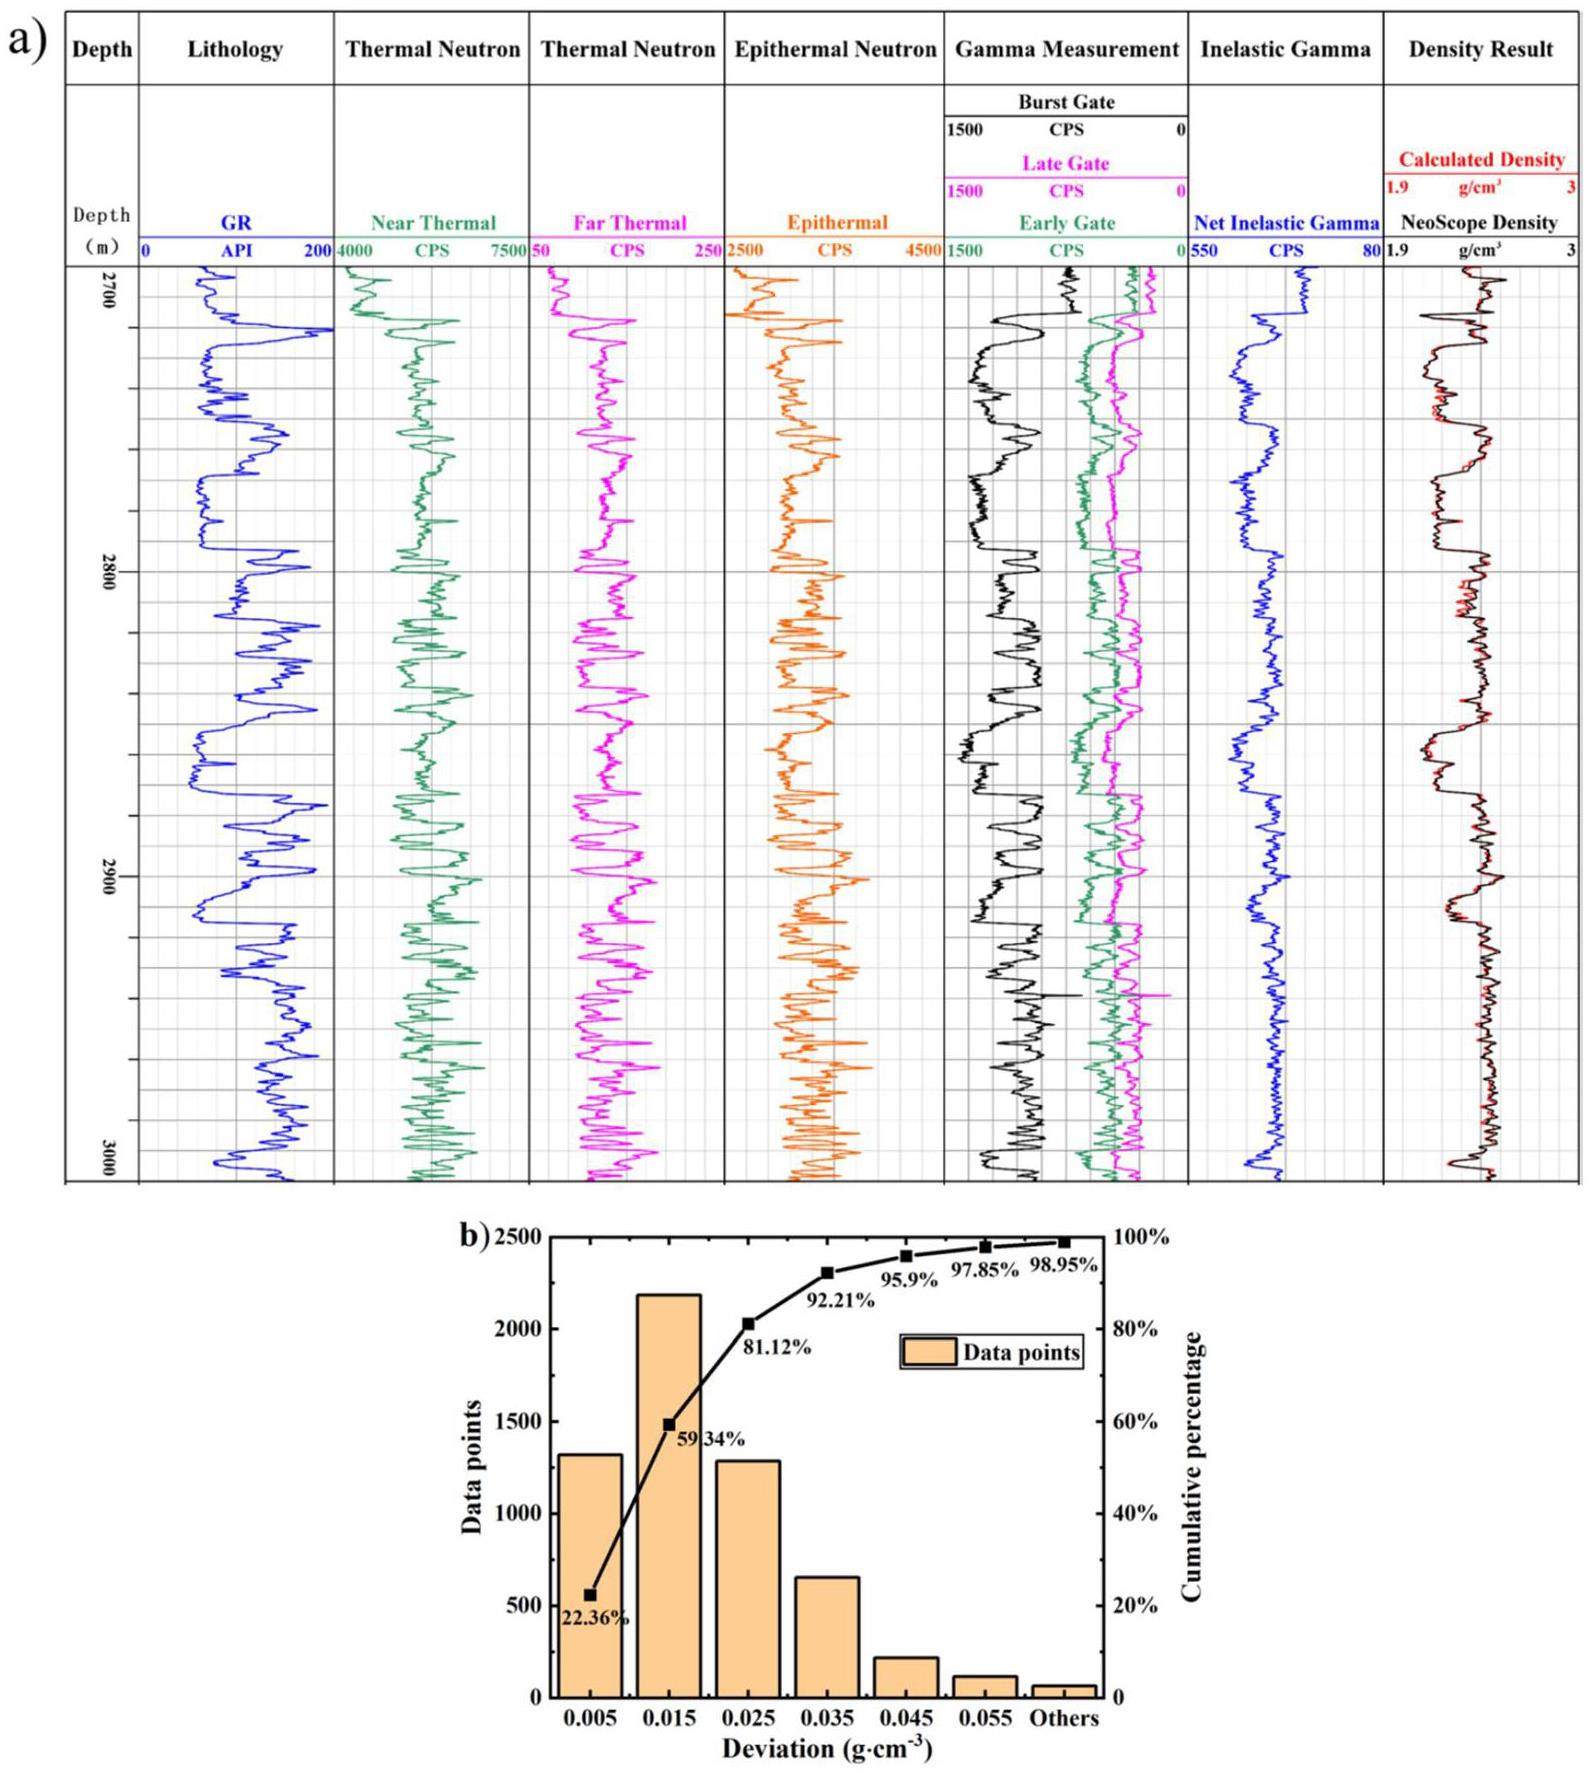
Figure 9(a) comprises eight tracks for the output results. Track 1 indicates the logging depths. Track 2 is a track for lithology, where high-GR values represent mudstone formations, and low-GR values represent sandstone formations. Tracks 3, 4, and 5 show the neutron count rates of the near thermal neutron detector, far thermal neutron detector, and epithermal-neutron detector, respectively. The three curves in Track 6 correspond to the gamma-ray count rates measured in the Burst, Early, and Late time gates. Track 7 shows the net inelastic gamma count rate extracted from the gamma-ray count rates measured at the three time gates. Track 8 compares the calculated density of the algorithms and density data from the NeoScope tool. In Track 8, the red curve represents the processed results of controllable neutron-source density logging, and the black curve represents the density results of the NeoScope tool. The coincidence of these two curves verifies the effectiveness of the data-processing methods.
A statistical analysis is conducted on the processing results of the measured data, as shown in Fig. 9(b). From the quantitative distribution of statistical deviations of the processed results, the deviation of most data points is within the range of ±0.025 g/cm3. Owing to the presence of mudstone formations in the well interval, the deviations of some data points are greater than ±0.025 g/cm3. In addition, the cumulative percentage data show that 81.12% of the data points have deviations within the range of ± 0.025 g/cm3, and 92.21% of the data points have deviations within the range of 0.035 g/cm3. Therefore, the NGD-logging data-processing methods proposed in this study can be perfectly applied to actual measured data, and the processing results satisfy the accuracy requirements.
Conclusion
(1) In this study, data-processing methods for net inelastic gamma-ray count-rate extraction and neutron-transport correction are studied by combining numerical simulations and measured data. Owing to the presence of fast-neutron effects in gas-filled and heavy-mineral formations, accurately correcting for the influence of the fast-neutron transport process and its spatial distribution based solely on the epithermal-neutron count rate is difficult. To solve this problem, a new method for the additional correction of fast-neutron effects is proposed. The proposed method effectively improves the accuracy of density measurements in complex gas-filled and heavy-mineral formations.
(2) For the simulated data, the density-calculation accuracy of water-bearing conventional formations is ± 0.02 g/cm3. The accuracy of gas-filled and heavy-mineral formations after the additional fast-neutron-effect correction is ± 0.025 g/cm3. For the measured data of the actual tool, the density-processing results of the algorithms are consistent with the density data from the NeoScope tool. The trends and values of these two density results in the entire well interval correspond well, verifying the effectiveness of the data-processing methods proposed in this study.
(3) The data-processing algorithms proposed in this study cover the entire process from the initial downhole measurement to the output of the final density results. The function, method, and effect of each step in the data processing are systematically studied and sorted. These algorithms can provide accurate density-calculation results that meet the accuracy requirements for both the simulation and measured data under various formation conditions. This study is of great significance for the extensive application and development of tools for controlled-source neutron-gamma density logging.
An assessment of fundamentals of nuclear-based alternatives to conventional chemical source bulk-density measurement
. Petrophysics 55, 415-434 (2014).A new cased-hole porosity measurement for a four-detector pulsed-neutron logging tool
, in SPE Annual Technical Conference and Exhibition, (Numerical simulation and method study of X-ray litho-density logging
. Nucl. Sci. Tech. 31, 124 (2020). https://doi.org/10.1007/s41365-020-00826-2Corrections of fast neutron inelastic scattering effects on d-t neutron porosity logging
. Appl. Radiat. Isotopes 190,On density measurement using various radiation sources: Cs-137, X-ray and pulsed neutron
. Appl. Radiat. Isotopes 205,Nuclear source replacement promises and pitfalls
, in SPWLA 52nd Annual Logging Symposium, (Sourceless neutron-gamma density (SNGD): principles, field-test results and log quality control of a radioisotope-free bulk-density measurement
. Petrophysics C 54(02), 91-103 (2013).A novel gamma-thermal neutron evaluating gas saturation method using pulsed neutron logging tool with dual-CLYC
, in SPWLA 63rd Annual Logging Symposium.Improved formation density measurement using controllable DD neutron source and its lithological correction for porosity prediction
. Nucl. Sci. Tech. 33, 3 (2022). https://doi.org/10.1007/s41365-022-00988-1Source-less density measurement using an adaptive neutron-induced gamma correction method
. Nucl. Sci. Tech. 34(8), 125 (2023). https://doi.org/10.1007/s41365-023-01274-4Bulk density logging with high-energy gammas produced by fast neutron reactions with formation oxygen atoms
, in 1995 IEEE Nuclear Science Symposium and Medical Imaging Conference Record, (Cased-hole lithology and density measurements, part i: Applications in permian basin reservoir analyses
, in SPWLA 39th Annual Logging Symposium, (Progress and future of pulsed neutron technology in oil field management
, in SPE Annual Technical Conference and Exhibition, (A comparative study on the neutron-gamma density and gamma-gamma density logging
. J.Petrol. Sci. Eng. 176, 792-799 (2019). https://doi.org/10.1016/j.petrol.2019.02.007A LWD gas-reservoir recognition method based on the inelastic gamma information of the drill collar
. Geoenergy Sci. Eng. 225,Application analysis on the different neutron gamma density (NGD) logging methods
. Appl. Radiat. Isotopes 172,An innovative slim pulsed neutron logging tool
, in SPWLA 56th Annual Logging Symposium, (Pulsed neutron density measurements: Modeling the depth of investigation and cased-hole wellbore uncertainties
, in SPWLA 40th Annual Logging Symposium, (Improvements in a through-casing pulsed-neutron density log
, in SPE Annual Technical Conference and Exhibition, (An improved formation density measurement using pnc tools
, in SPWLA 56th Annual Logging Symposium, (A new integrated lwd platform brings next-generation formation evaluation services
, in SPWLA 46th Annual Logging Symposium, (Sourceless neutron-gamma density sngd: A radioisotope-free bulk density measurement: Physics principles, environmental effects, and applications
, in SPE Annual Technical Conference and Exhibition, (Neutron-gamma density (NGD): principles, field test results and log quality control of a radioisotope-free bulk density measurement
, in SPWLA 53th Annual Logging Symposium, (Accuracy and borehole influences in pulsed neutron gamma density logging while drilling
. Appl. Radiat. Isotopes 69(9), 1313-1317 (2011). https://doi.org/10.1016/j.apradiso.2011.04.023A method to describe inelastic gamma field distribution in neutron gamma density logging
. Appl. Radiat. Isotopes 129, 189-195 (2017). https://doi.org/10.1016/j.apradiso.2017.08.024A method of determining formation density based on fast-neutron gamma coupled field theory
. Petrophysics 58(4), 411-425 (2017).Pulsed neutron generator-driven sourceless density measurements–expectations, physics and issues
, in SPWLA 55th Annual Logging Symposium, (Effect of pair production on d-t induced gamma density measurement
. Nucl. Sci. Tech. 38(8), 58-63 (2015).Neutron transport correction and density calculation in the neutron-gamma density logging
. Appl. Radiat. Isotopes 150, 110-119 (2019). https://doi.org/10.1016/j.apradiso.2019.05.023A new method for calculating bulk density in pulsed neutron-gamma density logging
. Geophysics 85(6), D219-D232 (2020). https://doi.org/10.1190/Geo2018-0821.1Environmental corrections and system calibration for a new pulsed-neutron mineralogy instrument
, in SPWLA 50th Annual Logging Symposium, (Multifunctional neutronics calculation methodology and program for nuclear design and radiation safety evaluation
. Fusion. Sci. Technol. 74(4), 321-329 (2018). https://doi.org/10.1080/15361055.2018.1475162A diffusion-corrected sigma algorithm for a four-detector pulsed-neutron logging tool
, in SPE Annual Technical Conference and Exhibition, (A method for neutron-induced gamma spectra decomposition analysis based on Geant4 simulation
. Nucl. Sci. Tech. 33(12), 154 (2022). https://doi.org/10.1007/s41365-022-01144-5Endf/b-vii. 0: Next generation evaluated nuclear data library for nuclear science and technology
. Nucl. Data. Sheets. 107(12), 2931-3060 (2006).The authors declare that they have no competing interests

