Introduction
A floating nuclear power plant (FNPP) is a marine-based nuclear power facility that provides energy and freshwater to isolated regions without a centralized power grid. These systems offer substantial benefits in terms of safety, usability, and functionality [1-3]. Unlike land-based nuclear power plants, FNPPs can efficiently prevent earthquake damage and have adequate coolant to dissipate excess heat from the reactor. Additionally, by connecting the reactor to a floating platform, FNPPs offer the advantage of adaptable site selection with fewer restrictions. These plants can explore independently under difficult conditions or can be pulled into safe waters to avoid potential dangers. FNPPs have become a prominent research topic in recent years [4, 5]. Various FNPP reactors are being designed in different nations, such as ACP100s and ACPR50s in China, OFNP-300/OFNP1100 in the USA, Flexblue in France, and KLT-40s, RITM-200, VBER-300, ABV-6E, and SHELF in Russia (WNA, 2020).
FNPPs typically use barge-type platforms for autonomous mobility and deployment to accommodate various marine conditions and operational requirements. Russia's “Akademik Lomonosov” floating nuclear power station has been effectively deployed and operated [6]. China is currently developing FNPPs by placing ACP100 reactors on barge-type platforms. Barge platforms [7] have a significantly reduced stability compared to column-stabilized platforms, tension leg platforms, and other center-based platforms because of their non-isotropic rotational inertia, which affects their performance in winds, waves, and currents. When exposed to crosswinds and waves, yaw and sway can lead to dangerous lateral movements, ranging from slight structural deformations to putting the reactor's safety at risk [8]. Various loads such as tilting, rocking, swaying, and impact can affect the performance of steam delivery systems in reactors. During natural circulation, these effects may also be affected by the pressure caused by variations in elevation and fluctuations [9]. Jie [10] and Yan [11] performed advantageous evaluations by using systematic analytical programs for distinct reactor types or specialized circuits under rolling, heaving, and swaying circumstances. The FNPP was unable to maintain stable operation under significant rolling and pitching movements. Strother [12] and Liu et al. [13] studied the dynamic response and mooring characteristics of multi-point-moored column-stabilized FNPPs. Few studies have examined the hydrodynamic response of barge-type FNPPs to waves. To evaluate and reduce the risks posed by wind and waves, it is crucial to study the factors affecting barge-type FNPPs and their dynamic reactions when exposed to wind, waves, and currents.
Considering the intricate marine settings, the hydrodynamic response of FNPPs must account for the collective impact of wind, waves, and current factors. Because of the large number of waves occurring over long periods of time and various environmental factors, performing hydrodynamic calculations for each wave event is difficult. Moreover, this method has limitations in accurately representing the impact of each significant environmental factor on the hydrodynamic reactions of an FNPP. Zou et al. [14] investigated an approximation response surface prediction model utilizing the Kriging model for a Tension Leg Platform semi-submersible Floating Offshore Wind Turbine (FOWT). This model forecasts the frequency-domain response of a platform using various characteristics. Therefore, we created a quick-response surrogate model for hydrodynamic computations to examine various historical wave events. This indicates that efficient surrogate models can quickly evaluate and analyze hydrodynamic responses under the influence of waves.
To ensure the safe application of FNPPs, it is essential to assess their risk levels under the influence of sea waves. However, owing to the complexity of the marine wave environment, with numerous and deeply coupled wind–wave–current parameters and the abundance of recorded wave events over the years, it is necessary to develop a method that can rapidly calculate the impact of wind, waves, and currents on FNPPs in batches. For this purpose, we constructed a hydrodynamic response model and reduced-order model based on a specific sea area and the “Akademik Lomonosov” FNPP. These results provide a methodological reference for FNPP risk analysis.
Methodology
Research framework
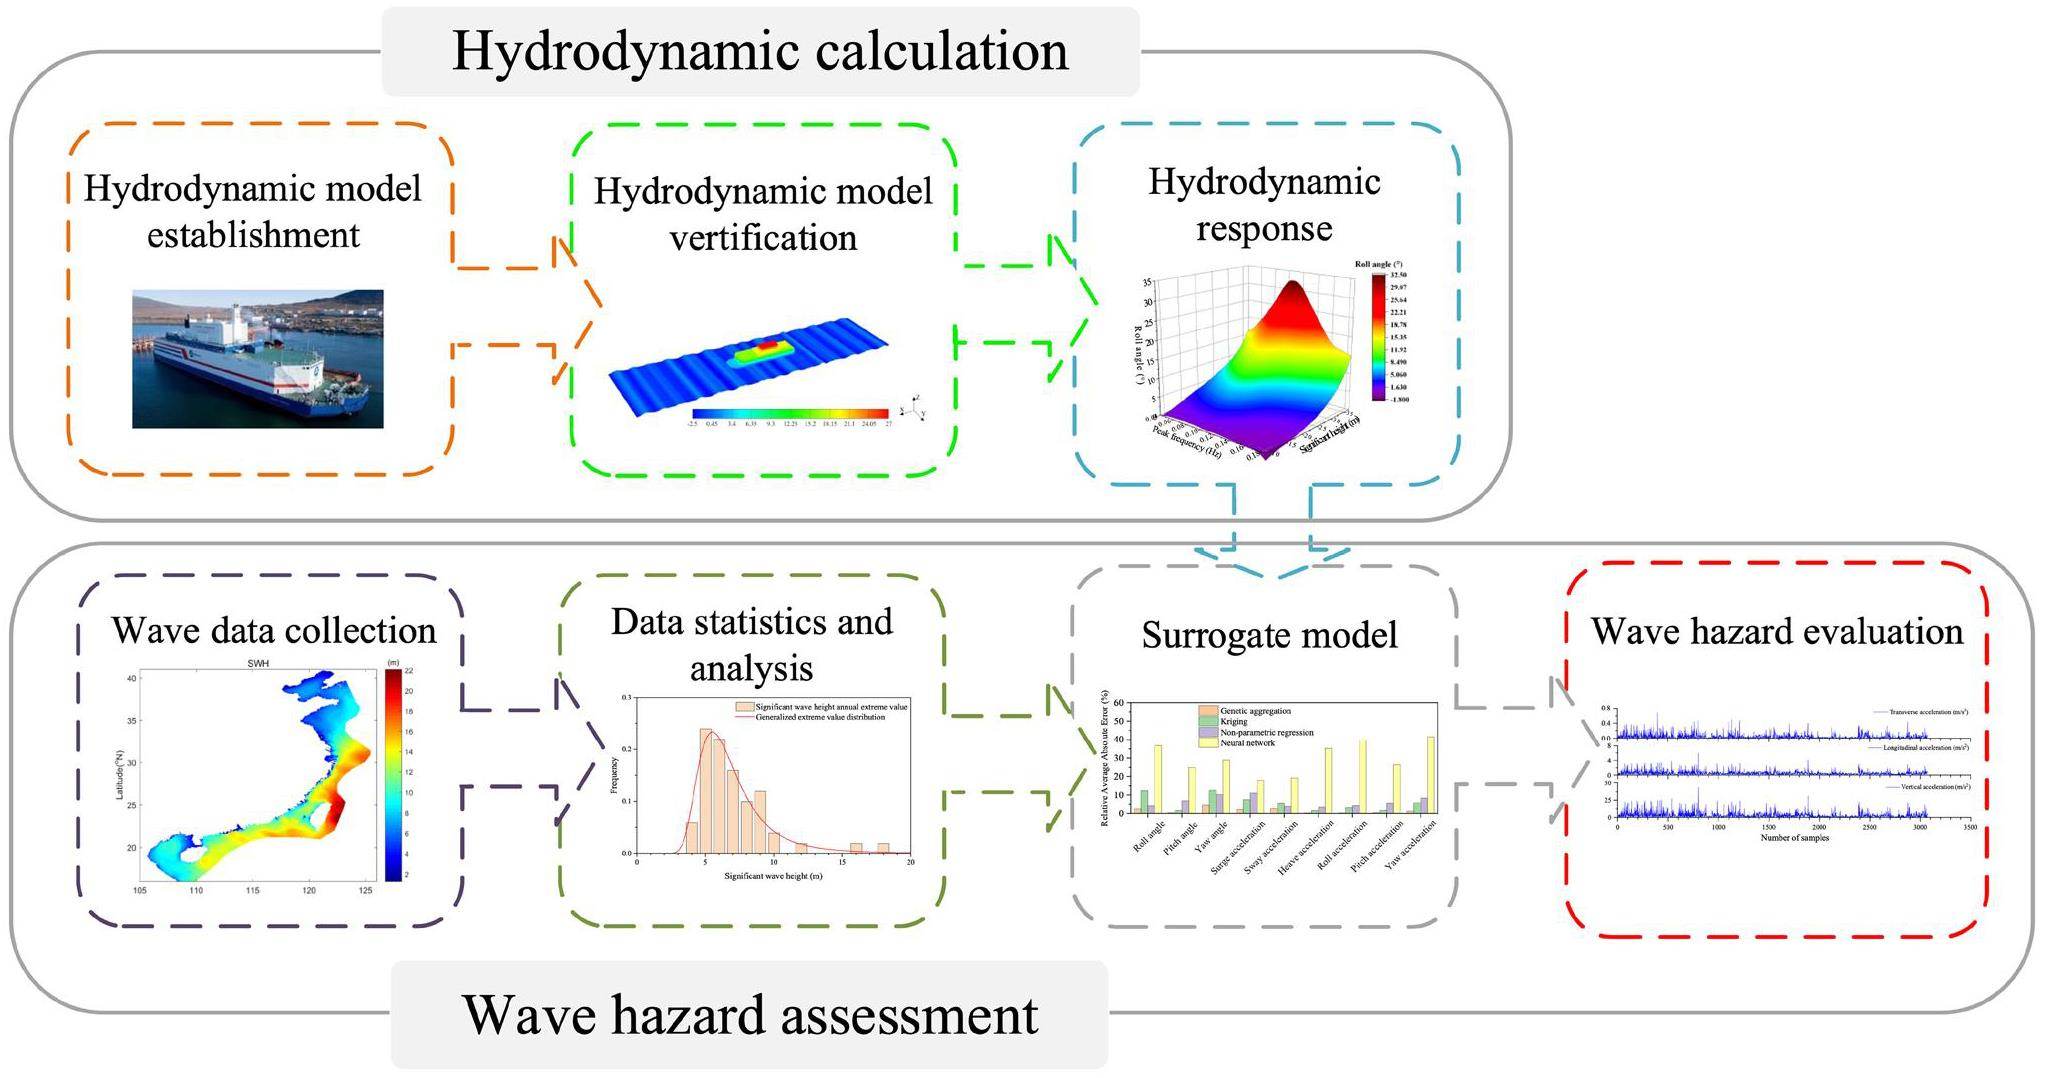
The results are presented in Fig. 1. We used the “Akademik Lomonosov” FNPP, the sole functioning nuclear-powered floating platform worldwide, as a benchmark for forecasting and assessing the immediate motion reaction of the FNPP. An ANSYS AQWA hydrodynamic model was constructed on a 1:1 scale. Computational fluid dynamics (CFD) and hydrodynamic analyses were performed to verify the reliability of the hydrodynamic model. The motion response of the FNPP to wave loading was analyzed, and the displacement–time curves obtained from both theoretical approaches were compared. Correlation and sensitivity studies were conducted on the environmental and response surface parameters with environmentally sensitive factors chosen as the input variables. A response surface prediction model was developed to predict the short-term platform frequency-domain responses using environmental data and dynamic responses as inputs. An efficient technique for assessing the possible threat of sea waves in maritime regions involved collecting historical wave observation data to determine the hydrodynamic reactions of FNPPs. These data were used to evaluate the dangerous qualities of ocean waves according to platform safety rules. Another method involved the use of historical wave observation data to establish the annual extreme-value distribution of major wave heights. The data were then transformed into a danger curve for the FNPP's hydrodynamic response. The level of danger in the maritime environment was assessed by comparing the return duration of the hazardous responses with the operational lifespan of the platform.
Numerical model
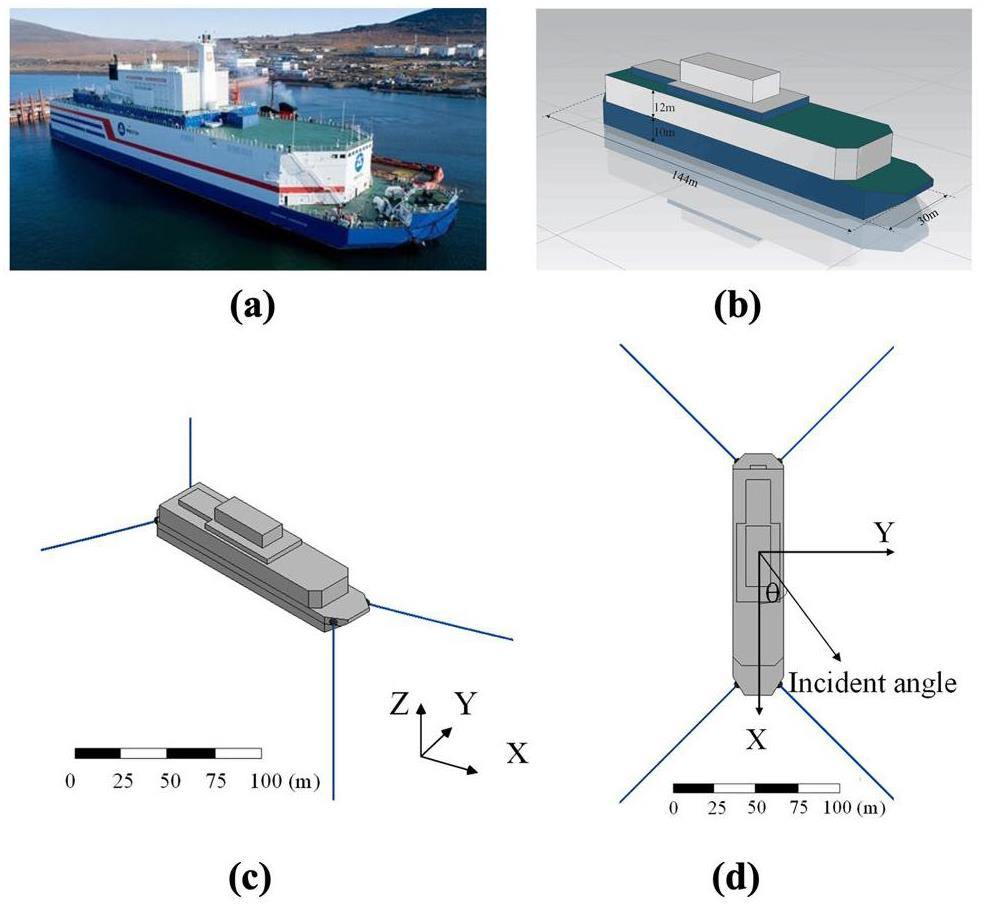
This study centered on the world's first barge-type FNPP, Akademik Lomonosov, as the principal research subject, as depicted in Figs. 2(a) and (b). The hydrodynamic model of the FNPP was constructed at a 1:1 scale according to the design of the "Akademik Lomonosov" FNPP. The specific parameters of the FNPP are listed in Table 1. The center of gravity (CoG) and radius of gyration positions were calculated using modeling software. The mooring connection points were positioned at the four corners of the platform and were firmly secured by four mooring lines that linked them to the seabed, as illustrated in Fig. 2(c). Detailed specifications of the mooring system are listed in Table 1. Figure 2(d) defines a fixed universal coordinate system. The origin of the system was at the free surface, with the Z-axis pointing vertically upward, the X-axis aligned with the bow of the ship, and the Y-axis established using the right-hand rule. The platform had six degrees of freedom (six-DOF): three for translation along the X-, Y-, and Z-axes (surge, sway, and heave, respectively) and three for rotation around the X-, Y-, and Z-axes (roll, pitch, and yaw, respectively).
| Structural parameters | Value |
|---|---|
| Length (m) | 144 |
| Beam (m) | 30 |
| Height (m) | 10 |
| Draft (m) | 5.6 |
| Displacement (tons) | 21500 |
| Position of the center of gravity (CoG) (m) | (0, 0, 2.2) |
| Gyration radius from the CoG, roll/pitch/yaw (m) | 11.18/36.24/36.43 |
The marine environment is intricate and constantly changing, with the FNPP experiencing the combined effects of winds, waves, current loads, and mooring restoring forces. Nonlinear coupling effects arise between various loads owing to differences in the moments of inertia, windward area, and current-facing area in different directions of the FNPP [15].
Wind load
The China Classification Society [16] Standards state that the wind pressure loads on platforms above sea level include both wind pressure and wind-induced tilting moments.
Wave load
Large-scale wave-induced loads on FNPP platforms mostly result from the inertial forces produced by waves. We utilized diffracted radiation theory by employing the potential flow boundary element technique, as outlined by Wei et al. [17]. According to potential flow theory, the fluid in a wave field is an ideal, incompressible, non-vortical fluid with a velocity potential. The velocity potential in a wave field with a floating rigid body
Current load
Similar to the approach used for calculating wind loads, the formulation for the forces acting on the submerged portion of the platform is as follows:
Design of the operating condition
In this study, the Narrow Spectrum Distribution (NSD) wind spectrum proposed by Mann [21] was adopted. The dimensional NPD wind energy spectrum (in m2/s) for longitudinal wind speed fluctuations at height Z is expressed as
We employed a uniform flow model to characterize the ocean current in which the angle of incidence and velocity of the current stay were consistent from the seabed to the water surface.
Response surface prediction model
Response surface surrogate models provide a means to visually represent the connections between input parameters and motion responses. In addition to the traditional complete second-order polynomial method, other methods for creating response surfaces include the Kriging model, non-parametric regression method, neural network method, and genetic aggregation algorithm.
In a typical full second-order polynomial model, each output parameter is represented as a quadratic function of the input parameters. Hence, function f is a quadratic polynomial.
The non-parametric regression model utilizes a support vector approach. This method employs a tight tolerance (ε) boundary around the output response surface, covering the majority or all the design sample points.
The genetic aggregation response surface (GARS) model, a response surface methodology, utilizes an iterative genetic algorithm to obtain solutions [23, 24]. GARS streamlines the selection of the most suitable response surface type for each output parameter by automatically determining and combining various available response surface types, including a full second-order polynomial, non-parametric regression, and Kriging model, to consolidate multiple response surfaces. The primary goal of this model is to satisfy three essential requirements to attain the highest possible response rates. The model must exhibit accuracy, dependability through cross-validation, and smoothness similar to a linear model.
Results and discussion
Numerical verification
We conducted simulation evaluations of the FNPP's motion response using CFD and potential flow methodologies to evaluate the dependability of the hydrodynamic model. We compared the motion time series generated using the two approaches. The geometric model of the FNPP in the CFD simulations conformed to the structure shown in Fig. 2(b). We utilized overset grid approaches to prevent negative volumes when reconstructing grids for large objects. Figure 3(a) illustrates that using overlapping grid approaches required division into two grid sets: one for the foreground and the other for the background. The foreground grid, consisting of 2.05 million components, encompassed the near-field area of the FNPP and was divided into unstructured grids. The backdrop grid, consisting of 1.30 million components, covered the entire computational area and was segmented into organized grids. Boundaries were established for the inlet and outflow according to the wave direction. The seabed was set as a wall boundary, and the other surfaces were designated as symmetric boundaries.
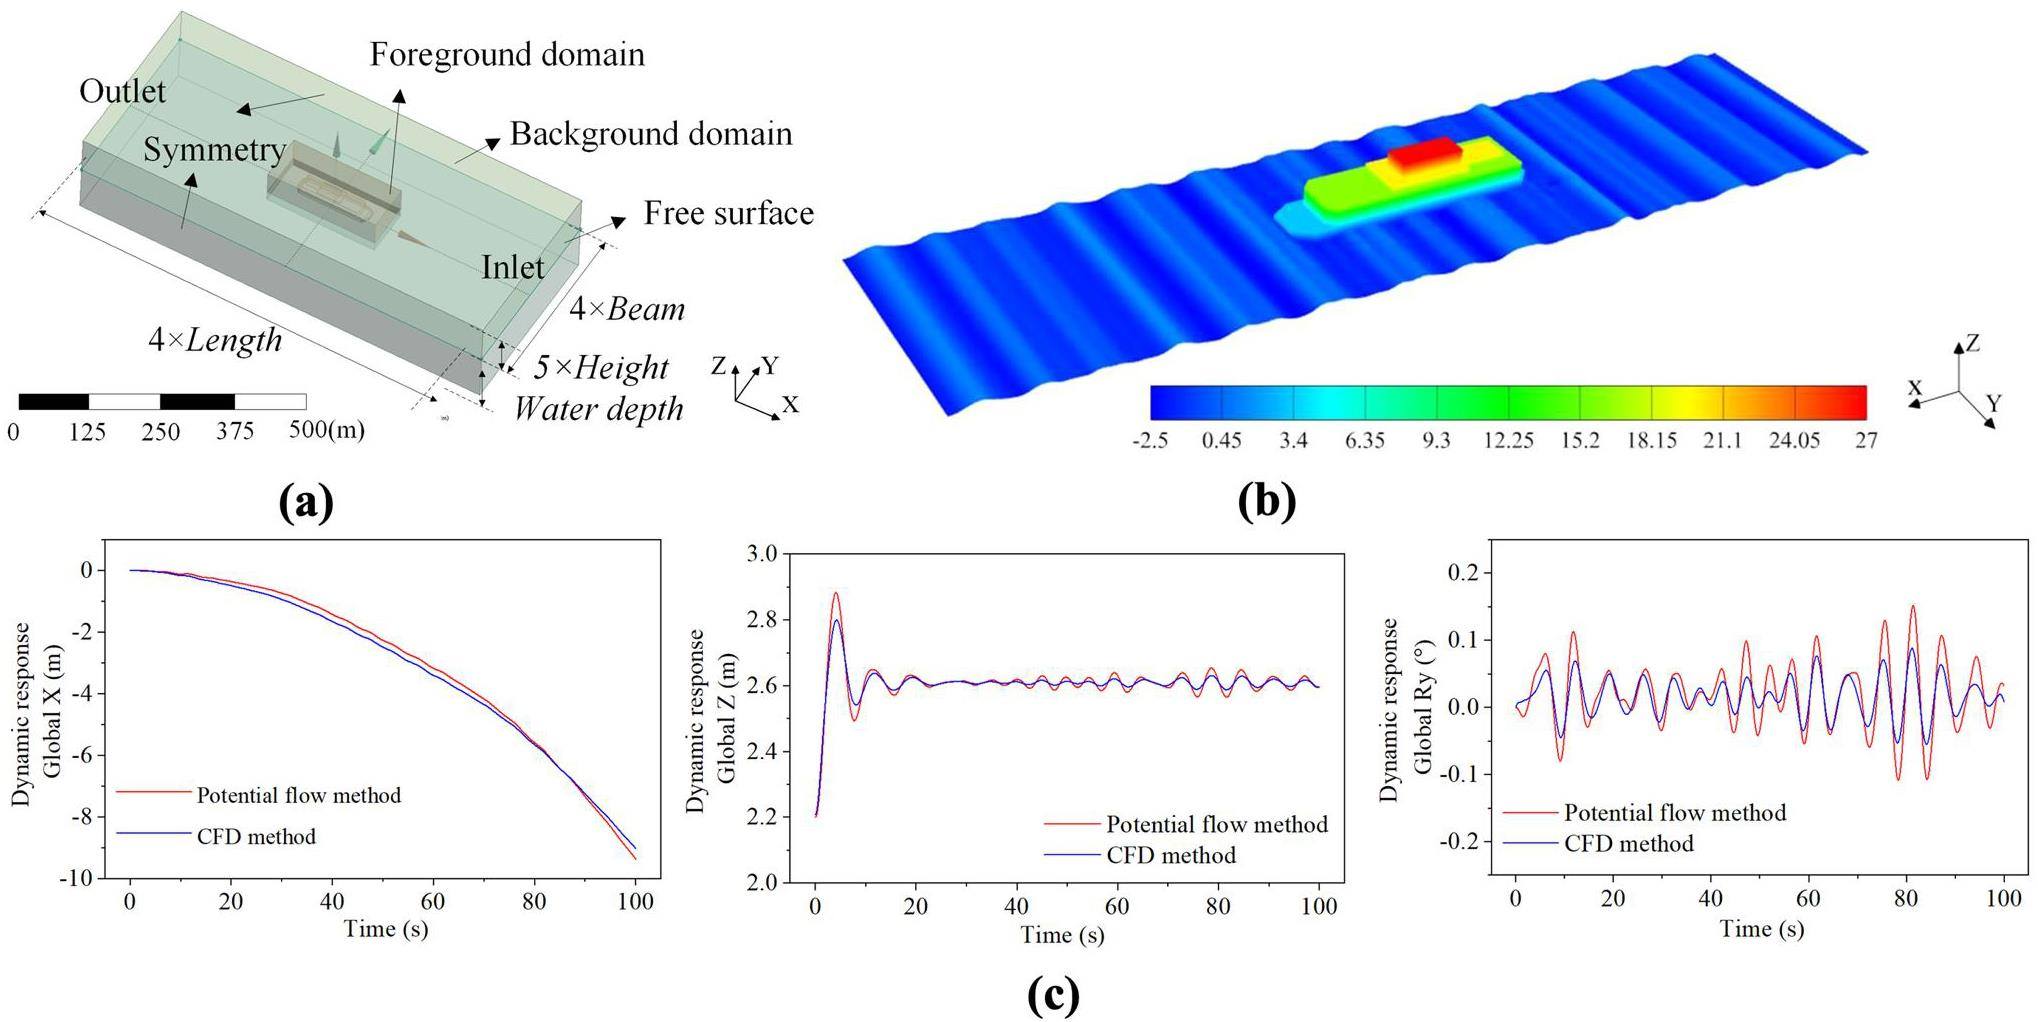
We conducted simulated wave generation at the inlet boundary using a Jonswap spectrum with a significant wave height of 2.5 m, a peak frequency of 0.2 Hz, and a peak enhancement factor of 3.3, as shown in Fig. 3(b). Numerical beaches were set to reduce the numerical reflections from the pressure outflow barrier. The volume of fluid (VOF) approach was used to model the air-water interface in the multiphase flow solution setup. A k-ϵ turbulence model was utilized and a six-DOF solver was activated to capture the motion response of the platform. Figure 3(c) displays the time series of the motion responses (heave, sway, and pitch) obtained under the specified wave circumstances using the potential flow theory (AQWA) and CFD approach. Including viscous factors in the CFD model led to slightly reduced platform motion responses compared with those calculated using the potential flow model. Overall, the two techniques exhibited good agreement. Because this study focused on important motion variables in the frequency domain, we can conclude that the hydrodynamic model is dependable.
Parameter correlation analysis
We created 200 sample points within the sample space to evaluate the sensitivity to different combinations of environmental characteristics and dynamic responses. The environmental attributes of the sampling points were determined using the following coupling relationships:
1. The current speed is determined by the wind speed using the equation
2. Wind speed influences the major wave height and wave peak period according to the criteria outlined in Table 2 [25].
| Beaufort number | Wind speed (m/s) | Significant wave height (m) | Peak period (s) |
|---|---|---|---|
| 0 | 0.0–0.3 | ||
| 1 | 0.3–1.6 | 0.024 | 0.7 |
| 2 | 1.6–3.4 | 0.088 | 2.0 |
| 3 | 3.4–5.5 | 0.305 | 3.4 |
| 4 | 5.5–8.0 | 0.884 | 5.4 |
| 5 | 8.0–10.8 | 2.103 | 7.7 |
| 6 | 10.8–13.9 | 3.962 | 9.9 |
| 7 | 13.9–17.2 | 7.010 | 12.4 |
| 8 | 17.2–20.8 | 11.28 | 14.9 |
| 9 | 20.8–24.5 | 17.68 | 17.7 |
| 10 | 24.5–28.5 | 25.30 | 20.8 |
| 11 | 28.5–32.7 | 35.36 | 24.0 |
| 12 | 32.7–37.0 | 39.01 | 26.0 |
3. As per BV guidelines [26], wind and wave incident directions must not exceed 45°, and current and wave incident directions must not exceed 30°.
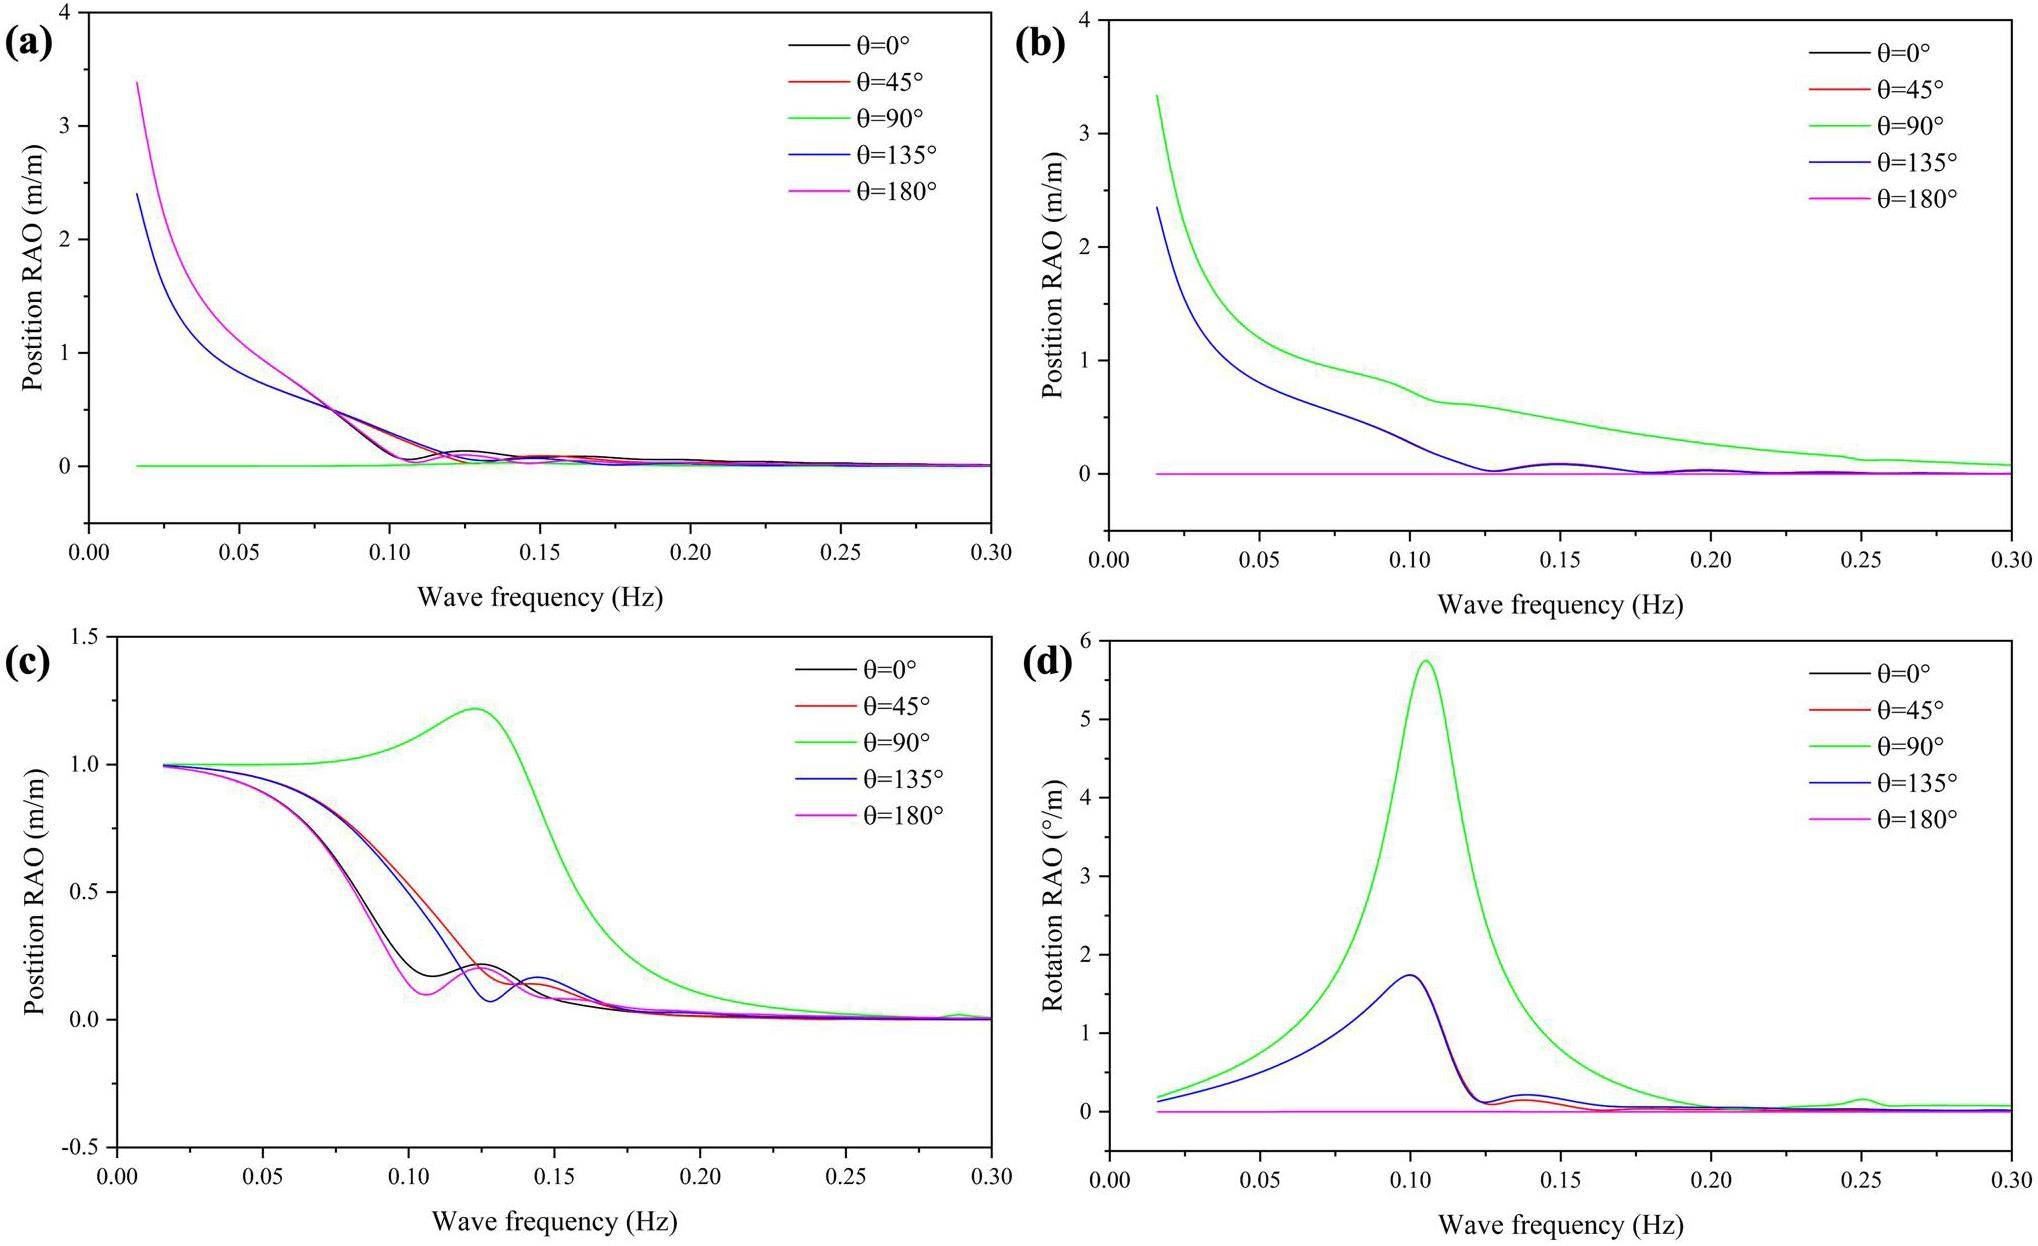
We used a random function generator to create sets of wind-wave-current events for the sensitivity analysis. Each set included nine predetermined input parameters: wind speed, wind incident angle, current speed, current incident angle, significant wave height, wave peak frequency, peak enhancement factor, and wave incident angle. We filtered the wind-wave-current events that did not adhere to the coupling relationships. This process was repeated until 200 sets of sample events were obtained. We analyzed 200 sample points to conduct correlation and sensitivity analyses to determine the influence of each environmental component on the motion response of the platform.
Zhou et al. [27] employed the Spearman method to investigate the correlations between individual environmental and output parameters. Spearman's rank correlation measures the strength and direction of the association between two ranked variables. The formula for Spearman's sensitivity coefficient is
Response surface model construction
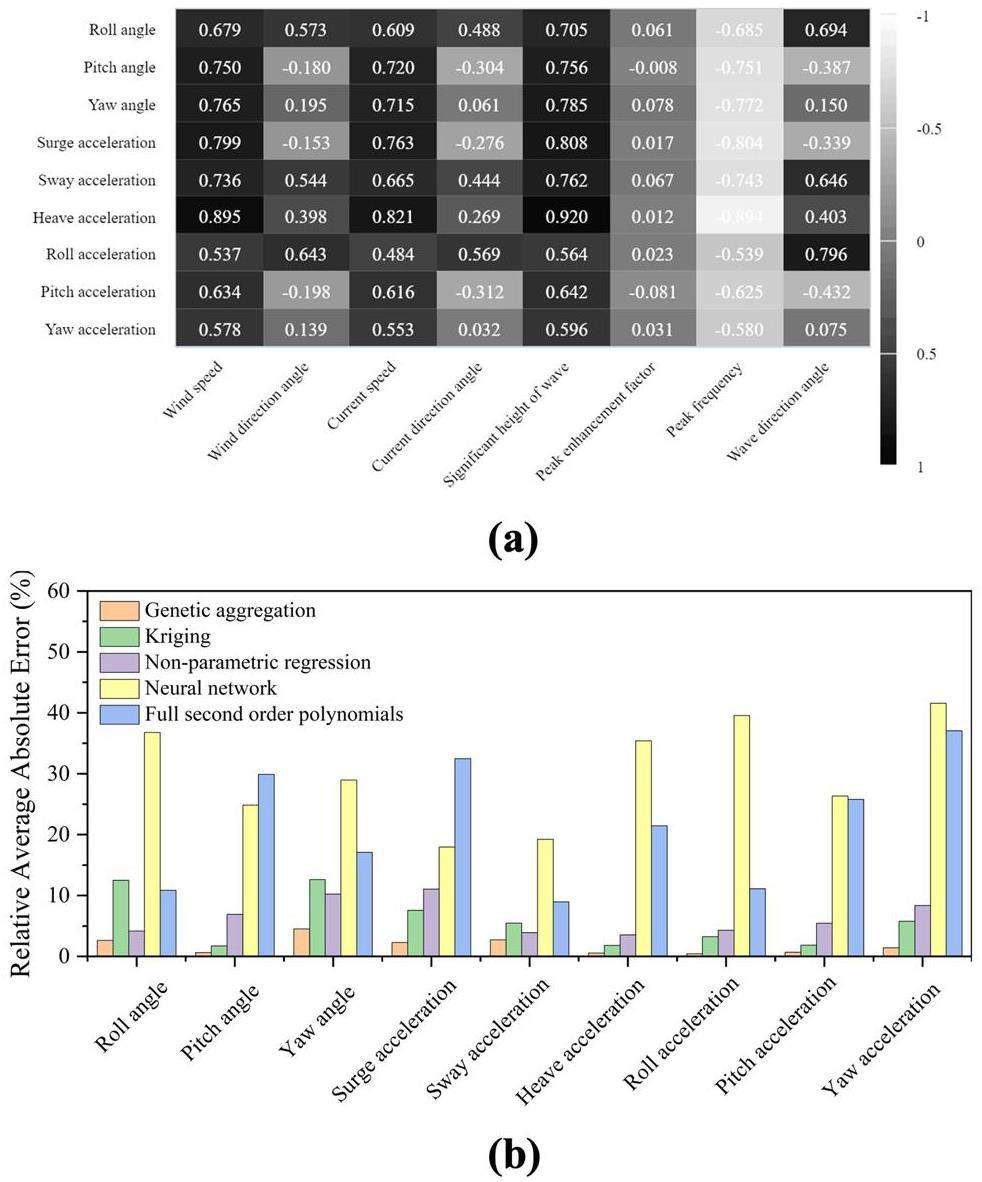
The Design of Experiments (DOE) is a structured process and testing strategy used to organize and conduct tests to obtain dependable, accurate, and statistically meaningful data. The Optimal Space-Filling (OSF) design is a technique commonly used in the DOE [28, 29]. We used an OSF design to create 1,000 sample points to construct the necessary response surfaces based on the sensitive parameters stated earlier. Several procedures exist for creating response surfaces, including the genetic aggregation method, Kriging response surfaces, non-parametric regression methods, and neural network approaches with a single hidden layer. We evaluated the effectiveness of these response surface models by analyzing 200 randomly generated sample points, as shown in Fig. 4(b). Because the neural network was set up with fewer layers and cells and limited sample testing, model fitting did not produce adequate results. The traditional quadratic polynomial model was inadequate for capturing the dynamic reaction of the FNPP. However, the Kriging and non-parametric regression models demonstrated enhanced performance. The genetic aggregation algorithm produced a response surface surrogate model that showed superior predictive abilities for nine output parameters, with an average relative error of less than 5%, compared to the hydrodynamic model calculations. We utilized the genetic algorithm clustering response surface to forecast the dynamic performance of the FNPP's four-point mooring setup in the presence of winds, waves, and currents.
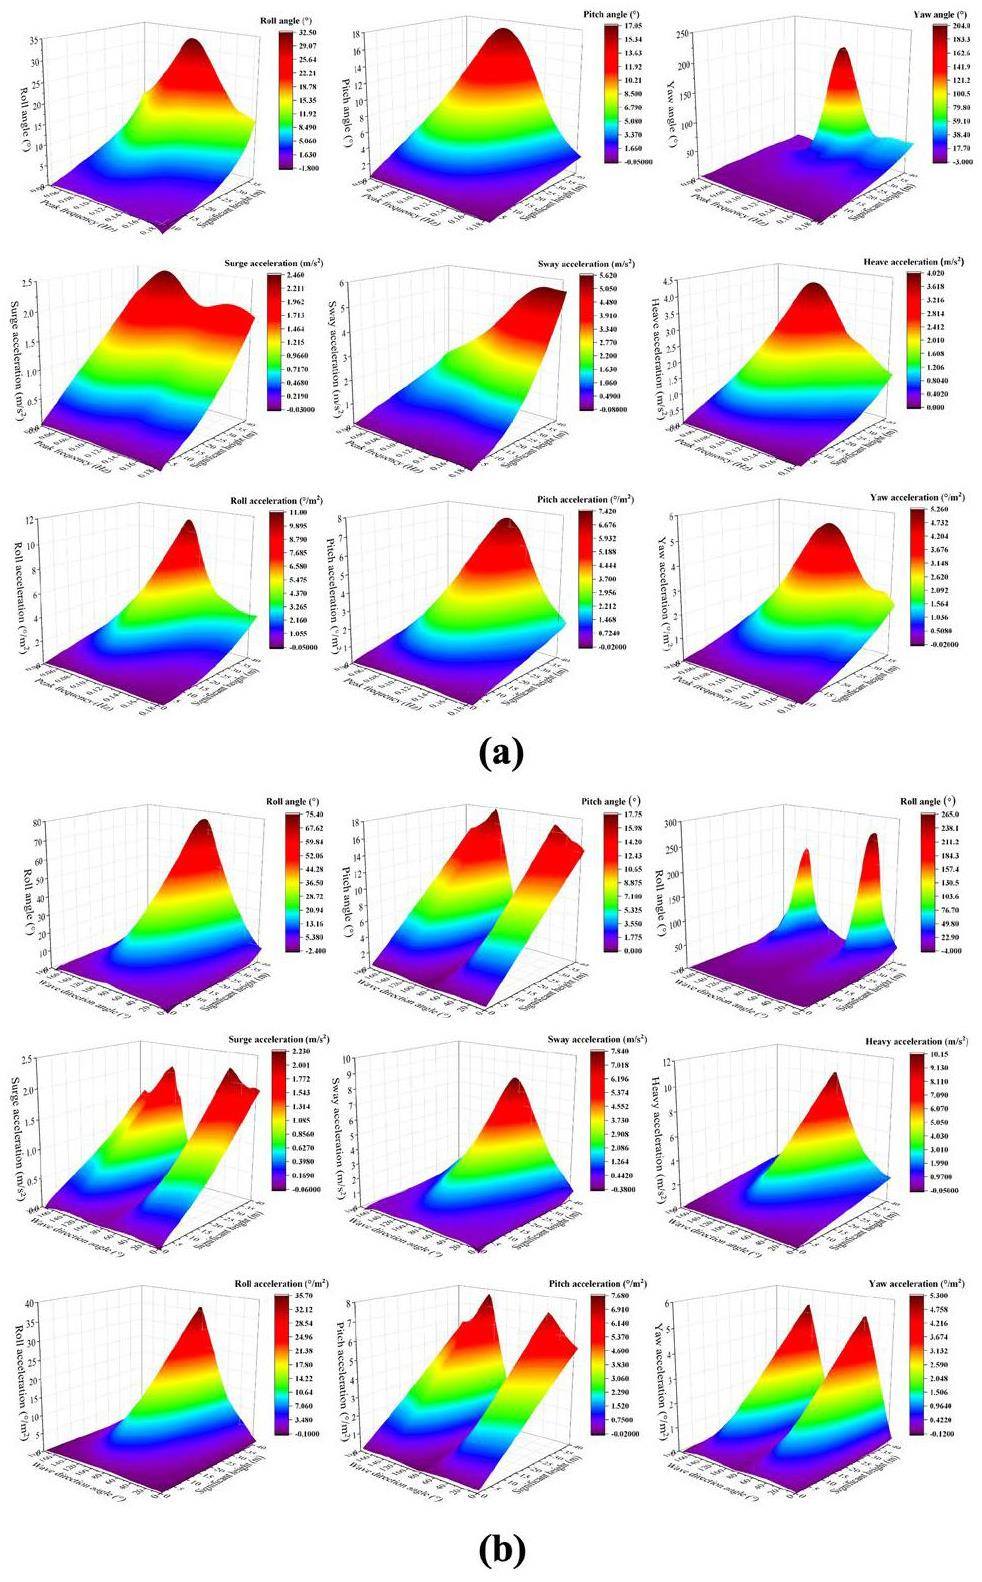
The use of the advanced genetic algorithm clustering response surface surrogate model improved the computational efficiency and maintained accuracy, eliminating the requirement for lengthy repeated processes in hydrodynamic calculations. Figures 6 (a) and (b) depict two-dimensional response surfaces of FNPP motion responses, calculated utilizing the surrogate model. Figure 6(a) shows the impact of substantial wave height and spectral peak frequency on the six-DOF motion of the FNPP. As the significant wave height increased, the motion response for each degree of freedom increased accordingly. The FNPP's hydrodynamic reaction to variations in the spectral peak frequency exhibited a single peak pattern, with the highest motion response occurring at an estimated spectral peak frequency of 0.12 Hz. Figure 4(b) shows the six-DOF response related to the significant wave height and wave incident angle. A single spectral peak was evident on the response surface for the pitch, heave, and roll motions, linked to waves with a 90° incidence angle. The response surface exhibited two spectrum peaks for the sway, surge, and yaw motions, corresponding to waves with incident angles of 45° and 135°.
Sampling and evaluation
The response surface model simplifies the process of converting the wave characteristics into the motion response of a floating platform, ensuring speed and accuracy. This feature is particularly advantageous in marine regions with abundant historical observational data. By systematically extracting historical data and translating them into platform motion responses, wave-induced dangers in a specified marine area can be assessed. We used historical wave observation data from the National Marine Data Center [30] as the basis for our dataset to study the impact of wave events on the FNPP in the selected sea area from 1969 to 2018.
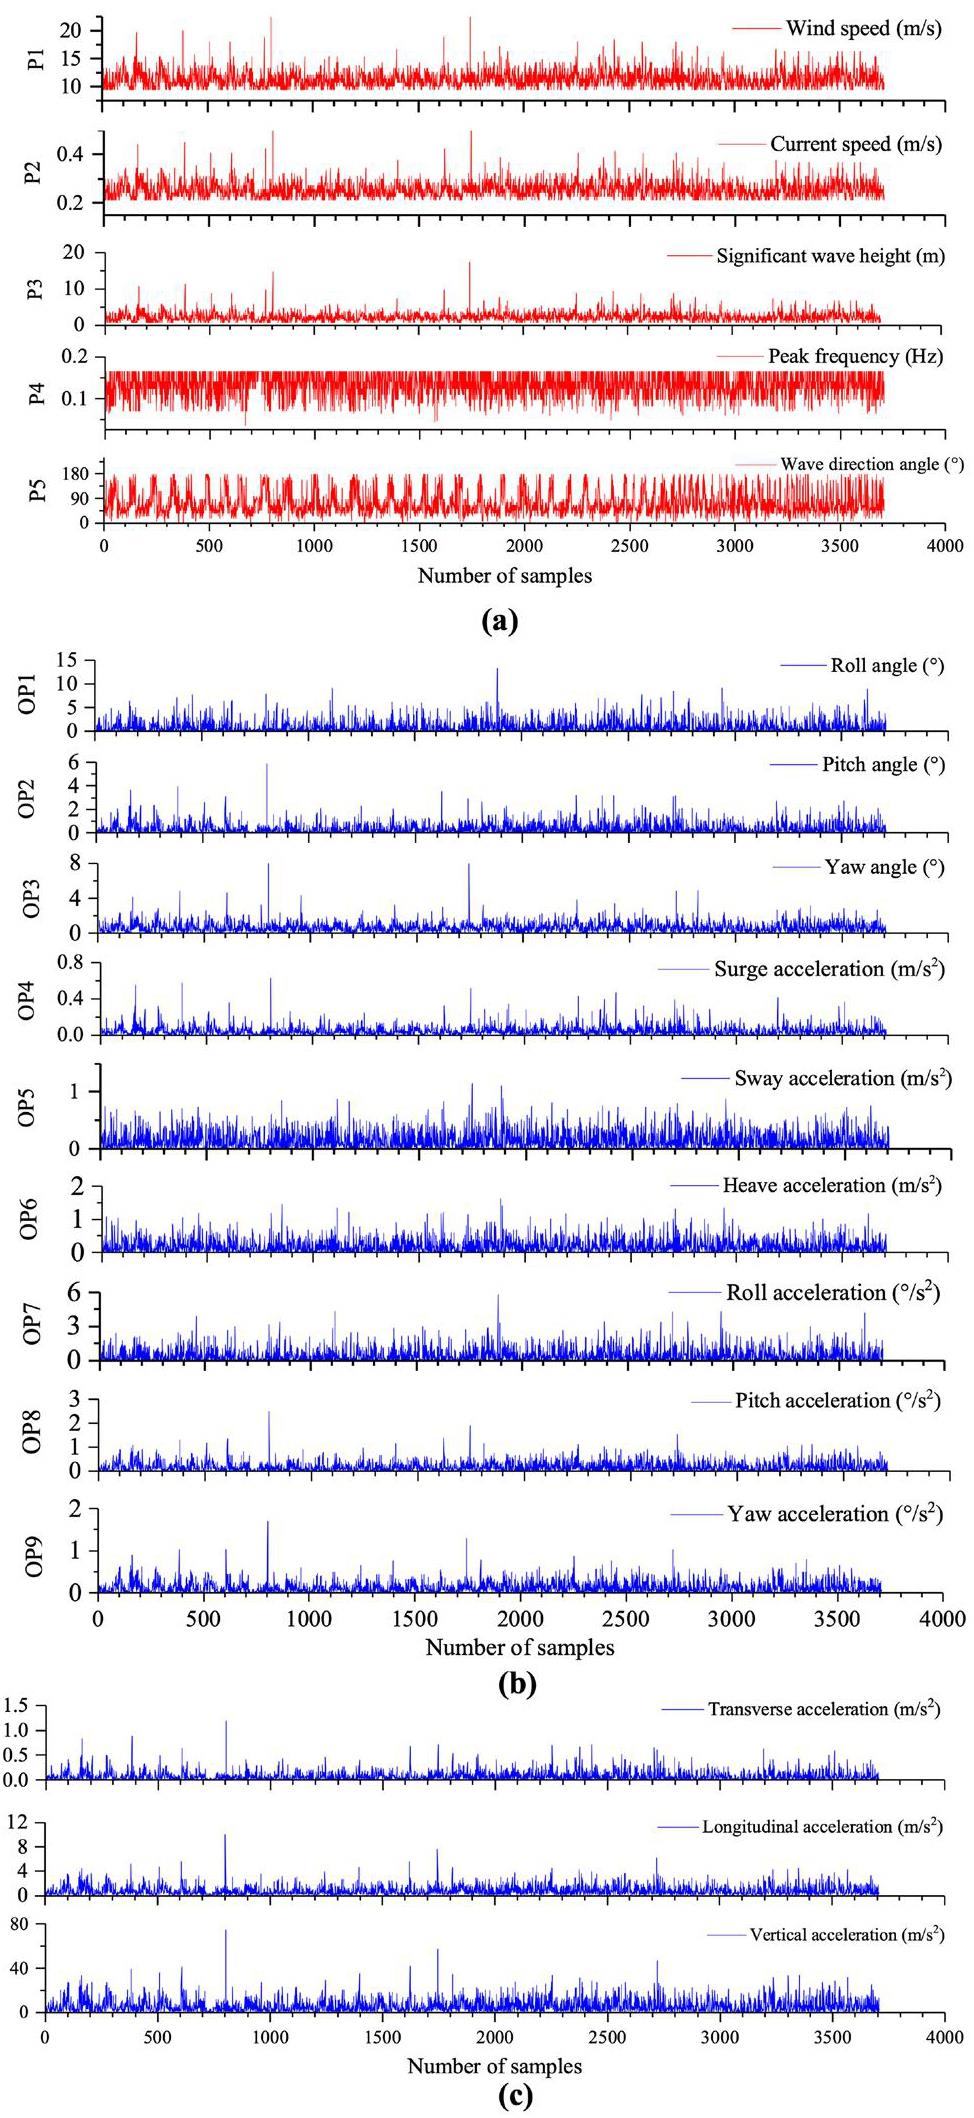
The front of the barge platform faced south, whereas the back faced north. Within the marine area from 113°E to 114°E longitude and 20°N to 21°N latitude, 3,072 unique wave occurrences were recorded over a 50-y timeframe. Figure 7(a) provides a summary of the input parameters for each historical wave event, emphasizing the strong interconnections among wind speed, current speed, and significant wave height. Owing to the symmetry of the platform, waves traveling from 180° to 360° had the same effect as waves traveling from 180° to 0° in the opposite direction. The advanced genetic aggregation response surface model allowed the generation of output data in less than 2 s. Figure 7(b) displays the results related to all nine measured output parameters during different wave events. Figure 7(b) shows that the highest calculated roll angle for the 50-y period due to wave events was 13.5°, with the next highest being 9.3°. The maximum computed value for the pitch angle was moderate at 5.9°.
Safety measures were implemented by the Russian Maritime Register of Shipping [31] to mitigate wave-related dangers to the FNPP. These restrictions focus on the motion response of the FNPP nuclear steam supply system, as outlined in Table 3. In addition to the steam supply system, substantial swaying negatively affects the mechanical and electronic equipment on the platform. The China Classification Society (CCS) [32] established safety requirements for these systems under wave action, as shown in Table 3. Some mechanical equipment is highly sensitive to non-steady-state shocks. When exposed to waves with extended durations and lower peak accelerations, the response motion acceleration should not exceed 100 m/s2. The safety standards state that the roll angle of the FNPP should not exceed 22.5° under wave influence, and the pitch angle should be maintained below 7°. Exceeding these boundaries could potentially affect the main and auxiliary machinery, emergency machinery and equipment, and the machinery and systems that facilitate the operation of the steam supply system.
| No. | Conditions | Machinery and systems providing operation of steam supply system | Main and auxiliary machinery | Emergency machinery and equipment |
|---|---|---|---|---|
| 1 | Long-term heel (°) | 30 | 15 | 22.5 |
| 2 | Roll (°) | 45 | 22.5 | 22.5 |
| 3 | Long-term trim (°) | 10 | 5 | 10 |
| 4 | Pitch (°) | 15 | 7 | 10 |
The most significant roll and pitch angles calculated from the sample data collected over a 50-y period were 13.5° and 5.9°, respectively. Wave events occurring in the marine area between longitudes 113°E and 114°E and latitudes 20°N and 21°N did not pose a threat to the safety of the nuclear steam supply system located on the floating platform. The risk levels presented by these waves were minimal.
Acceleration on different parts of the platform due to waves was not consistent. The bow and stern of the ship underwent higher accelerations than the midship during wave impact. The frequency-domain hydrodynamic analysis yielded the acceleration response at the CoG of the platform. The acceleration synthesis formula from the CCS [33] provides the lateral, longitudinal, and vertical accelerations at various locations on the platform.
The Akademik Lomonosov platform had two KLT-40S modular reactors positioned at the CoG, with the steam turbine located approximately 30 m horizontally from the CoG toward the bow. The reactor system parameters OP7–OP9 represent the transverse, longitudinal, and vertical accelerations at the CoG, respectively. Fig. 7(c) shows the generated acceleration data for the steam turbine based on its specific position. After analyzing historical wave data spanning 50 y, the steam turbine was found to reach a maximum vertical acceleration of 76 m/sÂ2, which is considerably lower than the CCS-regulated limit of 100 m/sÂ2. The non-steady-state effect of wave episodes during the last 50 y had not directly damaged the steam turbine.
Estimation of the return period of dangerous waves
Although most sea areas have not posed a threat to the FNPP or its systems from wave occurrences in the last 50 y, it is important to consider long-duration wave events. We analyzed the annual extreme value distribution of the major wave height to better understand the recurrence period when wave events at this location could potentially threaten the FNPP. The generalized extreme value (GEV) distribution model is one of the most suitable for describing the distribution of significant wave heights. The cumulative distribution function of the GEV is as follows:
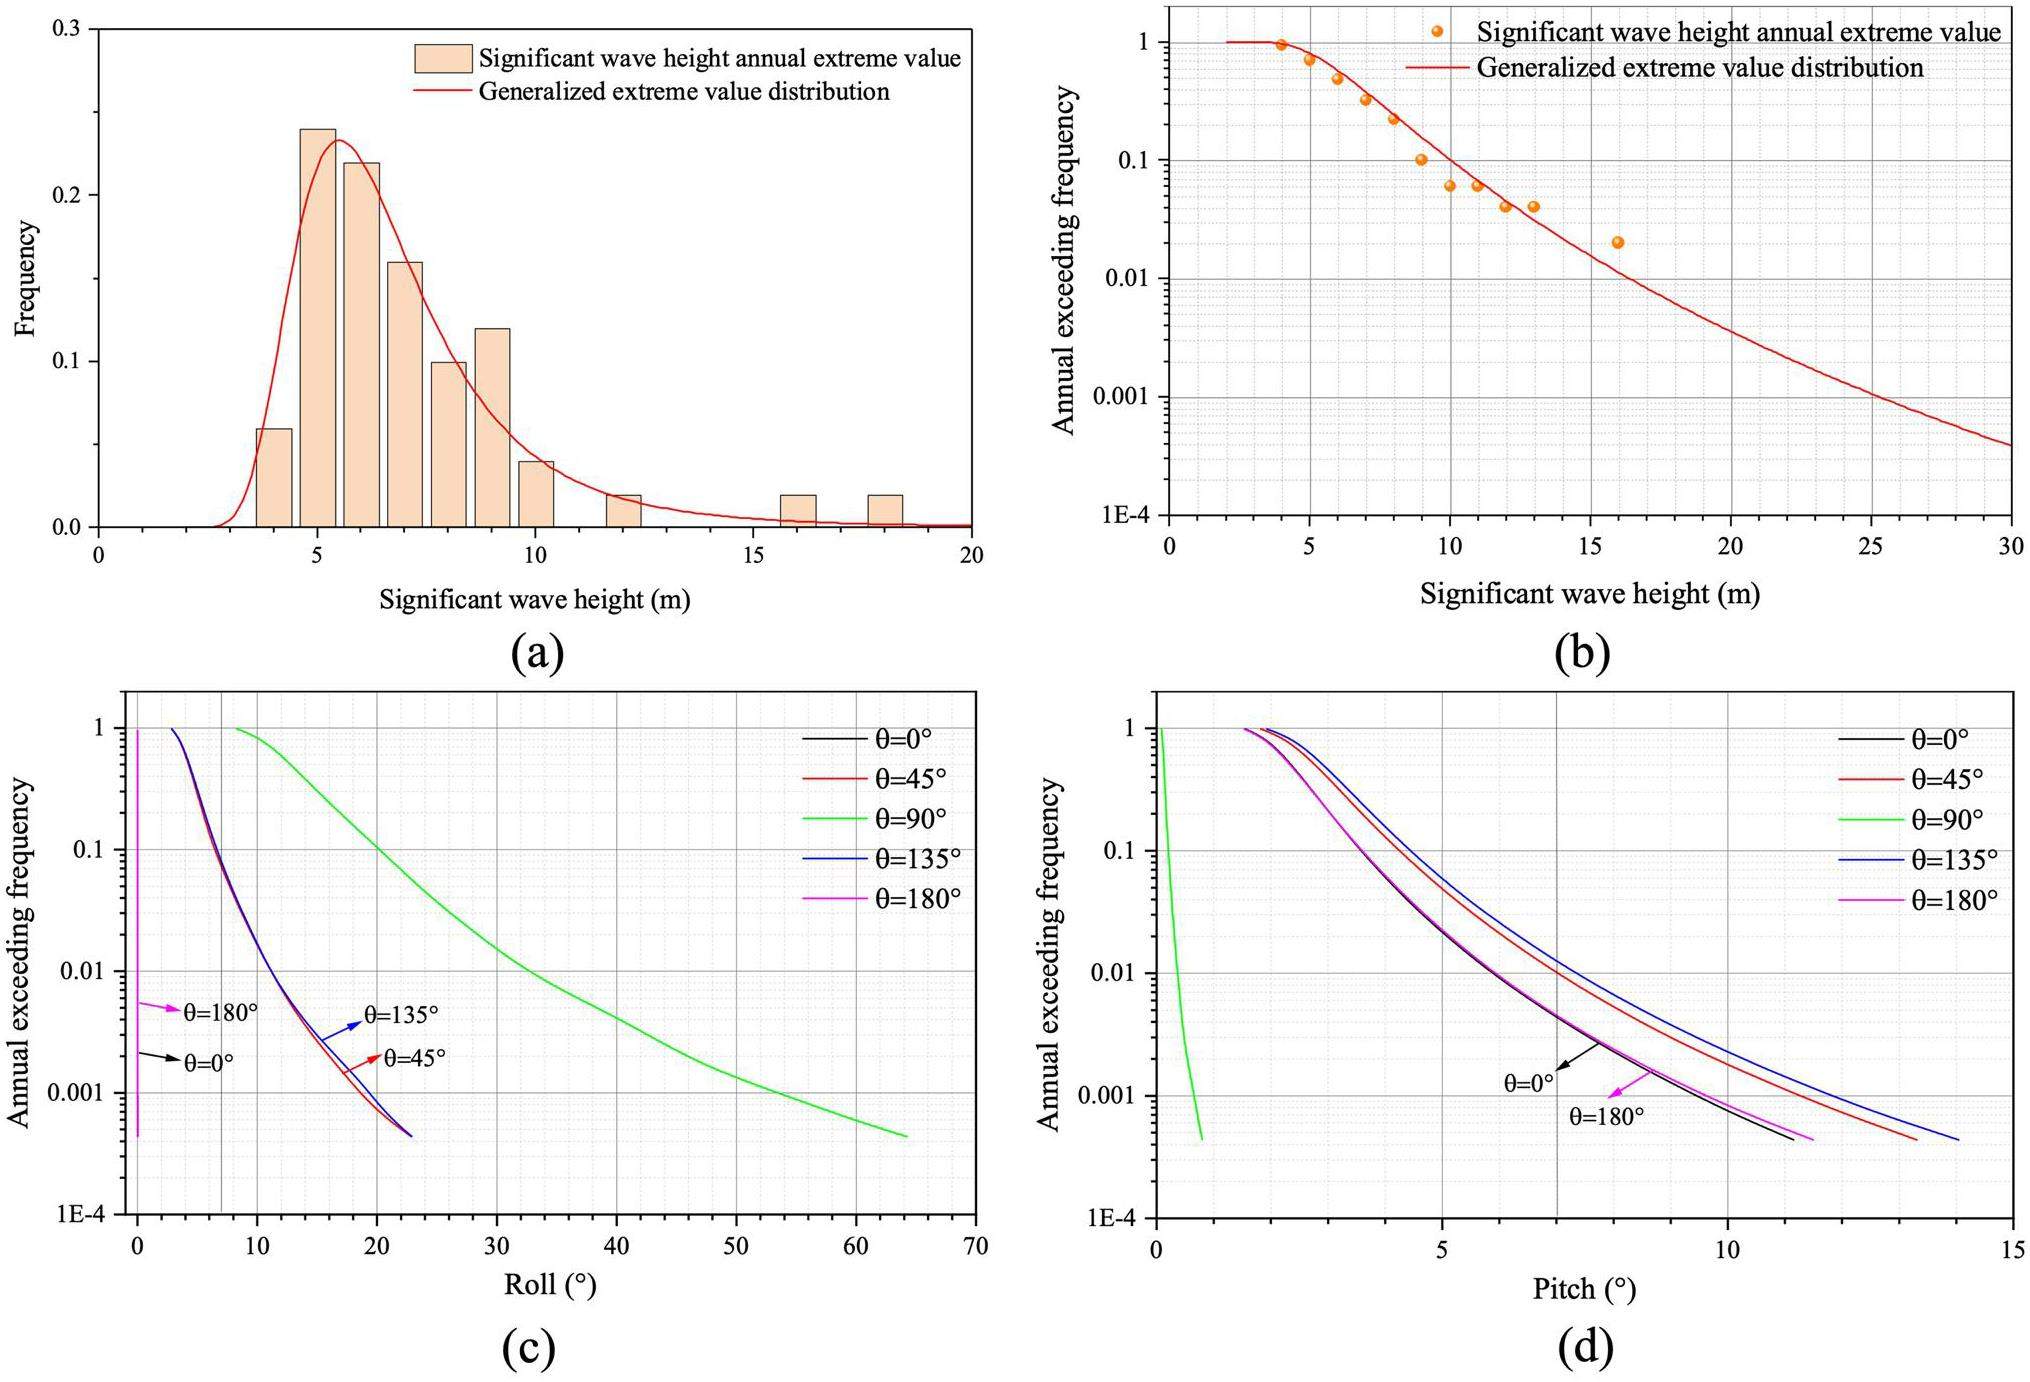
The GEV and cumulative probability density functions for the yearly extreme significant wave heights were determined based on historical data, as shown in Figs. 8(a) and (b). These numbers were transformed into the FNPP's hydrodynamic response using a surrogate response surface model. Figs. 8(c) and (d) display the annual exceedance probabilities of the FNPP's motion responses for different wave incident angles. The FNPP was a barge-type platform with a length-to-width ratio exceeding three, causing its hydrodynamic response to vary significantly depending on the angle of the incident waves. Hazardous rolling motions that could affect FNPP infrastructure and systems occurred every 16.4 y when the wave incident angle was 90° in the designated marine area. Waves that posed a risk to the FNPP and created harmful pitch angles had return periods of approximately 80 y for incident angles of 45° and 101 y for incident angles of 135°. Considering how the wave incident angles affect both roll and pitch movements, the FNPP should aim to avoid beam–sea situations.
Conclusions
We conducted a study to assess the possible dangers posed by waves on barge-type FNPPs, with a specific focus on the hydrodynamic behavior of a multi-point moored barge FNPP. This study initially investigated how different environmental factors affected the barge-type FNPP through correlation and sensitivity analyses. A genetic aggregation approximate response surface prediction model was created for the next phase. This study utilized an experimental approach based on ANSYS AQWA to enhance the short-term frequency response predictions of the FNPP. Historical wave observation data over the last 50 y were rapidly transformed into FNPP hydrodynamic reactions using surrogate models. We assessed the risk level of sea waves by applying certain threshold values for hazardous roll angles, pitch angles, and equipment accelerations. Furthermore, we analyzed the return duration of waves that could trigger hazardous responses from the FNPP to assess the long-term risks presented by sea waves in these locations. The conclusions of this study are as follows:
(1) In the reduced-order model, the GARS prediction model demonstrated superior predictive power compared to the Kriging method, non-parametric regression model, typical full second-order polynomial model, and neural network approach, with an average relative error of less than 5%.
(2) The motion response of the FNPP was significantly affected by the significant wave height, spectral peak frequency, and wave incident angle, whereas the influence of the spectral peak enhancement factor was moderate, as indicated by the sensitivity analysis. The waves at incident angles of 45° and 135° had the greatest impact on the heave, pitch, and yaw motions. Furthermore, waves with incident angles of 90° had the most significant impact on sway, surge, and roll.
(3) Analysis of the hydrodynamic response of the selected sea area (113°E114°E, 20°N21°N) over the past 50 y indicated that, from the perspective of roll angle restrictions, pitch angle restrictions, or acceleration limits, wave events over 50 y did not pose a threat to the FNPP.
The platform hydrodynamic model constructed using AQWA included a crucial damping correction approach to account for the impact of viscosity, which is common practice in ocean engineering. Although it exhibited substantial agreement with CFD results, its accuracy may not be entirely adequate because of the lack of experimental validation. Future studies will focus on improving this method using scaled model tests.
Thermal hydraulic characteristics of helical coil once-through steam generator under ocean conditions
. Nucl. Sci. Tech. 33, 134 (2022). https://doi.org/10.1007/s41365-022-01108-9The offshore floating nuclear plant concept
. Nucl. Technol. 194, 1-14 (2016). https://doi.org/10.13182/NT15-49Recent advances in ocean nuclear power plants
. Energies. 8, 11470-11492 (2015). https://doi.org/10.1007/s41365-022-01108-9PSA study of the effect of extreme snowfall on a floating nuclear power plant: case study in the Bohai Sea
. Nucl. Sci. Tech. 34, 179 (2023). https://doi.org/10.1007/s41365-023-01335-8A novel approach for radionuclide diffusion in the enclosed environment of a marine nuclear reactor during a severe accident
. Nucl. Sci. Tech. 33, 19 (2022). https://doi.org/10.1007/s41365-022-01007-zThe World's First Floating NPP: Origination and Direction of Future Development
. At. Energy. 129, 27-34 (2020). https://doi.org/10.1007/s10512-021-00707-wExperimental and numerical study of a barge-type FOWT platform under wind and wave load
. Ocean Eng. 230,Safety analysis of a 300-MW (electric) offshore floating nuclear power plant in marine environment
. Nucl. Technol. 203, 129-145 (2018). https://doi.org/10.1080/00295450.2018.1433935Development and validation of a thermal hydraulic transient analysis code for offshore floating nuclear reactor based on RELAP5/SCDAPSIM/MOD3.4
. Ann. Nucl. Energy. 127, 215-226 (2019). https://doi.org/10.1016/j.anucene.2018.12.004Research progress of reactor thermal-hydraulic characteristics under ocean conditions in China
. Frontiers in Energy Research. Front. Energy Res. 8,Review of the nuclear reactor thermal hydraulic research in ocean motions
. Nucl. Eng. Des., 313, 370-385 (2017). https://doi.org/10.1016/j.nucengdes.2016.12.041Dynamic response of a multi-point mooring cylindrical floating nuclear power platform carrying a small-scale reactor
. Ocean Eng. 267,Short-term prediction of hydrodynamic response of a novel semi-submersible FOWT platform under wind
. Ocean Eng. 278,Rigid multibody dynamic modeling for a semi-submersible wind turbine
. Energy Convers. Manag. 244,Effects of bracings and motion coupling on resonance features of semi-submersible platform under irregular wave conditions
. J Fluids Struct. 92,Second-order hydrodynamic effects on the response of three semisubmersible floating offshore wind turbines
. Ocean Eng. 207,Validation of a FAST semi-submersible floating wind turbine numerical model with DeepCwind test data
. J. Renew. Sustain. Energy 5,Wind field simulation
. Probabilistic Eng. Mech. 13, 269-282 (1998). https://doi.org/10.1016/s0266-8920(97)00036-2Parameterization of wave spectra and long term joint distribution of wave height and period
.Optimization investigation on configuration parameters of spiral-wound heat exchanger using Genetic Aggregation response surface and Multi-Objective Genetic Algorithm
. Appl. Therm. Eng. 119, 603-609 (2017). https://doi.org/10.1016/j.applthermaleng.2017.03.100Rapid analysis of packed pebble beds for thermal-hydraulic characteristics via reduced order models
. Chem. Eng. Sci. 280,Assessing focused wave applicability on a coupled aero-hydro-mooring FOWT system using CFD approach
. Ocean Eng. 240,Efficient nearly orthogonal and space-filling Latin hypercubes
. Technometrics 49, 45-55 (2007). https://doi.org/10.1198/004017006000000453Fast generation of space-filling latin hypercube sample designs
.National Marine Data Center
, https://mds.nmdis.org.cn/pages/home.html. AccessedThe authors declare that they have no competing interests.

