Introduction
Growing demand for clean energy has accelerated the development of the nuclear energy industry. Nuclear reactor components must operate in environments with high temperatures, stresses, irradiation, and hydrogen concentrations [1-6] and may develop nanocracks. Therefore, their safe operation requires an understanding of the stabilization behavior of these nanocracks at high temperatures. Al alloys have a small thermal neutron absorption cross-section, excellent plasticity, favorable thermal conductivity, and machinability, and are widely applied in nuclear reactor cladding shells and pressure vessels [1, 2]. The best candidate metal for the first wall is W owing to its high melting point, high-temperature strength, high thermal conductivity, and resistance to irradiation damage [3, 4]. However, the harsh, high-temperature, high-stress, and highly corrosive environment inside reactors requires Al and W alloys with exceptional stability and strength. Although Ti is commonly used to store nuclear waste, it is susceptible to grain boundary (GB) embrittlement [5]. In this study, Al, W, and Ti alloys were investigated to understand the high-temperature stability of GB cracks.
Over the past few decades, alloys containing Al, W, and Ti with microstructures that resist deformation, cracking, and failure (e.g., crack initiation, propagation, and extension) have been successfully developed [1-5]. However, few studies have investigated alloy failure prevention or remediation. For metals, most self-healing methods rely on temperature and stress, which activate atomic diffusion for crack healing. For example, stress-driven GB migration, which may originate from inhomogeneous stresses, is widely observed in nanocrystalline metals; this GB migration can promote crack healing [6]. If localized compressive stresses drive crack healing at the GBs, then concentrated tensile stresses near the GBs may damage the structure in this vicinity; that is, crack healing requires a stable structure that can store additional energy [4, 5]. The GB crack healing is closely related to GB migration; therefore, the stability and characteristics of this migration should be investigated. The complementary process of high-temperature-driven microstructural evolution can also promote GB crack healing; the disappearance of GB microcracks is driven by atomic diffusion after atoms break GB crack bonds at high temperatures [6-9]. However, an accurate mechanical model of alloy crack migration at high temperatures has not yet been developed. To date, design strategies for self-healing materials have only been proposed for polymers and composites [10].
Temperature affects both GB nanocrack sprouting and healing. This can promote crack healing by activating the structures within the grains. At low temperatures (e.g., 0, 293, or 373 K), GB nanocracks heal through mechanical or chemical mechanisms, and the GB crack stability is dependent on the GB characteristics and crack surfaces. At high temperatures, binding at the crack surface may enhance GB crack stability, and random atom diffusion on the crack surface may contribute to healing [6]. Furthermore, low temperatures inhibit the formation of amorphous nano-cracked structures. Few crack formation and extension theories explain crack stability and healing, and research on the stabilization behavior of nanocrack surfaces (e.g., diffusion, clustering, and atom disordering) at high temperatures are rare [7, 8]. Nanocrack sprouting is a representative GB structure behavior that relies solely on the localized energy or diffusion of individual atoms to confirm that the stability of a nano-cracked surface is inappropriate [8]. GB self-healing is closely related to the cracking state.
To investigate the adsorption behavior of crack surfaces and the healing behavior after complete GB fracture, we selected face-centered cubic (FCC) Al, body-centered cubic (BCC) W, and hexagonal close-packed (HCP) Ti alloy GBs and separated them into crack surfaces. The structure of the nanocracks, as they evolved from sprouting to expansion to fracture, was established within the coherent lattices for ∑3 and ∑5 GBs. Finally, nanocrack structural stabilization and healing were simulated at 0, 293, and 373 K.
Calculation details
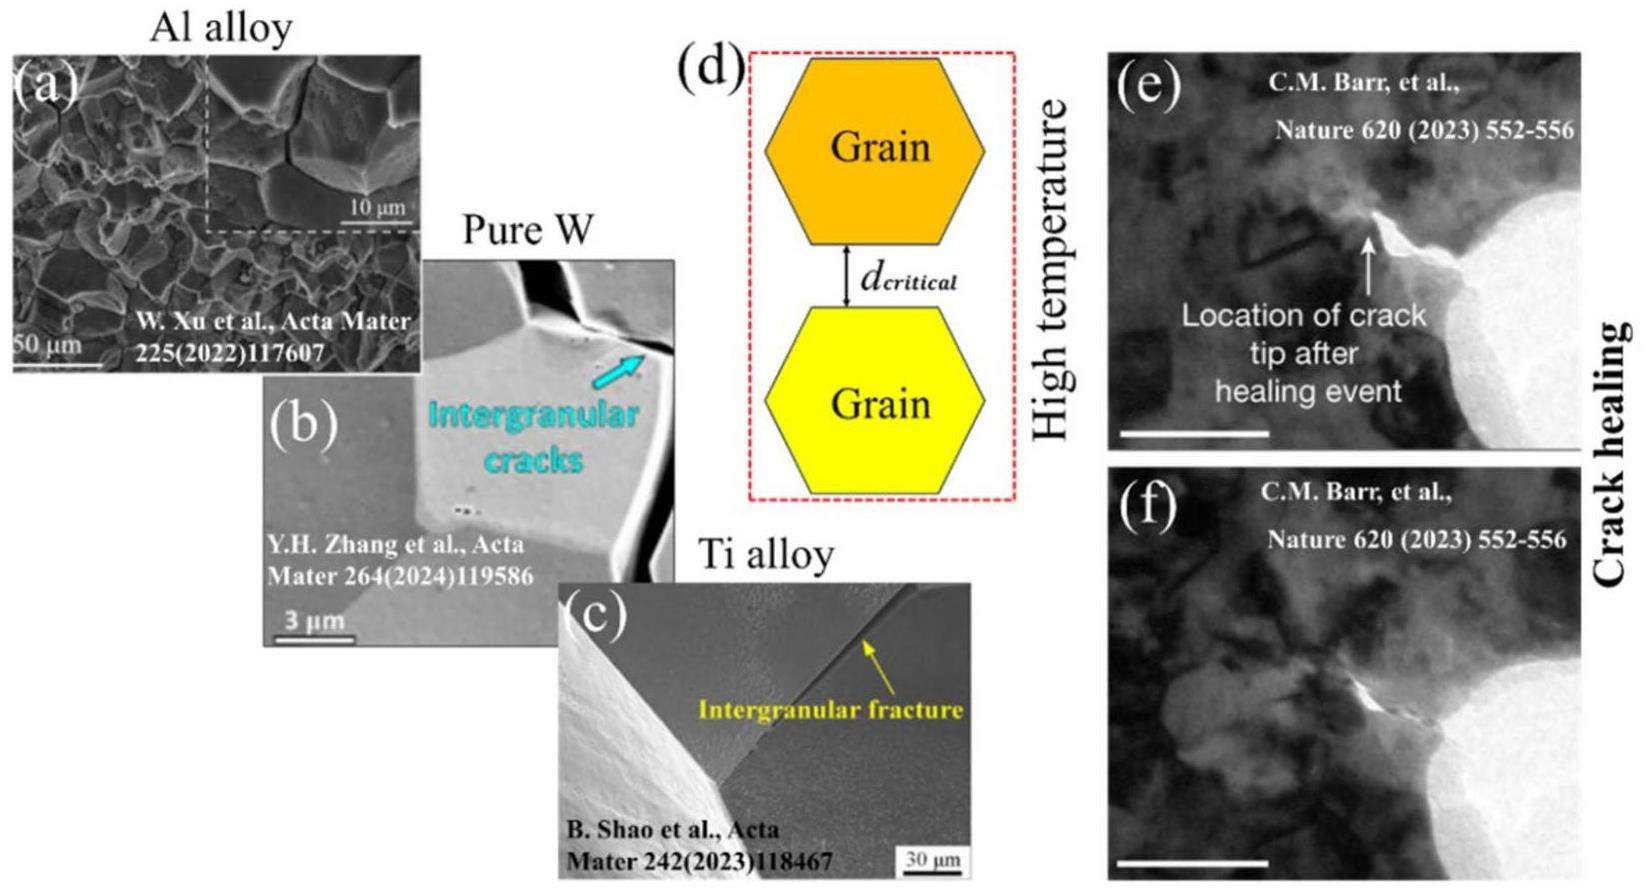
Weld, creep, and stress concentrations accelerate the sprouting of GB cracks, which significantly compromises the safe operation of nuclear reactors [7, 8]. Table 1 and Fig. 1 present the GB fracture modes of Al, pure and alloyed W, and Ti alloys at room and high temperatures. W failure is accelerated by intergranular fractures at low temperatures. Barr et al. [6] reported the self-healing of fatigue cracks in pure metals. Qiu et al. [9] quantitatively evaluated the room-temperature self-healing behavior of nanodiamond composites. Understanding the self-healing mechanisms of cracks in high-temperature and -stress environments can extend the service life of nuclear metals. However, experimentally investigating the crack-healing process is difficult [6, 7]; therefore, the present study combined simulations and thermodynamics to quantify the synergistic effects of temperature, stress, and GBs on crack healing. The GB crack structure of the metal is listed in Table 1. The fracture modes of Ti alloys at 298, 1023, and 1203 K are intergranular, proving that Ti GB cracks are not healed (Table 1). Meanwhile, crack healing in W was demonstrated in [3].
| Metal | Size | Deformation | Temperature | Fracture style | Ref. |
|---|---|---|---|---|---|
| Al alloy | 25 μm | Tensile | 293 K | Intergranular | Xu et al. [1] |
| Al alloy | 450 nm | Tensile | 293 K | Ductile | Xu et al. [1] |
| Al alloy | 20~200 nm | Fatigue | 293 K | Intergranular | Ren et al. [2] |
| Pure W | 16 μm | Punch | 423 K | Intergranular | Zhang et al. [3] |
| W-Re | 16 μm | Punch | 423 K | Transgranular | Zhang et al. [3] |
| W-Re | 16 μm | Punch | 573 K | Transgranular | Zhang et al. [3] |
| W-Ta | 200~800 nm | *LPBF | N/A | Intergranular | Li et al. [4] |
| Ti alloy | 135~500 m | Tensile | 298 K | Intergranular | Shao et al. [5] |
| Ti alloy | 135~500 m | Tensile | 1023 K | Intergranular | Shao et al. [5] |
| Ti alloy | 135~500 m | Tensile | 1203 K | Intergranular | Shao et al. [5] |
Figure 2 shows the GBs of the lattices investigated in this study. The red dashed line represents the GB plane. The HCP Ti twins, namely, (10-11) and (10-12), are defined as compression and tensile twins, respectively. Figure 2(g) shows the separation of a GB into two nano-cracked surfaces; the yellow area represents the GB nanocrack and d represents the crack width. Details regarding the calculation of d are given in [10].
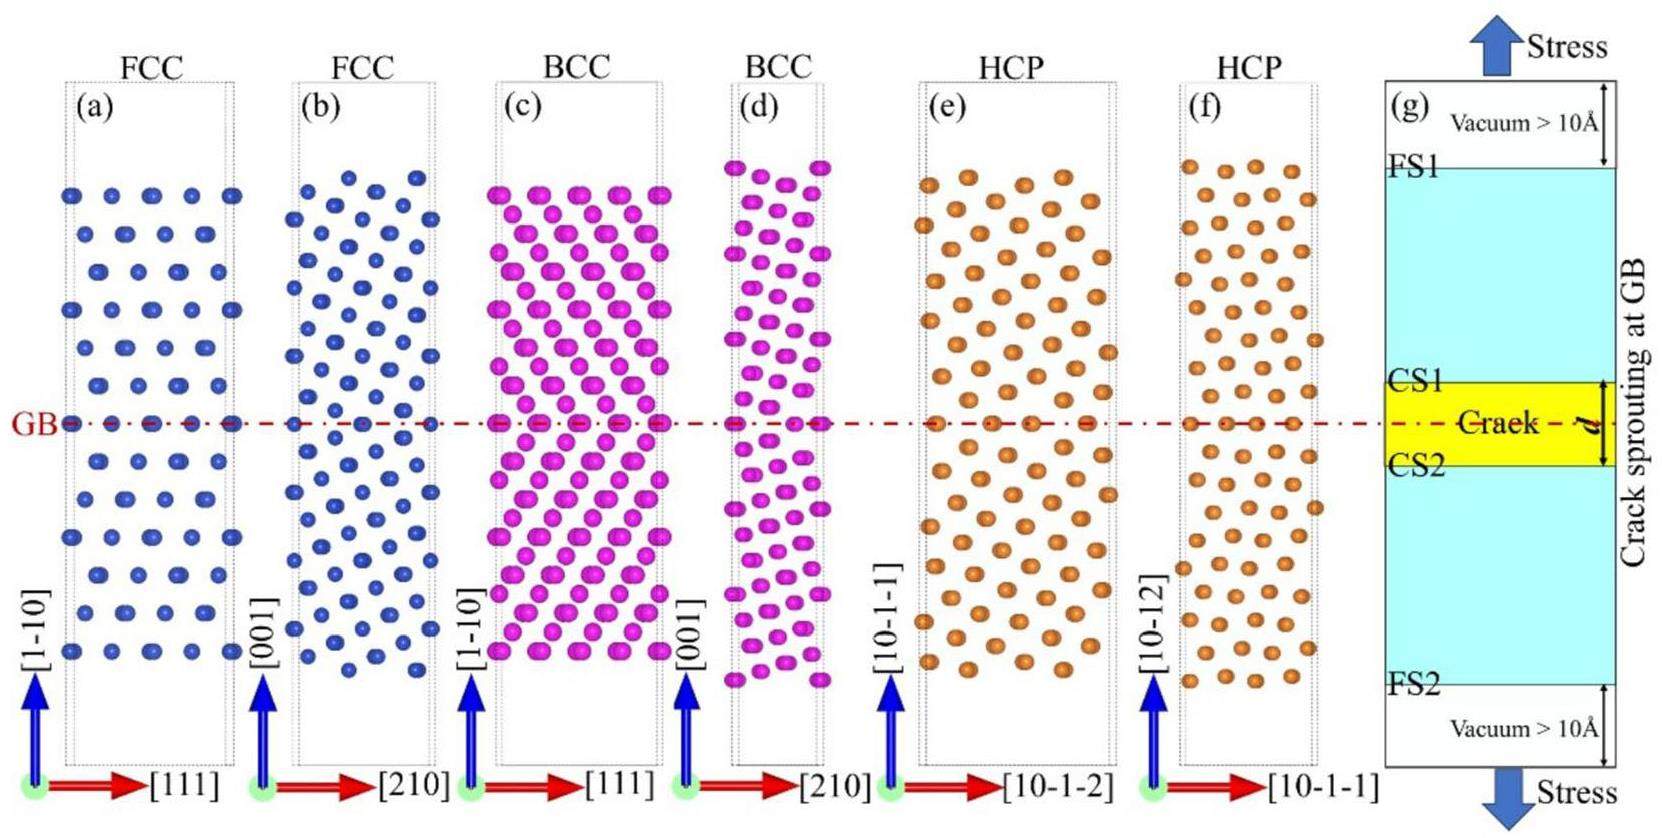
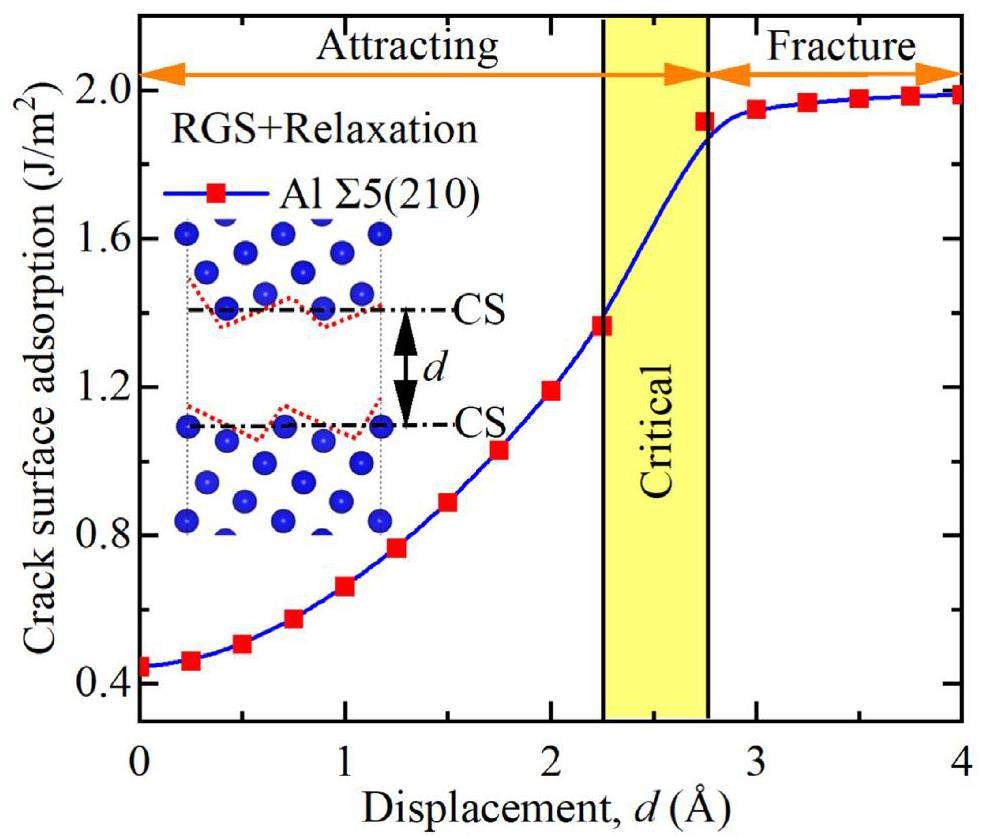
Figure 3 shows the rigid grain shift (RGS) [10]. In this model, the GB is subjected to tensile stress during relaxation between 0 and 373 K. First, a small displacement increment d is added in the direction perpendicular to the GB plane, achieving complete separation and forming two crack surfaces (CS in the figure). For each d, two calculations were performed with a fixed supercell length to obtain the RGS and relaxation at 423 K and the desired temperature. The relaxed cracks have an attraction energy Eattract (Eq. (1)), which is plotted against the displacement of the selected ∑5 (210) GB in Fig. 3. GB separation resulted in the formation of two zigzag crack surfaces (dashed red lines). However, this GB separation may be accompanied by GB self-healing; a strong attraction at the crack surface drives crack healing if Eattract < 0, however, complete GB separation occurs if Eattract = 0.
The interaction at the cracked surface for a GB separation distance of d can be characterized as
First-principles calculations were performed using the density functional theory in the Vienna Ab initio Simulation Package software [14]. Electron-ion interactions were modeled using the projector-augmented wave method [15]. The generalized gradient approximation [16] of the exchange-correlation energy was used in this study. The total energy was converged to within 10-5 eV, whereas the atomic forces were converged to within 0.02 eV/A°. The cutoff energy in the calculation was 400 eV. Ab initio molecular dynamics [13] simulations were performed to analyze the dynamic properties of the supported cracks. The calculations were performed with optimized configurations and fixed lattice parameters for durations of at least 5 ps to more than 20 ps with a 1-fs time step. A canonical ensemble (NVT) and a Nosé–Hoover thermostat were used. The temperature was set to 293 or 373 K. Table 2 lists the lattice parameters, atomic counts, sizes, K-points, GB energies, and surface energies of the assessed GB structures. The GB and surface energies are consistent with the results reported in the literature [11, 17, 18], confirming the precision of our calculations.
| X | GB | Atoms | Dimensions (Å3) | K-points | ||
|---|---|---|---|---|---|---|
| Al | ∑3(111) | 104 | 9.747×5.727×42.251 | 4×7×1 | 0.02 | 0.76, 0.78[8] |
| Al | ∑5(210) | 148 | 8.066×8.955×46.154 | 6×5×1 | 0.44 | 0.98, 0.96[17] |
| W | ∑3(111) | 100 | 10.908×4.470×46.383 | 4×10×1 | 0.80 | 3.49 |
| W | ∑5(210) | 120 | 6.311×7.053×55.822 | 9×8×1 | 2.68,2.65[18] | 3.77 |
| Ti | ∑3(10-11) | 60 | 5.283×5.752×44.872 | 7×7×1 | 0.08,0.08[11] | 0.59 |
| Ti | ∑3(10-12) | 76 | 6.719×5.895×41.125 | 6×7×1 | 0.39,0.31[11] | 0.71 |
Results
Based on the simulation results, the following conclusions could be drawn:
1) The energy density is derived from the crack surface energy; low-energy crack surfaces have high stability, and GBs are highly resistant to nanocrack healing.
2) At high energies, crack surfaces have low stability; however, atoms on crack surfaces have a high diffusion drive, and their diffusion is accelerated by high temperatures.
3) Crack surface stability is influenced by the energy and strength of the bonds between the atoms on the crack surface. For example, low-energy and strongly bonded GB cracks are stable but are unlikely to heal.
4) The developed model for high-temperature GB migration is accurate and well-suited for describing the target service environment.
Relationship between crack width and energy
Crack healing, modulated by localized stress and GB migration, challenges the fundamental theory for structural material lifetime evaluation. A nanocrack structural evolution simulation from sprouting to expansion to fracture was established within coherent lattices with ∑3 and ∑5 GBs, and the stabilization and healing of nanocrack structures were simulated at 0, 293, and 373 K. Figure 4 shows the results for 0 K. We applied tensile stress in the z-direction (i.e., at the vertical GB) to induce GB separation and calculated the effect of the GB crack width d on the energy density and crack surface adsorption using Eqs. (1) and (3) (Figs. 4(a) and (b)).
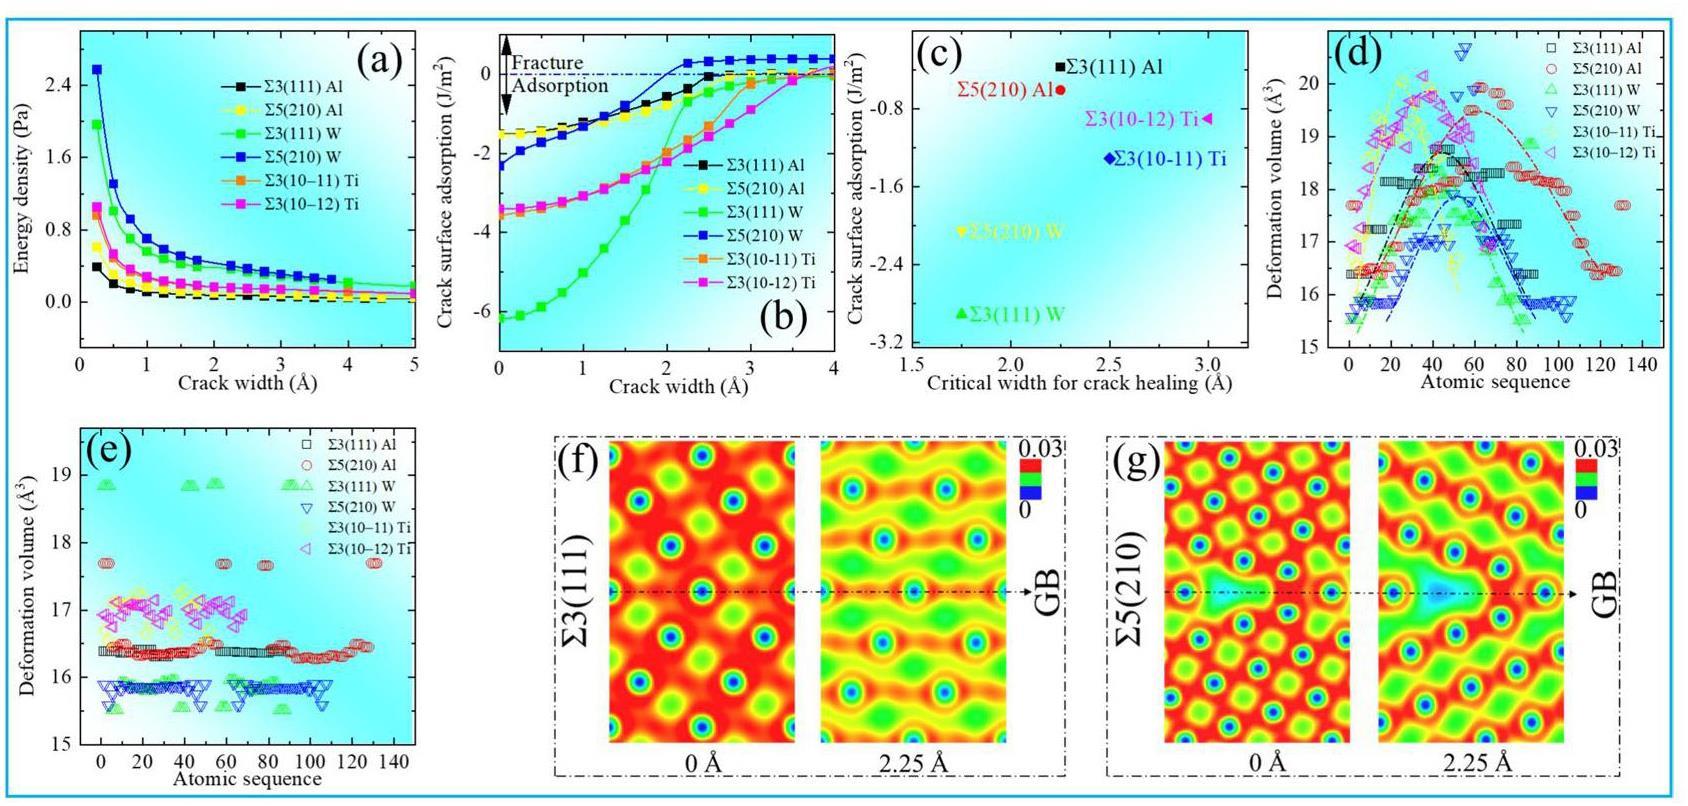
As shown in Fig. 4(a), low energy density is associated with high stability in the GB cracking system. The energy density was derived from the crack surface energy using Eq. (3) and is directly proportional to 1/d. The energy density order at 0 K is as follows: ∑5(210) W (highest energy, lowest stability) > ∑3(111) W > ∑3(10-12) Ti ≈ ∑3(10-11) Ti > ∑5(210) Al > ∑3(111) Al (lowest energy, highest stability). For d < 1 Å, the GB energy density is high; however, when it is between 4 and 5 Å, the energy density approaches 0 Pa, indicating that the GB has completely fractured and separated into two free cracked surfaces. In Fig. 4(b), the negative and positive crack surface adsorption indicates mutual attraction and no attraction, respectively, between GB cracks. The surface adsorption of ∑3(111) W is maximized at d < 2 Å. The adsorption energies of the Ti (10-11) and (10-12) GBs are similar, and that of Al ∑5(210) is slightly higher than that of Al ∑3(111), indicating that W ∑3(111) exhibits the highest resistance to GB crack widening. Figures 4(a) and 4(b) reveal that crack sprouting is inhibited at GBs with high energy densities, and that GB fracturing is accelerated at GBs with low energy densities. The presence of a GB crack with width d < dCritical indicates GB healing. Figure 4(c) shows the relationship between dCritical and crack surface adsorption. When d > dCritical, the interaction between GB cracks vanishes and the GB fractures. Crack extension originates from the accumulation of minor interatomic strains. We quantified these strains in terms of the atomic deformation volume, also known as the Voronoi volume [11].
Figure 4(d) shows the atomic deformation volume on a GB at d = dCritical, revealing a parabolic feature with increasing atomic order. After crack healing, the atomic deformation volume at the GB approached the vertex of the parabola. Figure 4(e) shows the atomic deformation volume after complete cracking, revealing that the deformation volume is stable. Figures 4(f) and 4(g) show the Al charge densities at d =0 Å and dCritical = 2.25 Å. After crack healing, the charge density of ∑3(111) Al is lower than that of ∑5(210) Al, indicating an increase in the interatomic bonding of ∑5(210) Al after healing.
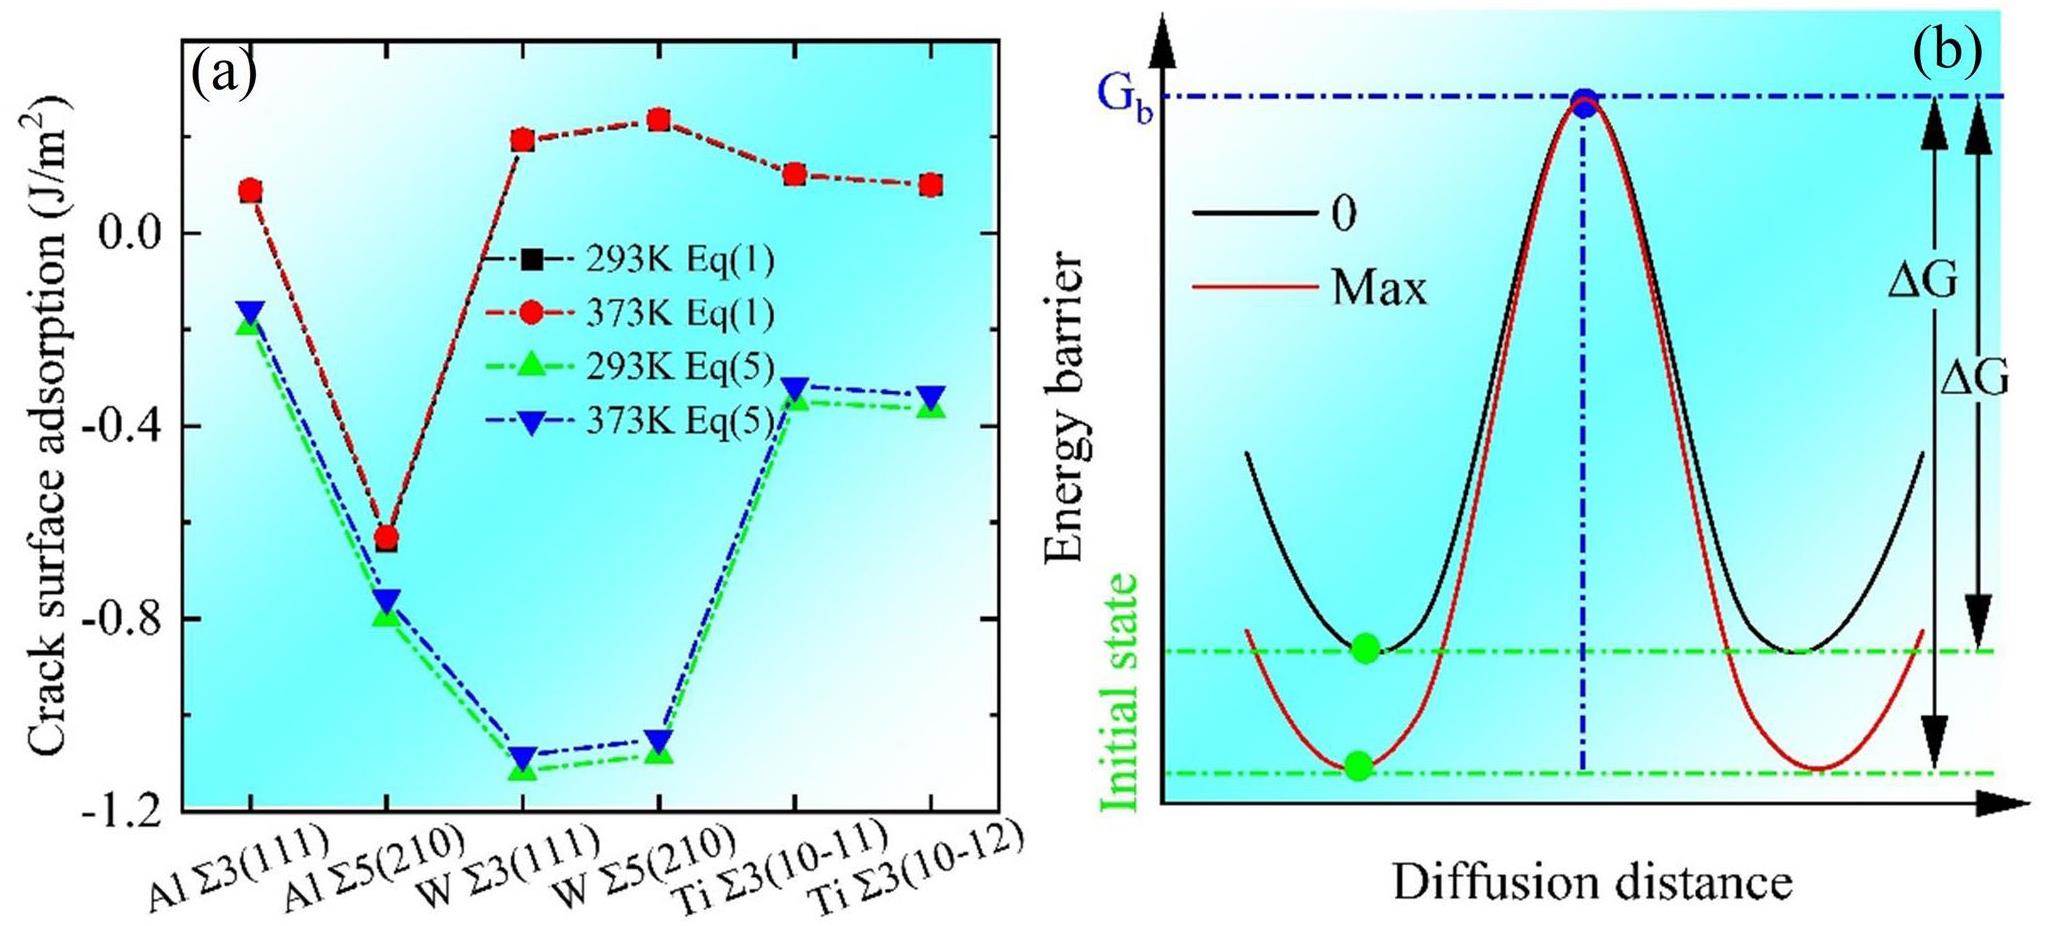
At 0K, microcrack healing does not occur after GB fracturing [6]. Therefore, we performed simulations at room temperature (293 K) and the destressed annealing temperature (373 K) to evaluate the non-mechanical healing of nanocracks and microcracks after complete GB fracturing (Figs. 5(a) and (b)). Figures 5(c) and (d) reveal the stability of the GB structure and crack surface energy, as calculated using Eq. (1) for 293 and 373 K. As shown in Fig. 5(c), ∑5(210) Al has the lowest crack surface attraction at both temperatures, suggesting that ∑5(210) Al cracks are stable and cannot be healed. However, the positive crack surface adsorption of W, Ti, and ∑3(111) Al reveals that the temperature presumably results in atomic diffusion at the crack surface, promoting crack healing.
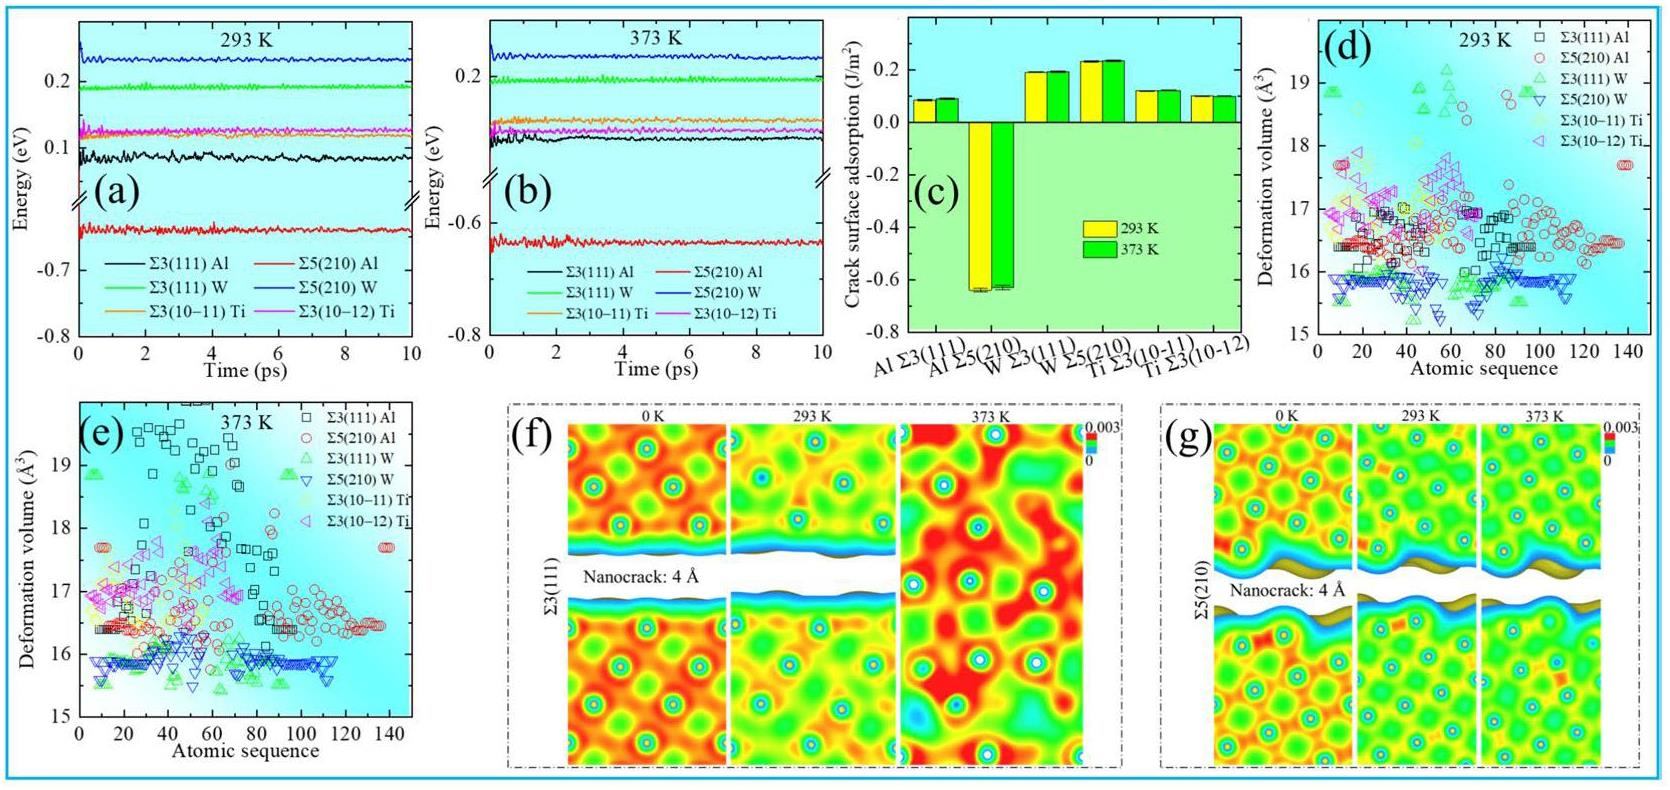
Figures 5(d) and (e) show the atomic deformation volumes at 293 and 373 K, respectively; the temperature and atomic volume density are positively correlated. Figures 5(f) and (g) present the charge densities of Al at 0, 293, and 373 K at dCritical. As shown in Fig. 5(f), although crack healing is not promoted at 0 or 293 K, GB cracks disappear at 373 K; this crack healing is attributed to atomic diffusion. The high temperature (373 K) prevented the formation of an amorphous crack structure. At 0, 293, and 373 K, the cracks in W and Ti did not heal.
We calculated the energy fluctuations and charge density differences between W and Ti at 573 and 1203 K (Fig. 6) according to the experimental results presented in Table 2. The charge-transfer behavior of Al at 293 and 373 K is also shown in Fig. 6. The charge density difference (Δρ) is calculated as follows:

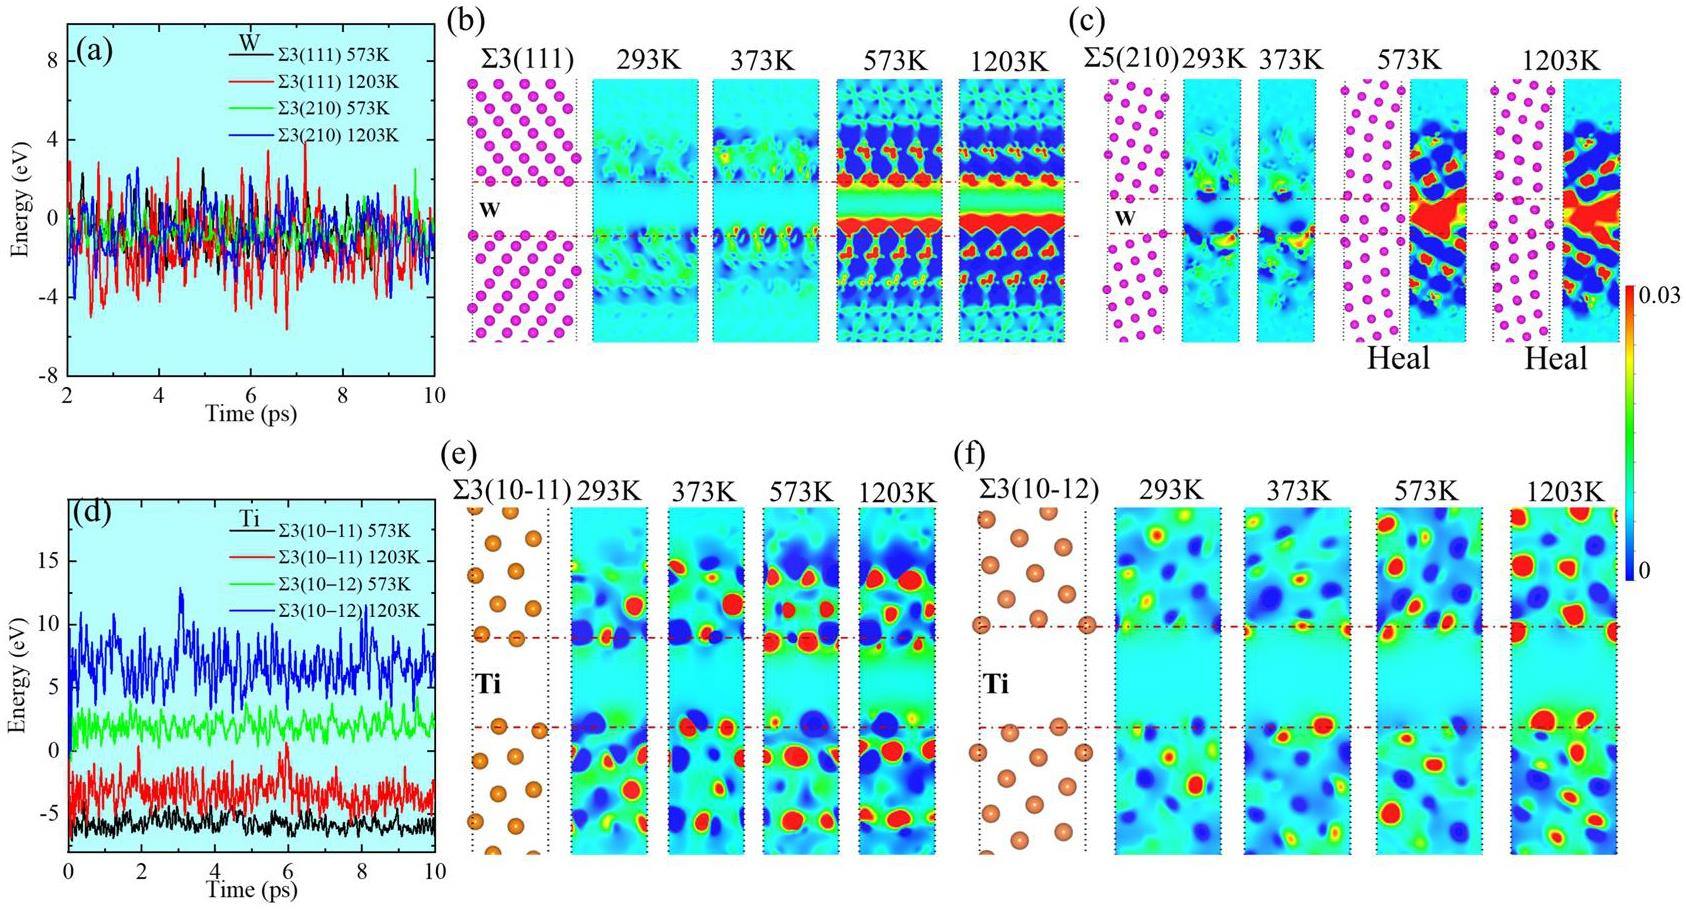
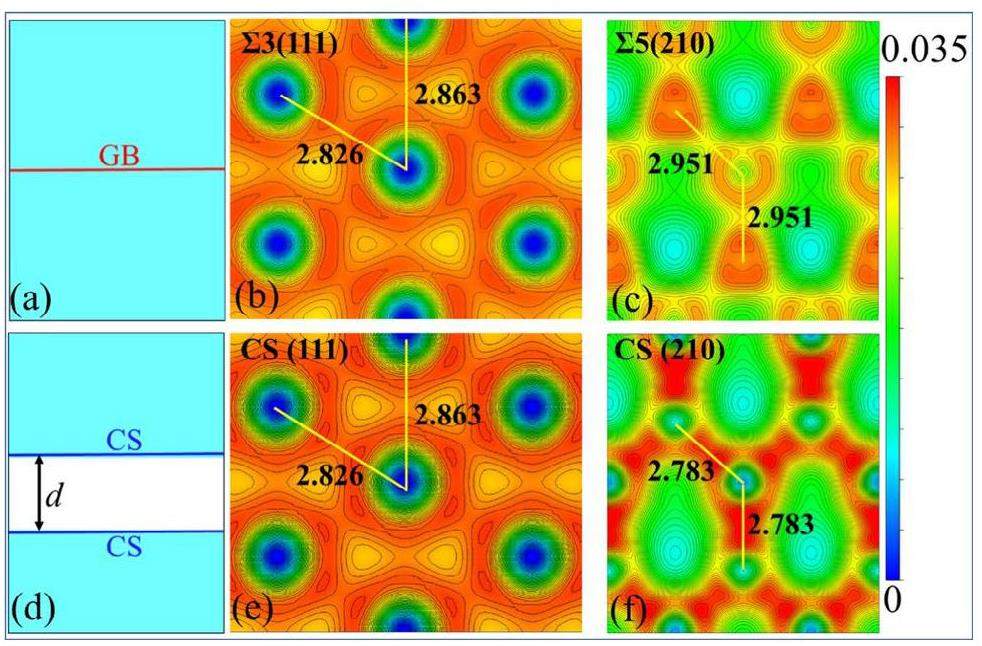
Figure 8 shows the charge densities of Al alloys with intact GBs (top) and crack structures (bottom), which are depicted in Figs. 8(a) and 8(d), respectively. For the non-cracked alloys, the charge density of ∑3(111) Al (Fig. 8(b)) was higher than that of ∑5(210) Al (Fig. 8(e)); their interatomic bond lengths are 2.826 and 2.863, respectively. However, for cracked structures, the charge density of CS (210) Al (Fig. 8(c)) was lower than that of CS (111) Al (Fig. 8(f)); after cracking; the bond length of (111) Al is unchanged, whereas that of (210) Al has contracted to 2.951 Å. This implies that CS (210) Al has a greater bond strength than CS (111) Al. Therefore, crack healing is determined by both the crack adsorption energy and bonding, and crack surfaces with low energy and weak bonding exhibit superior crack healing.
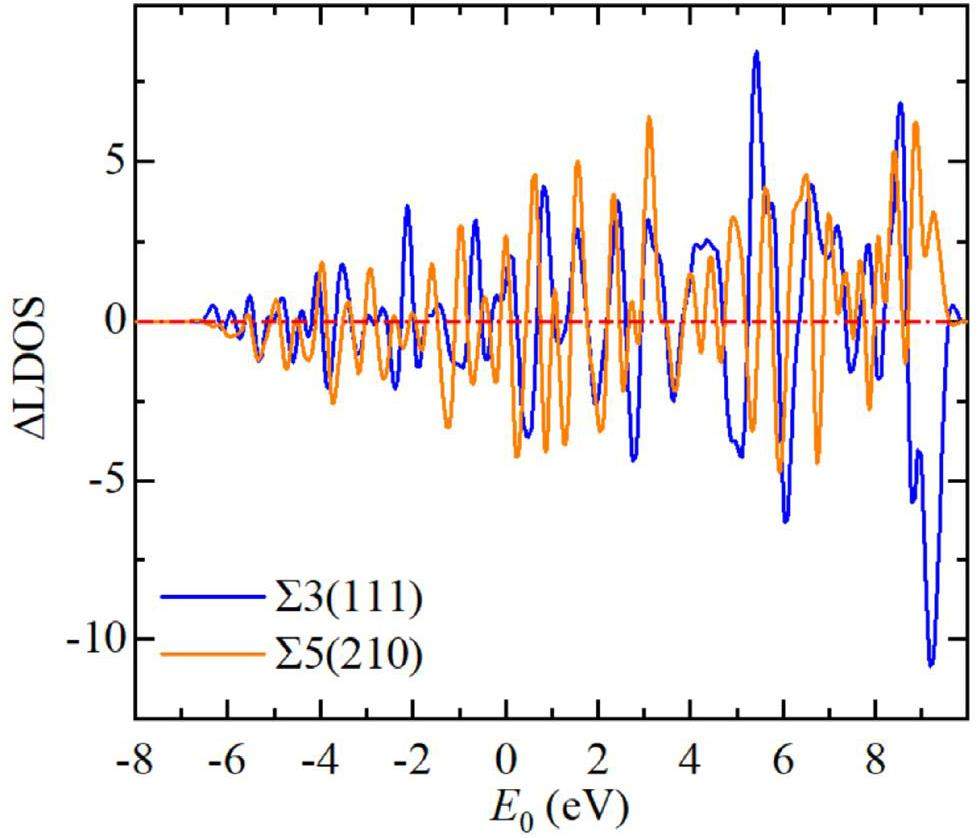
The bonding or antibonding state of the crack structure as a whole can be considered in terms of the normalized localized density of states (LDOS), which is calculated as follows:
Qualitative analysis of high-temperature cracked surfaces
At high temperatures, any surface disorder can be assumed to occur at the beginning of surface melting [19-21]. The healing behavior of GB nanocracks is closely linked to
High-temperature crack extension modeling
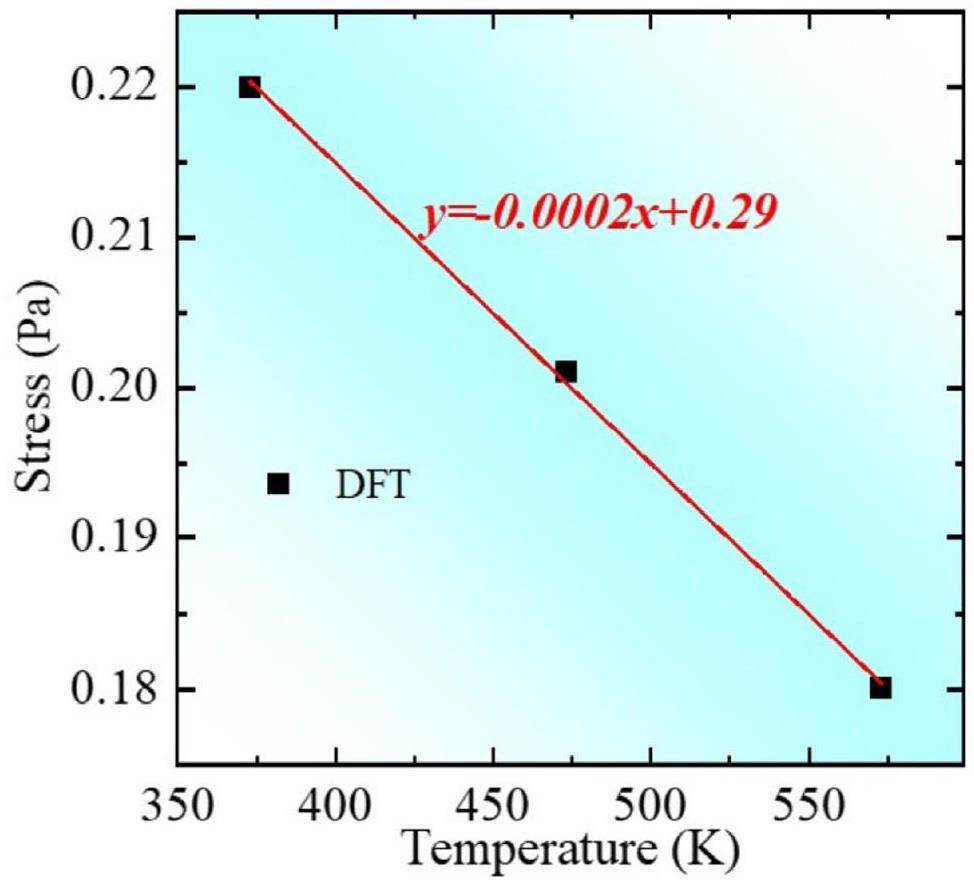
Crack healing is closely associated with GB migration. Under tensile loading, the spacing between crack surfaces increases, resulting in nanocrack growth. According to thermodynamic strength theory [24-28], a nanocrack separates into two free surfaces when the external work done by the loading surpasses the interaction energy between the nanocrack surfaces:
Discussion
Al (FCC), W (BCC), and Ti (HCP), among other metals, are subjected to high temperatures and stresses in nuclear reactors, and GB cracking is a common failure mode [29-34]. After GB separation, the GB cracking energy determines the stability and healing ability of the cracks [10]. In their latest research, Barr et al. [6] observed weak-fatigue crack initiation and extension in a 40-nm Pt foil; crack healing occurred at approximately 664,000 cycles, and substantial microstructural evolution accompanied crack healing, including the migration of twin GBs. Additionally, GB migration and crack healing occurred near room temperature, and fatigue cracks in pure metals self-healed at room temperature. They reported that the attraction between the two cracked surfaces was related to the self-healing of the cracks, which is consistent with our results. According to a report by Belytschko et al. [35], the non-linear strain that occurs in the yield and maximum-strength regions owing to bond breakage leads to stress reduction, whereas the formation of new bonds as the deformation process progresses leads to an increase in stress.
Currently, macroscopic mechanical models focus on the failure behavior of grains and GBs at room temperature. A quantitative relationship among the yield strength, modulus of elasticity, Poisson's ratio, and temperature was previously established to predict the yield strength at different temperatures and strain rates [36]. Li et al. developed a temperature-dependent yield strength model for metallic materials based on the equivalence between thermal energy and distortion strain energy [37]. The advantages of their model were its generality and ability to easily predict the temperature-dependent yield strength at arbitrary temperatures. However, the model uses macroscopic quantities to simulate the quantitative relationship between yield strength and temperature for certain metallic materials; it does not consider microscopic quantities.
In mechanical modeling, nanocracks are commonly considered as structural damage, and the effective properties of a material are determined via the damage mechanics approach [38]. The incorporation of temperature into the damage model is essential for evaluating its influence on the mechanical properties of materials, thereby establishing a thermomechanical damage constitutive model [39-46]. However, the damage mechanics approach requires the introduction of many fitting parameters, the physical meaning of which remains unclear. Determining the physical meaning of these parameters is a worthy research endeavor. In Section C, we outline a thermodynamic method for calculating the separation stress of nanocracks. The present density functional theory results confirm the effectiveness of this method. According to Eq. (11), the temperature dependence of the strength of materials containing crack damage is determined by the interaction energy between the cracks and the tensile rate. Accordingly, the results of this study provide atomic-scale support for the development of a rate-dependent thermomechanical model for nuclear reactor materials.
Conclusion
The healing behavior of nanocracks was demonstrated in a previous study. However, nanocrack recovery and healing on an atomic or electronic scale, and the energies affecting this healing behavior have not been described. Therefore, we selected GBs in alloys with FCC, BCC, and HCP structures and simulated the separation of the GBs into crack surfaces to investigate the adsorption behavior of the crack surfaces and the healing behavior after complete GB fracture. Based on the results, the main conclusions of this study can be summarized as follows:
(1) Microcrack healing is closely related to the crack surface energy. Ordered and disordered atom arrangements on the surface result in stable and unstable crack surfaces, respectively. Adsorption on a nanocrack surface determines the critical width of nanocracks.
(2) The adsorption force on a cracked surface is positively correlated with the GB strength (stress), and the adsorption force on the cracked surface is zero at 0 K once the GB has separated (i.e., complete fracture); that is, no interaction remains between the crack surfaces. However, high temperature drives atomic diffusion on the crack surface, and the GB cracks begin to heal. Al ∑3(111) nanocracks heal at high temperatures, and their healing behavior is closely related to the surface energy.
(3) Relying on the global non-equilibrium energy criterion, a high-temperature model for GB migration was developed in this study, namely, σs(T, d, v). Introducing temperature improves the model for metals in nuclear reactors. It was found that temperature is negatively correlated with stress, and the slopes of the temperature–stress relationship curves were consistent with the predicted values.
Stress corrosion cracking resistant nanostructured Al-Mg alloy with low angle grain boundaries
. Acta. Mater. 225,Microstructural effects on short fatigue crack propagation in cast Al-Si alloys
. Inter. J. Fatigue. 175,Unveiling the intrinsic rhenium effect in Tungsten
. Acta. Mater. 264,Crack suppression via in-situ oxidation in additively manufactured W-Ta alloy
. Mater. Lett. 263,Investigation of the O phase in the Ti-22Al-25Nb alloy during deformation at elevated temperatures: Plastic deformation mechanism and effect on B2 grain boundary embrittlement
. Acta. Mater. 242,Autonomous healing of fatigue cracks via cold welding
. Nature 620, 552-556 (2023). https://doi.org/10.1038/s41586-023-06223-0Helium ion irradiation-induced damage of powder metallurgy-hot isostatic pressed Ni-based alloy GH3535 for molten salt reactor applications
. J. Nucl. Mater. 589,AlMgZnCu hydrogen embrittlement by nanograin boundary decomposition
. Intern. J. Hydrogen Energ. 61, 1142-1156 (2024). https://doi.org/10.1016/j.ijhydene.2024.03.030Self-healing of fractured diamond
. Nat. Mater. 22, 1317-1323 (2023). https://doi.org/10.1038/s41563-023-01656-4Segregation of Mg, Cu and their effects on the strength of Al ∑5 (210)[001] symmetrical tilt grain boundary
. Acta. Mater. 145, 235-246 (2018). https://doi.org/10.1016/j.actamat.2017.12.023First-principles study of de-twinning in a FCC alloy
. J. Solid. State. Chem. 293,Size effects on intergranular crack growth mechanisms in ultrathin nanocrystalline gold free-standing films
. Acta. Mater. 143, 77-87 (2018). https://doi.org/10.1016/j.actamat.2017.10.004The suppression of He bubble growth in Ni-Mo-Cr alloy by yttrium doping: Irradiation experiment combined with the first-principles calculation
. Scripta. Mater. 226,Furthmuller, Efficient iterative schemes for ab initio total-energy calculations using a plane-wave basis set
. Phys. Rev. B 54(16), 11169-11186 (1996). https://doi.org/10.1103/PhysRevB.54.11169Projector augmented-wave method
. Phys. Rev. B 50(24), 17953-17979 (1994). https://doi.org/10.1103/PhysRevB.50.17953Atoms, molecules, solids, and surfaces: Applications of the generalized gradient approximation for exchange and correlation
. Phys. Rev. B 46, 6671-6687 (1992). https://doi.org/10.1103/PhysRevB.46.6671The effect of alloying elements on grain boundary and bulk cohesion in aluminum alloys: An ab initio study
. Scripta. Mate. 65, 926-929 (2011). https://doi.org/10.1016/j.scriptamat.2011.08.014Grain boundary properties of elemental metals
. Acta. Mater. 186, 40-49 (2020). https://doi.org/10.1016/j.actamat.2019.12.030Melting and nonmelting of solid surfaces and nanosystems
. Phys. Rep. 411, 291-321 (2005). https://doi.org/10.1016/j.physrep.2005.01.004Melting and superheating of crystalline solids: From bulk to nanocrystals
. Prog. Mater. Sci. 52, 1175-1262 (2007). https://doi.org/10.1016/j.pmatsci.2007.01.001Collective and single particle diffusion on surfaces
. Advances. in. Phys. 51(3), 949-1078 (2002). https://doi.org/10.1080/00018730110107902Molecular dynamics simulation of the role of dislocations in microcrack healing
. Acta. Mech. Sinica. 16, 366-373 (2000). https://doi.org/10.1007/BF02487689Hall-Petch relationship in nanometer size range
. J. Alloys. Comp. 361, 160-164 (2003). https://doi.org/10.1016/S0925-8388(03)00415-8A novel temperature dependent yield strength model for metals considering precipitation strengthening and strain rate
. Comp. Mater. Sci. 129, 147-155 (2017). https://doi.org/10.1016/j.commatsci.2016.12.005Feasibility of a novel shield of nuclear radiation with W-Ni-Fe-Co and La-Bi alloys alternative to Pb and ordinary concrete absorbers
. Prog. Nucl. Energy. 156,Long-term initiation time for stress-corrosion cracking of alloy 600 with implications in stainless steel: Review and analysis for nuclear application
. Prog. Nucl. Energy. 137,Prediction of theoretical strength of diamond under complex loadings
. Extreme Mechanics Letters 44,The intrinsic nature of materials failure and the global non-equilibrium energy criterion
. Sci. China-Phys. Mech. Astron. 63,Elemental segregation inhibits hydrogen embrittlement in aluminium alloys
. Adv. Powder. Mater. 2,The corrosion of AA2037 aluminum alloy in alkaline aqueous solution studied using slow positron beam spectroscopy
. Nucl. Sci. Tech. 27, 30 (2016). https://doi.org/10.1007/s41365-016-0027-4Effects of impurity elements on SiC grain boundary stability and corrosion
. Nucl. Sci. Tech. 32, 125 (2021). https://doi.org/10.1007/s41365-021-00963-2Hot cracking susceptibility prediction from quantitative multi-phase field simulations with grain boundary effects
. Acta. Mater. 250,Stabilizing nanograined Fe-Cr alloy by Si-assisted grain boundary segregation
. J. Mater. Sci. Tech. 134, 223-233 (2023). https://doi.org/10.1016/j.jmst.2022.06.028Atomistic simulations of nanotube fracture
. Phy. Rev. B 65,Strain hardening and strain rate effect in the impact loading of cantilever beams
. Small, Bus. Econ. 31 (3), 235-263 (1957). https://doi.org/10.21236/ad0144762Theoretical prediction of temperature dependent yield strength for metallic materials
. Inter. J. Mech. Scie. 105, 273-278 (2016). https://doi.org/10.1016/j.ijmecsci.2015.11.017Mechanical modeling of material damage
. J. Appl. Mech. 55(2), 280-286 (1988). https://doi.org/10.1115/1.3173673Creep damage characterization of UNS N10003 alloy based on a numerical simulation using the Norton creep law and Kachanov-Rabotnov creep damage model
. Nucl. Sci. Tech. 30(4), 65 (2019). https://doi.org/10.1007/s41365-019-0586-2Effect of radiolysis of TODGA on the extraction of TODGA/n-dodecane toward Eu(III): An experimental and DFT study
. Nucl. Sci. Tech. 34, 48 (2023). https://doi.org/10.1007/s41365-023-01198-zSimulation of the effects of different substrates, temperature, and substrate roughness on the mechanical properties of Al2O3 coating as tritium penetration barrier
. Nucl. Sci. Tech. 30, 62 (2019). https://doi.org/10.1007/s41365-019-0587-1Numerical investigation on the startup performance of high-temperature heat pipes for heat pipe cooled reactor application
. Nucl. Sci. Tech. 32, 104 (2021). https://doi.org/10.1007/s41365-021-00947-2First-principle studies of radioactive fission productions Cs/Sr/Ag/I adsorption on chrome/molybdenum steel in Chinese 200 MW HTR-PM
. Nucl. Sci. Tech. 28, 79 (2017). https://doi.org/10.1007/s41365-017-0241-8Numerical and theoretical investigations of heat transfer characteristics in helium-xenon cooled microreactor core
. Nucl. Sci. Tech. 34(11), 162 (2023). https://doi.org/10.1007/s41365-023-01311-2Thermo-mechanic model for concrete exposed to elevated temperatures
. Eng. Stru. 25(6), 729-742 (2003). https://doi.org/10.1016/S0141-0296(02)00209-2Influence of He ion irradiation on the microstructure and hardness of Ni–TiCNP composites
. Nucl. Sci. Tech. 32, 121 (2021). https://doi.org/10.1007/s41365-021-00961-4The authors declare that they have no competing interests.


