Introduction
Nuclear power is one of the most promising ways to efficiently produce hydrogen on a large scale without emitting carbon dioxide. As the main fuel source for nuclear power generation, uranium ore is crucial to the development of the nuclear power industry [1]. Since the 21st century, countries worldwide have put forward actions to search for minerals and develop technological equipment for the intelligent exploration and development of minerals to provide scientific and technological support for energy conservation and emissions reductions.
Logging is an effective method for uranium exploration. The gamma (total) logging method originated in the field of petroleum logging in the 1930s and was applied to uranium logging development in the 1960s [2-6]. Gamma logging belongs to the technique of "indirect uranium measurement" [7, 8], which detects gamma rays in drill holes to determine the activity of radium/radon daughters (nuclides), and then deduces the uranium content of the stratum according to the relationship of activity equivalence. When the mineralization environment and geological conditions change, the activity equivalence relationship is destroyed, the decay equilibrium relationship between uranium and radium/radon is broken, and the uranium content interpreted by logging deviates. Therefore, the industry standard for China's uranium mine gamma logging requires that no fewer than 30% of the samples taken from drill holes must be analyzed. The equilibrium relationship between uranium, radium, and radon should be examined accordingly, and the deviation of the uranium content interpretation should be corrected [9-11]. Therefore, uranium exploration in China is mainly realized via core chemical analyses combined with natural gamma logging technology. Natural gamma logging is simple in principle, but the accuracy of its quantitative interpretation is easily affected by the uranium–radium balance, radon radio gas, and thorium–potassium interference. This makes it difficult to satisfy the existing demand for uranium exploration, which causes shortcomings including high cost, low efficiency, and large errors in the quantification of uranium resources in the long term [12-14]. Therefore, there is an urgent need for a new theory, technology, and method of nuclear logging with high precision that can realize direct uranium measurement and downhole quantification of the uranium content in a formation.
In 1966, Allen and Tittle proposed a novel uranium logging technique called fission neutron logging. To elucidate the principle of the fission neutron uranium logging technique, single-velocity neutron diffusion equations simulating the geometry of a cylindrical borehole were solved, and a computer program was completed to address the entire analytical numerical problem [15, 16]. In 1972, Czubek analyzed the epithermal neutron time distribution, thermal neutron time distribution of 235U slow fission, and fast neutron time distribution of 238U slow fission, based on the epithermal neutron time distribution produced by 235U prompt fission. When the background was almost zero, the stratigraphic epithermal neutron count rate was proportional to the uranium grade. A point-like pulsed neutron source in a uniform uranium-bearing sphere ore formation was modeled, and the formula for the response of the neutron detector to the epithermal neutron count rate was calculated, thus creating the basis of the methodology for the prompt neutron logging of uranium fission [17]. Renken (1976) found significant variability between the epithermal neutron fluxes produced in formations with and without uranium and concluded that a logging method based on the time decay of epithermal neutrons has great potential. Simulations were performed for different uranium concentrations, and the results showed that the thermal neutron flux was independent of the uranium concentration. The Monte Carlo program TIMEX was applied in 1977 to simulate the signal contribution of the strata around the uranium fission prompt neutron logger to its epithermal neutron (0.414-454 eV) detector. The results showed that uranium ore at 0.3-0.5 m significantly contributed to the detector-received signal [18, 19]. Allen, Tittle, Czubek, Renken, and others provided a theoretical basis for the development of subsequent pulsed neutron uranium logging.
Since the 1970s, uranium logging methods based on pulsed neutron technology that can directly measure uranium (235U) content without core sampling or interference from gamma rays of other radionuclides, such as thorium and potassium, have been the subjects of studies and experiments in which neutron logging technology was used for direct uranium measurement in the United States, Canada, Germany, and the former Soviet Union [20, 21]. All these are considered effective methods for uranium quantification through the collection of neutron time spectra. However, it is necessary to utilize neutron sources with ultrashort pulse widths and high yields, such as the pulsed neutron uranium logging system device ANHK-60 [22] developed by the All-Russian Research Institute of Automation (VNIIA) in Russia, which employs a D-T neutron generator with a pulse width of 1 μs and a single-pulse neutron yield of approximately 10 7 n/s; however, the lifetime of the generator is only 150 h.
Therefore, the stability and lifetime of the neutron source are key factors affecting the accuracy of uranium quantification, such as the change or fluctuation of the neutron flux in the neutron tube, which has a direct impact on the logging results [23]. Currently, the main approaches to improve the performance of neutron tubing are to use new materials, optimize the design to improve the lifetime, and use advanced control systems and feedback mechanisms in the logging instrument to stabilize the source neutron flux and reduce fluctuations through scale and automatic adjustments [24-26]. For example, Weibo Liu, Wen-Ting Guo, and other scholars improved the yield stability by optimizing both the pulse power supply of the neutron tube ion source and the target film preparation [27, 28]. Xiang-quan Chen and others improved the neutron yield stability by integrating the Kalman filter with the PID algorithm into the PLC [29]. The neutron yield of the generator was significantly stabilized at 1×10⁸ n/s, and the relative standard deviation of the neutron yield during use was 0.82%. However, these neutron yield control techniques and correction methods have not solved the problem of the influence of the service lives of neutron tubes, which seriously restricts the popularization and application of PFNUL.
In this study, by exploring neutron transport theory, a dual neutron detector with upper and lower detection structures is proposed to realize the time-spectrum detection of epithermal neutrons (E) and thermal neutrons (T). The time window(Δ) is used to extract the effective information of the prompt neutrons produced by the uranium fission reaction, from which the quantitative equation of uranium based on the ratio (E/T) of epithermal and thermal neutrons is derived. The extraction of uranium fission neutron information is determined via simulations and experimental measurements. The E/T values within this time window show a good linear relationship with different uranium contents. Moreover, the uranium quantitative scale factor based on the E/T value is stable under different neutron yield conditions, demonstrating that the present method can eliminate the fluctuation of uranium quantification triggered by the fluctuation of the neutron source intensity, prolong the service lives of neutron tubes, and reduce the cost of using neutron uranium logging, which is of great significance for the popularization of neutron uranium logging [30-33].
Theory of Direct Uranium Measurement Methods for Dual Energy Neutron Ratios
Theory of PFNUL
Figure 1 illustrates the principles of the PFNUL technique. The D-T neutron generator emits fast neutrons (called source neutrons) in a pulsed manner into the downhole formation, and these fast neutrons are slowed by elastic scattering, inelastic scattering, and other nuclear interactions with the formation rock. Fast neutrons are rapidly slowed down to epithermal neutrons (E) (epithermal neutron lifetime ≤t1) and thermal neutrons (T), which stay in the stratum for a long time (≤ 5000 μs) in the form of “thermal motion”, during which they undergo radiative capture, fission, and other nuclear interactions with the nuclei of the material atoms, and are ultimately absorbed by the material (neutron fading). During a single pulsed neutron measurement cycle, the epithermal and thermal neutron time spectra in the formation are collected by an epithermal neutron detector and a thermal neutron detector, respectively, in which the slowed-down thermal neutrons are prone to undergo fission reactions with 235U in the formation and thereby produce 2-3 uranium fission-transient neutrons that prolong the epithermal neutron fading time (
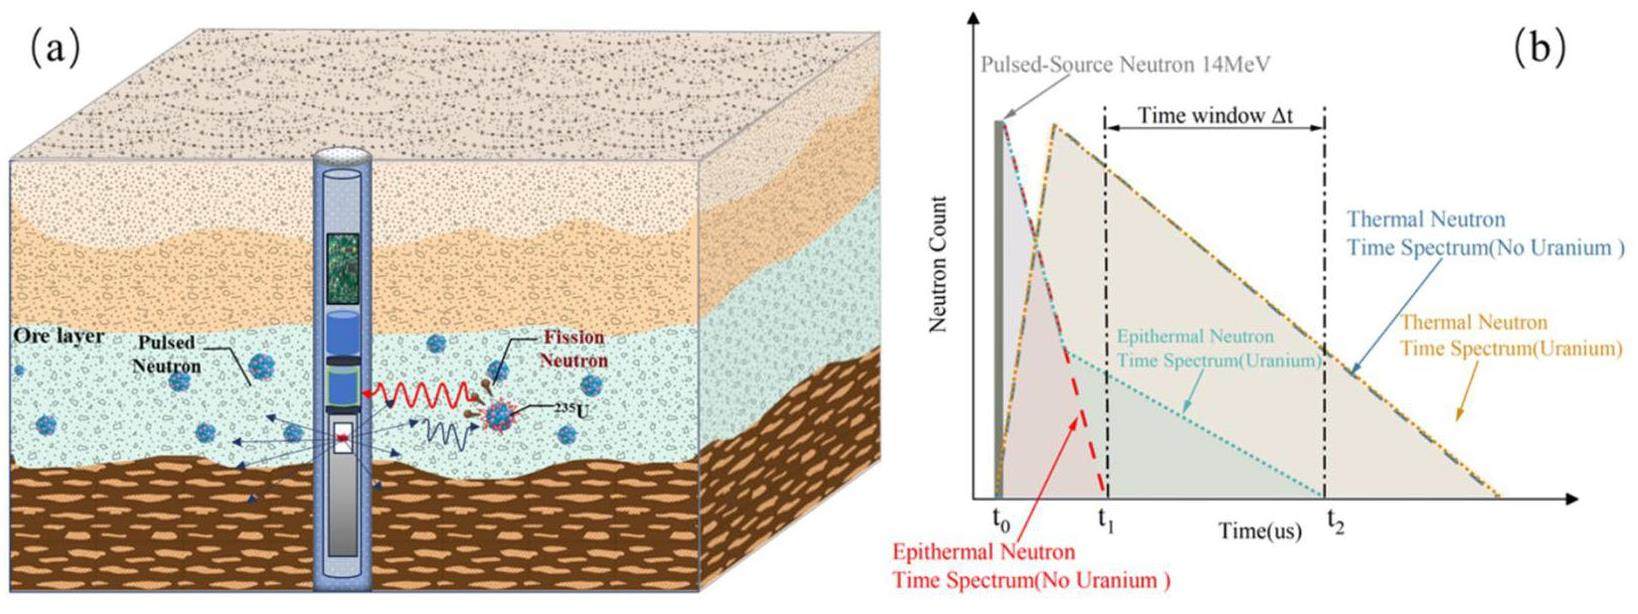
Uranium quantification by epithermal neutrons
In 1972, Czubek proposed a novel direct uranium logging method that utilized a 14 MeV pulsed neutron source to continuously irradiate a uranium-bearing formation and measure the formation fission neutron time distribution at the end of the source neutron pulse [17]. Czubek theoretically demonstrated the feasibility of determining the uranium content by measuring the prompt fission epithermal neutron time spectrum resulting from the fission of the formation 235U thermal neutron nucleus. Based on the energy, time, and space distributions of neutrons in the medium under isotropic pulsed neutron point source conditions, Czubek obtained the formula for the count rate of epithermal fission neutrons within the measurement time window by using an epithermal neutron detector record and derived that for an epithermal neutron detector with a determined performance, the epithermal neutron counts of the detector are only related to the source neutron yield Q when the parameters such as the measurement timing of the logging system, formation uranium content qu, formation density ρ, and formation neutron characteristic function
Uranium quantification of the epithermal neutron–thermal neutron ratio (E/T)
The epithermal fission neutron counting model proposed by Czubek in 1972 is an absolute method of uranium content quantification that requires compensatory measurements of parameters, including the source neutron yield (Q), formation density (ρ), and macroscopic thermal neutron absorption cross-section (∑a). In 1978, Givens et al. proposed a relative uranium content measurement method in which a thermal neutron detector was added to the logging equipment to measure the formation thermal neutron time spectrum. The uranium content was quantified by measuring the ratio of the uranium fission neutron counts to the thermal neutron counts of the formation [34]. The epithermal fission neutron counts versus thermal neutron counts (Ther.Count) contributed by the 235U thermal neutron nuclear fission reaction within the detector measurement timeframe are given by Eq. (2):
The
If a logging probe measures the double neutron time spectra of nE(t) and nT(t) at a certain measurement point along the well axis, then the epithermal neutron attenuation at Δt is NE(Δt), the thermal neutron attenuation is NT(Δt), and the ratio of the two attenuations is called the "Epithermal/Thermal" (E/T) ratio value. The detected epithermal neutron attenuation NE(Δt) and thermal neutron attenuation NT(Δt) come from the upper and lower structural distributions of 3He orthotropic technology tubes, respectively.
In the above equation, KE/T is considered the known variable, E/T(Δt) is the measured variable, and qu is the variable to be solved. For this reason, it is necessary to construct accurate uranium model wells that are similar to field wells in terms of lithological structure, material composition, and medium in the wells and then use the PFNUL instrument to scale the model wells with known uranium contents to determine the derived KE/T, carry out actual field logging, and then substitute it into Eq. (6) to determine the uranium content of the field wells qu. Therefore, determining the dimensional parameters of the uranium model wells is also important in this study.
In Eqs. (6), E/T(Δt) is added to the epithermal neutrons, thermal neutrons, and fading time correction, which are attributable to the negative exponential decay law of epithermal neutrons and thermal neutrons, respectively, as well as the decay time spectrum of negative exponential fitting in finding the value of τE,τT. Because the values of τE and τT in a homogeneous medium are relatively stable, the fading time correction coefficient can also be set to the value of KE/T. Moreover, when the t2 value is large, the count rate of the tail of the epithermal neutron time spectrum has a large statistical rise and fall (which may also include the uranium fission delayed neutrons), when the frequency of the pulsed neutron emission reaches or exceeds 1000 Hz, then it must be ≤ 1000 μs. Therefore, it is recommended that the value of Δt be set between 600 and 1000 μs.
The advantages of this method lie in the following: extracting the secondary neutron extinction law from the epithermal neutron time spectrum and the primary neutron slowing law from the thermal neutron time spectrum to select the appropriate time window parameters, define the "Epithermal/Thermal" ratio based on the two-neutron time spectrum, and construct a real-time algorithm for uranium ore quantification. Thus, the "direct uranium measurement" and quantification via the prompt neutron logging of uranium fission was realized.
Theoretical validation of the proposed method
Time windows (Δt)
In this study, the Monte Carlo method was used to establish a model of a PFNUL instrument with a ratio of epithermal neutrons to thermal neutrons and a model of cylindrical saturated uranium ore with reference to the actual model [36-38], as shown in Fig. 2(a). Among them, the outer diameter of the probe tube was 5.5 cm, and the length of the probe tube was 284 cm. The pulsed neutron source was a 14 MeV D-T pulsed neutron source with a pulse width of 10 μs, and the two 3He detectors were distributed in an upper and lower structure, with the upper 3He detector wrapped with 1 mm cadmium and 4 mm polyethylene for epithermal neutron (energy range of 0.7-1000 eV) time-spectrum acquisition and the lower 3He detector. The neutron source and center of the epithermal neutron detector had a source distance of 15.15 cm, and the neutron source and center of the thermal neutron detector had a source distance of 43.7 cm. The uranium content of the stratum was set to be 0%, 0.0280%, 0.0684%, and 0.0982%, respectively, and the results of the simulated time spectrum are shown in Fig. 2(b).
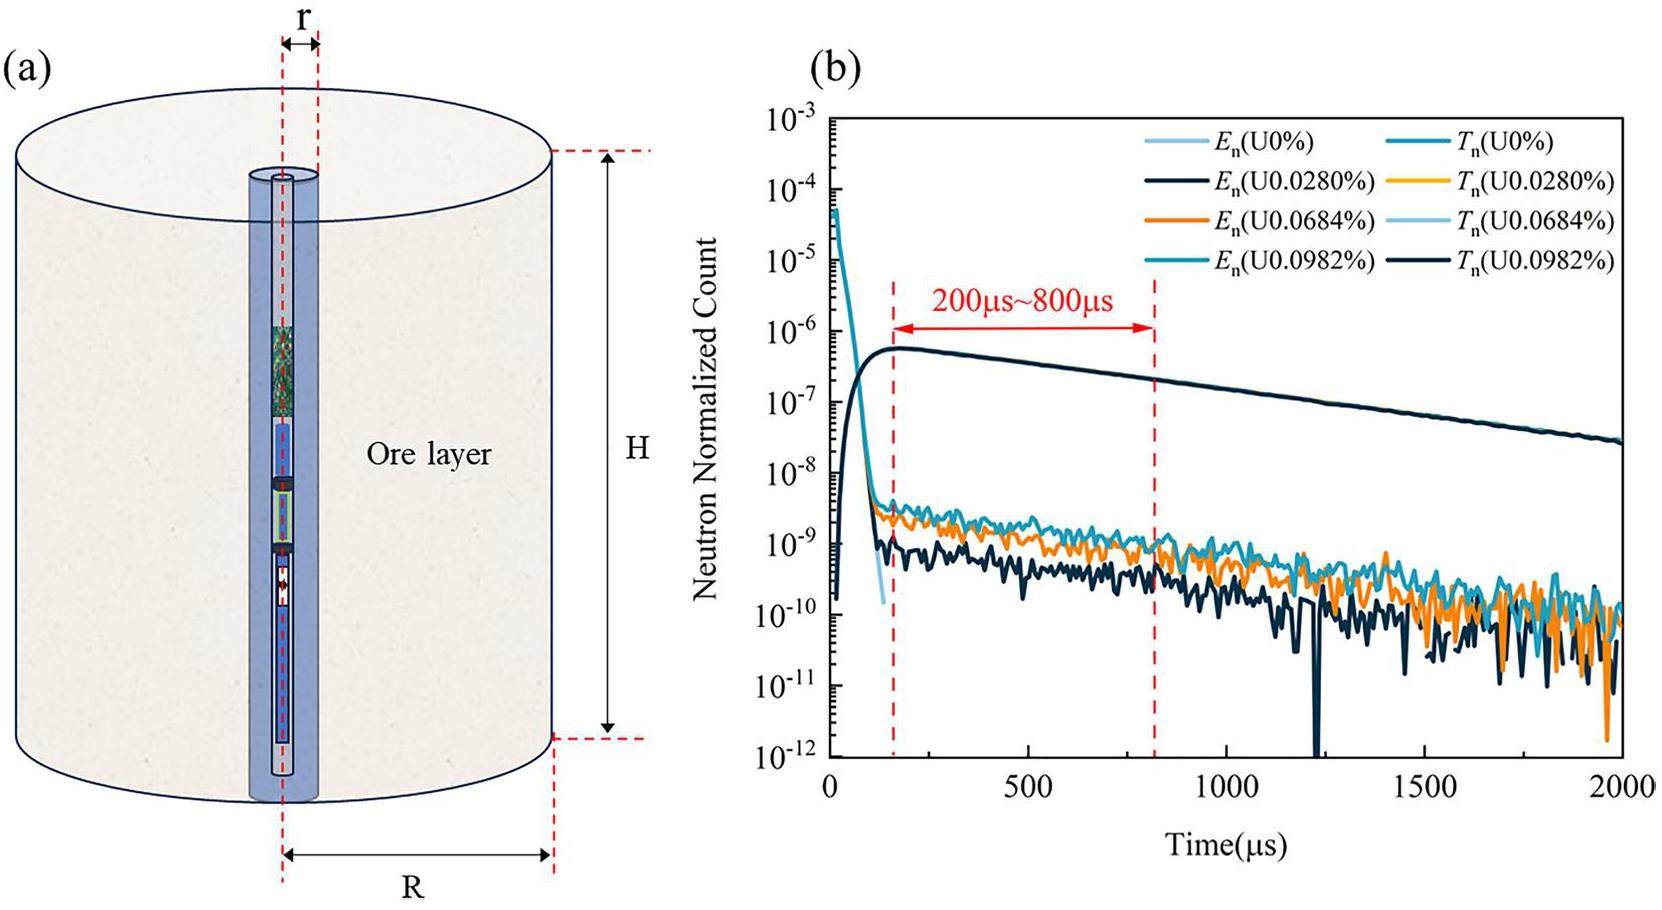
Figure 2(b) shows that the thermal neutron time spectra are the same in both the uranium-bearing and non-uranium-bearing layers. This means that regardless of whether the ore layer contains uranium, as long as the formation rocks, drilling conditions, and other factors remain unchanged, the difference in the macroscopic absorption cross-section of the thermal neutrons is small (almost the same). At any time (
Standard model wells
The ideal standard model well size should be as large as possible, beyond the effective detection range. Therefore, the determination of the appropriate height (H in Fig. 2(a)) and radius (R in Fig. 2(a)) of the standard model is important. Using the Monte Carlo method, based on the aforementioned neutron logger model, the size of the mineral layer model gradually increases with the detector performance, source term, and formation medium unchanged. Moreover, the appropriate height and diameter of the standard model well are determined according to the variation of the E/T ratio. Figure 2(a) shows the model. Considering that the neutron counts measured by the uranium fission neutron logger are affected by the uranium content of the formation and the size of the borehole radius r, we set the uranium content of the formation to be 0.0280%, 0.0684%, and 0.0982% and the radius of the borehole to be 3, 7, 11, and 16.5 cm, respectively. Then, we change the model height and simulate the uranium fission neutron logging E/T ratio counts using the Monte Carlo software. The height of the saturated uranium model is determined based on the stability of the E/T ratio. Under the same conditions, the radius of the model was changed, and Monte Carlo software was used to simulate the E/T ratio counts. The radius of the saturated uranium logging model was determined according to the stability of the E/T ratio. Figure 3 shows the simulation results.
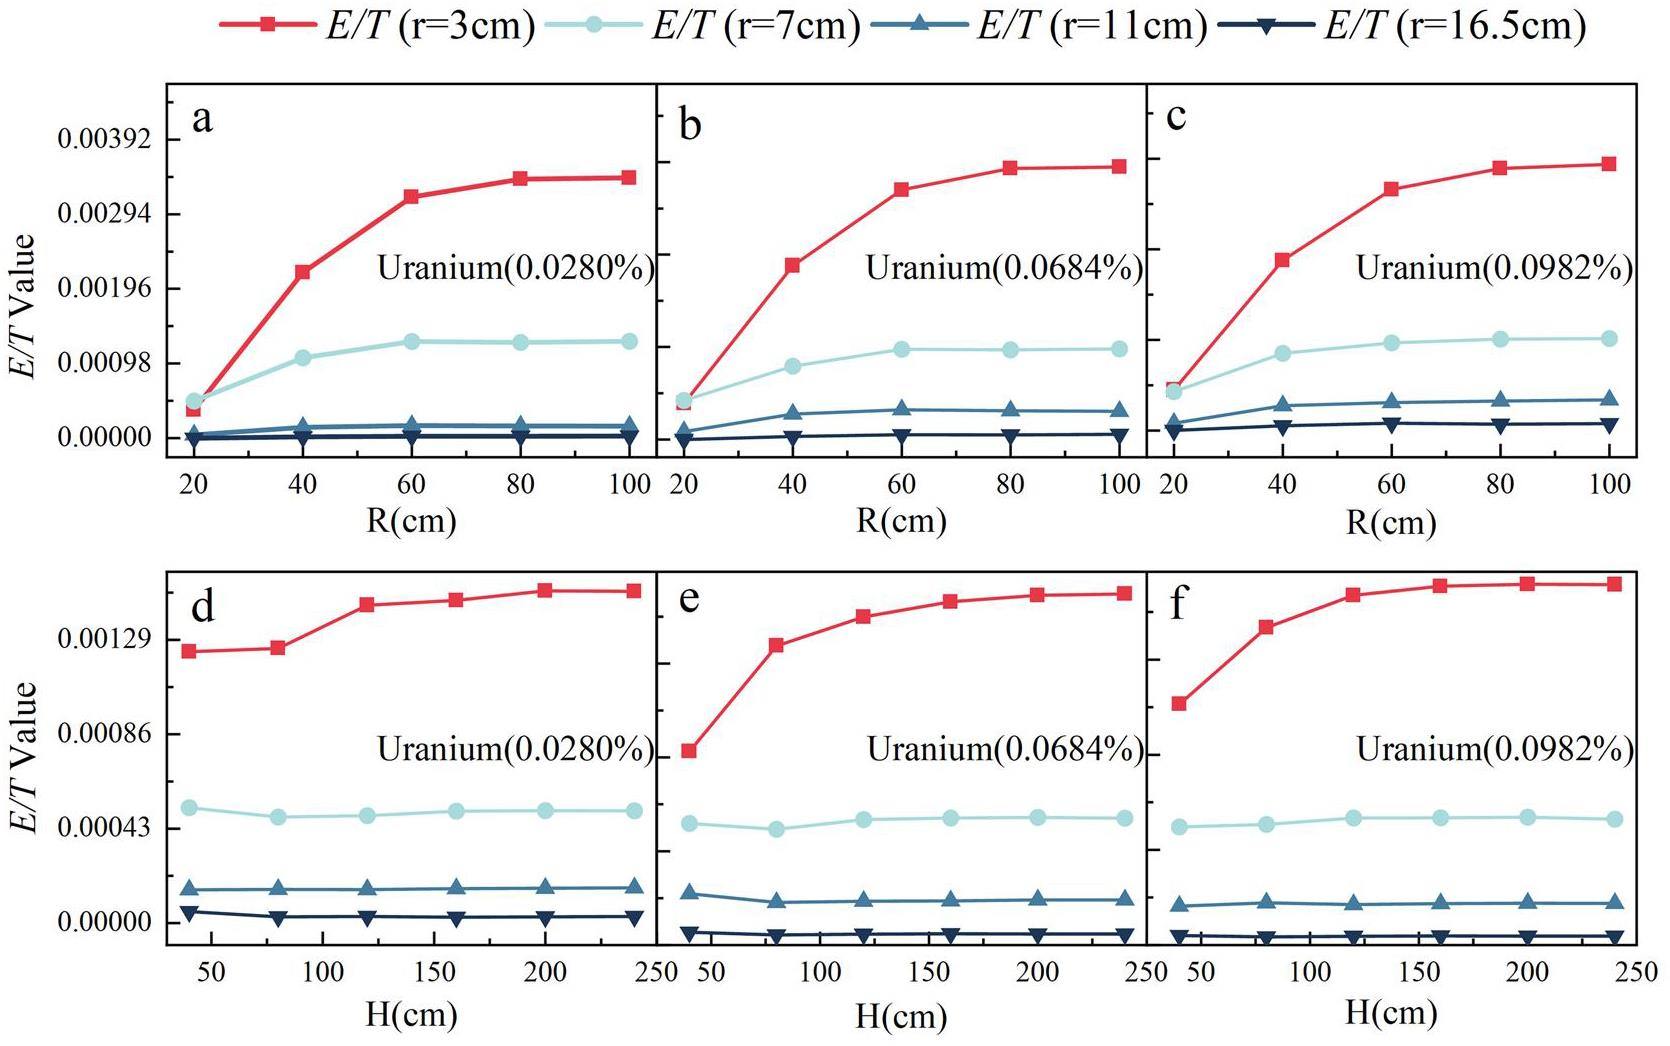
Figures 3(a–c) show the changes in the E/T value with the model height. The results show that the E/T ratio detected by the uranium fission transient neutron logger increases with an increase in the logging model radius R. However, after the model radius reaches a certain value, the E/T ratio does not change significantly with a further increase in the model height. In addition, with a smaller the borehole radius r, changes of the model radius R will lead to more drastic changes of the E/T ratio. The changes in the E/T value are relatively insignificant with changes in the model height when the borehole radius exceeds 7 cm. Thus, the simulation results show that for the radius R of the saturated ore layer, R ≥ 60 cm.
The changes in the E/T value with respect to the model radius are shown in Fig. 3(d–f). The results show that with an increase in the logging model height H, the E/T value detected by the PFNUL instrument is more significantly increased when the borehole radius is 3 cm. In contrast, the changes in the E/T value with changes in the model height are relatively insignificant when the borehole radius exceeds 3 cm. The number of E/T values does not change significantly with an increase in the model height and is less affected by the borehole radius r. After the model reached a certain height, the number of E/T values did not change significantly with an increase in the model height and was less affected by the borehole radius r. Therefore, the simulation results show that H ≥ 120 cm for the height of the saturated layer.
After the simulation, it was determined that the height of the saturated uranium ore model H ≥ 120 cm, radius R ≥ 60 cm, and measurement results of the neutron detector under the model of the ore layer of this size were the same as those of the infinite ore layer.
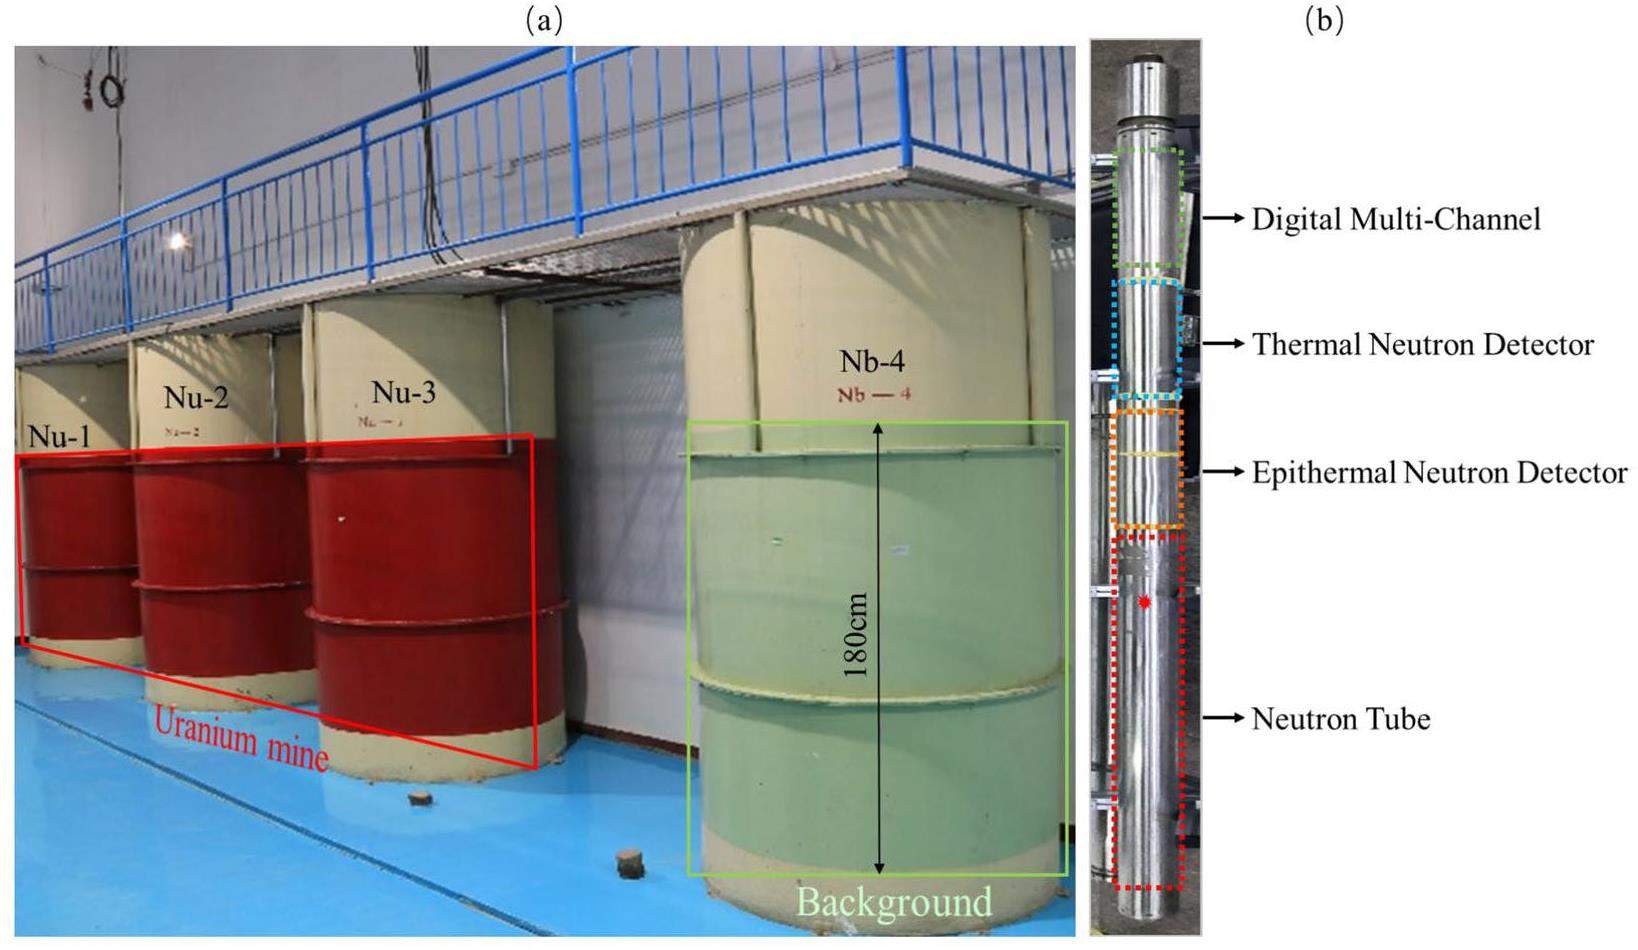
The experimental model used in this experiment was the Nu series of the sandstone-type uranium ore standard model wells constructed by the Airborne Survey and Remote Sensing Center of Nuclear Industry (ASRSCNI), as shown in Fig. 4(a). Models Nu-1, Nu-2, and Nu-3 are uranium-bearing models (red) with uranium contents of 0.0281%, 0.0685%, and 0.0983%, respectively. The Nb-4 model, in which the uranium taste is much lower than the boundary taste, is defined as a pure sandstone model without uranium and is a background count test model (green). The borehole radius r of each uranium cylinder model drill hole is 9 cm, the model radius R is 70 cm, and the height is 180 cm. Moreover, a 90 cm thick concrete roof is set on the model, a 30 cm thick concrete base is set under the model, and extension holes are set below the base at a depth of 260 cm. The size of the model meets the requirements of the saturation model. Figure 4(b) shows the PFNUL instrument, which contains two sets of 3He tubes in the well-logging instrument, a polyethylene neutron moderating material wrapped around the epithermal neutron detector, a cadmium metal skin wrapped around the moderating material, a high-voltage power supply for the detector, a preamplifier, shaping and screening circuitry, a pulse counter to record the output signals from the dual neutron detector, a time spectrum analysis, and cache circuits to record the output signals of the dual neutron detectors.
Simulated scale factor
According to the simulation results, to find the conversion relationship between the E/T ratio and uranium content, considering the reduction of the influence of the statistical rise and fall on the counting results, the simulated time spectra with different uranium contents (pure sandstone, 0.0280%, 0.0684%, and 0.0982%) are taken as the starting and ending times of 200–800 μs, and the total counts of epithermal and thermal neutrons and neutrons are calculated. The scale curve of the uranium fission prompt neutron instrument for this study was compared with the E/T value curve calculated from the experimental raw data, as shown in Fig. 5.
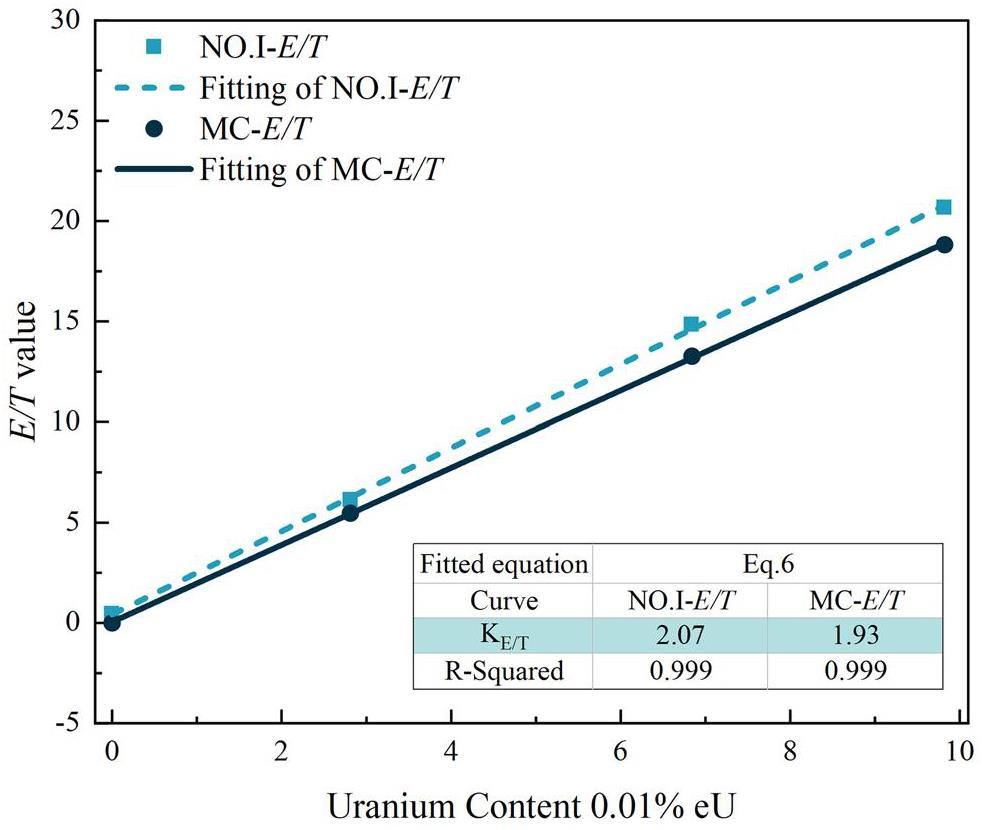
Figure 5 shows a comparison of the simulated correspondence between the uranium content and E/T ratio and the experimental results, which can be fitted using Eqs. (6). The conversion coefficient of the simulated results of the uranium content and E/T value KE/Tmc=1.93(0.01%eU/cps) exhibit a fit of R2=0.999, and the same can be obtained from the experimental data with a conversion coefficient of KE/T=2.07(0.01%eU/cps). The deviation of simulation and experiment comparison is 7.25%. The simulation results are in line with the principle of PFNUL, based on the ratio of epithermal to thermal neutrons.
Neutron yield impact
Time spectra of different neutron yields
Owing to the consumption of the experiments and tritium, the neutron yield of the D-T neutron tube changed with use. To investigate the effect of the neutron yield on the accuracy of uranium quantification, four sets of experiments were conducted, in which the neutron intensity of the D-T neutron source was varied slightly. The neutron source intensity was based on Experiment No. 1, and the relative intensities of the neutron sources of the remaining experiments were calculated, as shown in Table 1.
| Measurement ID | D-T pulsed neutron source flux | Neutron source strength |
|---|---|---|
| Ⅰ | 62068150 | 1 |
| Ⅱ | 27816560 | 0.45 |
| Ⅲ | 65526101 | 1.06 |
| Ⅳ | 52639004 | 0.85 |
As shown in Fig. 6, four sets of neutron time spectra and epithermal neutron time spectra were measured using a logging instrument at different neutron source intensities in the Nu series sandstone uranium logging model (Fig. 4(a)) from the ASRSCNI.
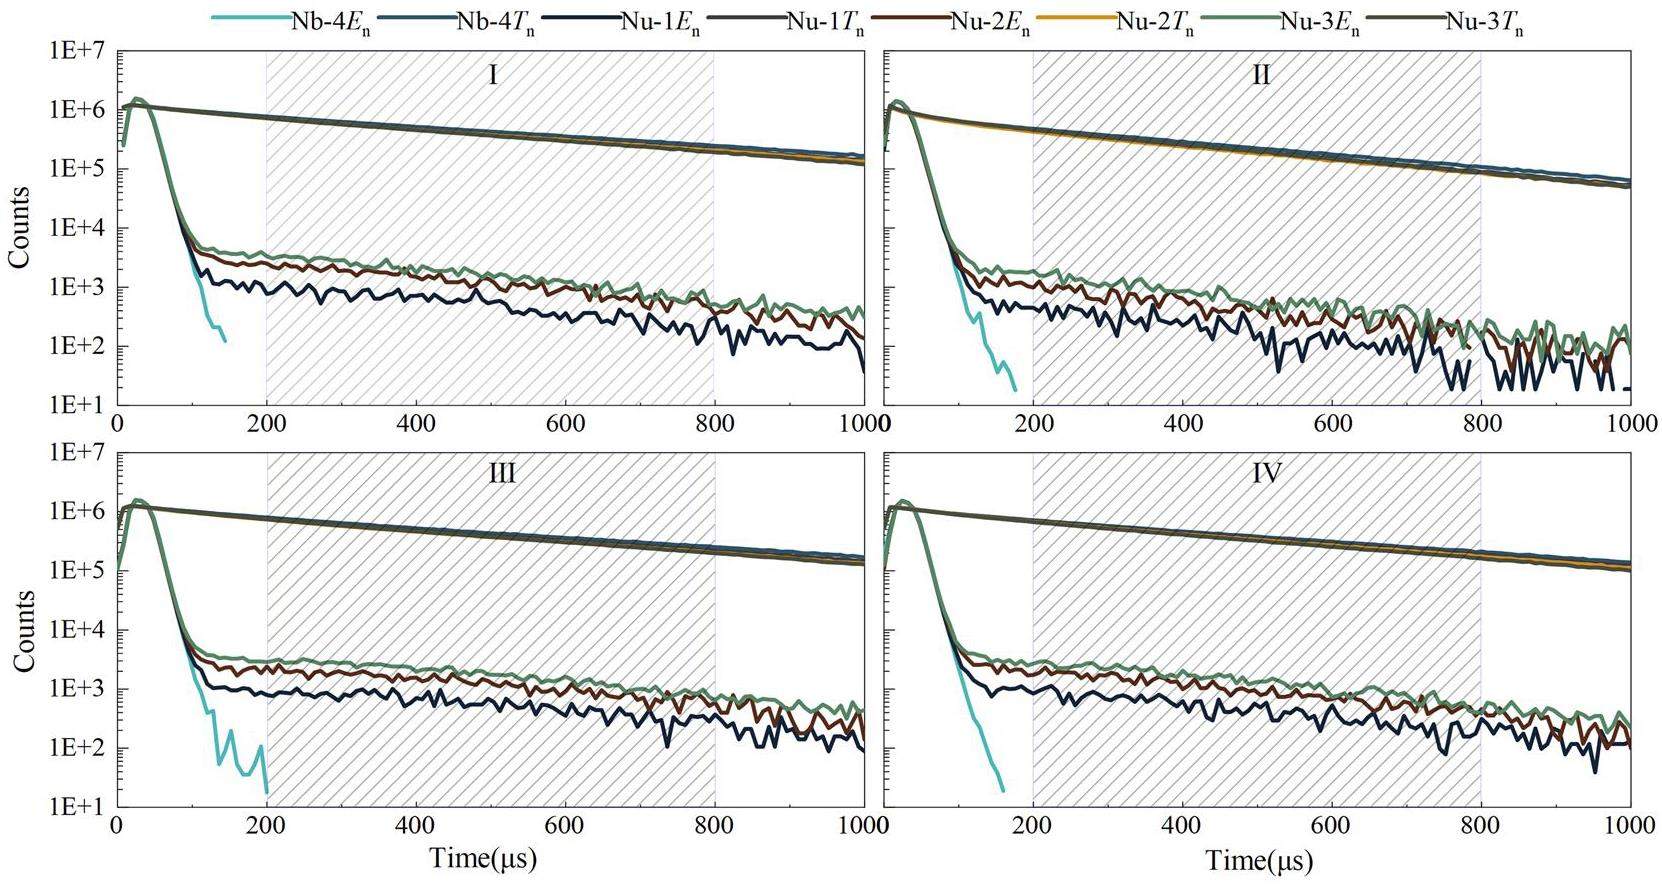
Effect of the neutron source strength on the epithermal neutron counts and E/T values
As listed in Table 1, the relative intensities of the neutron sources in the four experiments were not equal. Figure 7 shows the changes in the E/T values and epithermal neutron counts measured in the standard uranium mine model with the changes in the intensity of the neutron sources in the four experiments.
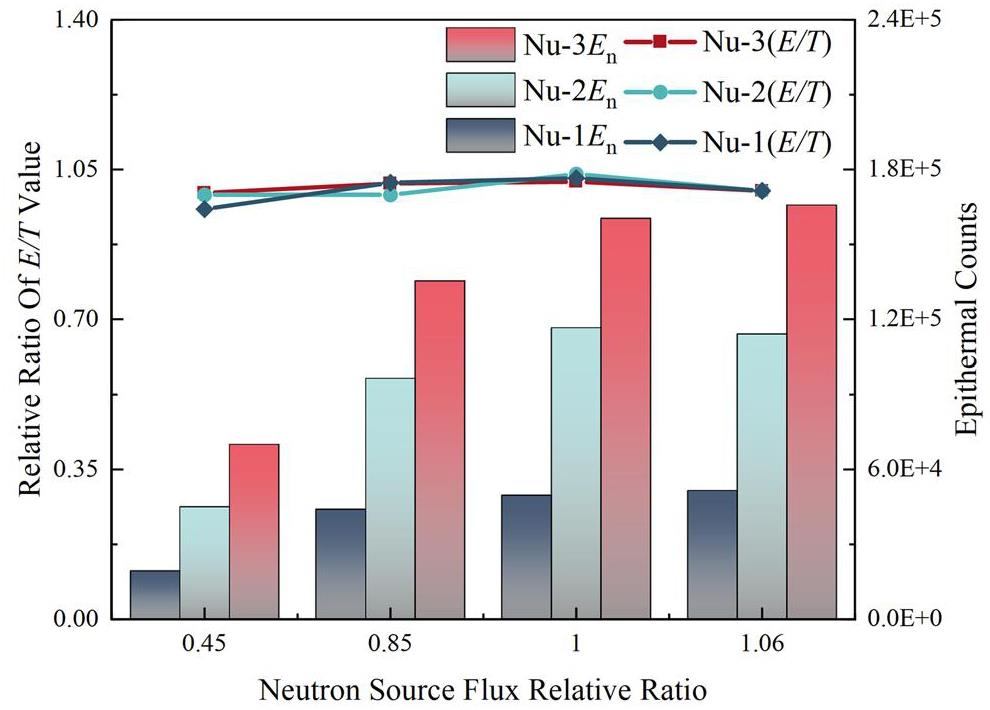
Figure 7 shows that different neutron source intensities have a significant influence on the counts of epithermal neutrons, which results in significant changes in the epithermal neutron counts; however, there is no significant change in the E/T values under different neutron source intensities. The relative standard deviation (RSD) was used to measure the stability of the E/T value and epithermal neutron counts under different neutron source intensities [39, 40]. The calculation formula is as follows:
The RSD values of the epithermal neutron counts and E/T values for different uranium contents in each group of experiments were calculated, as shown in Table 2. The maximum value of the standard deviation of the counts of epithermal neutrons reaches 36.32%, whereas the relative standard deviation of the E/T values is relatively stable, with a maximum value of only 3.2%, proving that the fluctuation of the neutron yield has a large impact on the counts of epithermal neutrons, whereas its impact on the E/T values is small.
| Experiment ID | Epithermal counts | E/T values | ||||
|---|---|---|---|---|---|---|
| Nu-1 | Nu-2 | Nu-3 | Nu-1 | Nu-2 | Nu-3 | |
| Ⅰ | 49676 | 114001 | 160359 | 6.12 | 14.83 | 20.67 |
| Ⅱ | 19314 | 45006 | 70024 | 5.69 | 14.14 | 20.14 |
| Ⅲ | 51611 | 116601 | 165723 | 5.94 | 14.27 | 20.23 |
| Ⅳ | 44123 | 96532 | 135385 | 6.06 | 14.14 | 20.58 |
| RSD | 36.23% | 35.72% | 33.07% | 3.20% | 2.29% | 1.27% |
Variation of the scale factor for different neutron source intensities
Based on the experimental data, we calculated the epithermal neutron counts for different neutron source intensity test data with different uranium contents within a time of 200–800 μs, and we linearly fitted the relationship between the epithermal neutron counts and uranium content, as shown in Fig. 8(a). The figure clearly shows that the epithermal neutron counts and uranium content have a good linear relationship; however, the epithermal neutrons of the same uranium content change with the relative intensity change of the neutron source. The fluctuation of neutron tube production in the process of uranium measurement has a greater impact on the results of the counting of epithermal neutrons, which directly affects the uranium measurement accuracy. After the time normalization of the experimental time spectrum, the counts of epithermal and thermal neutrons from 200–800 μs for different uranium contents in the four sets of experimental data were calculated. Additionally, the corresponding E/T values were calculated. Finally, the corresponding relationship curves were obtained based on the linear fitting of the E/T values to the uranium content, as shown in Fig. 8(b).
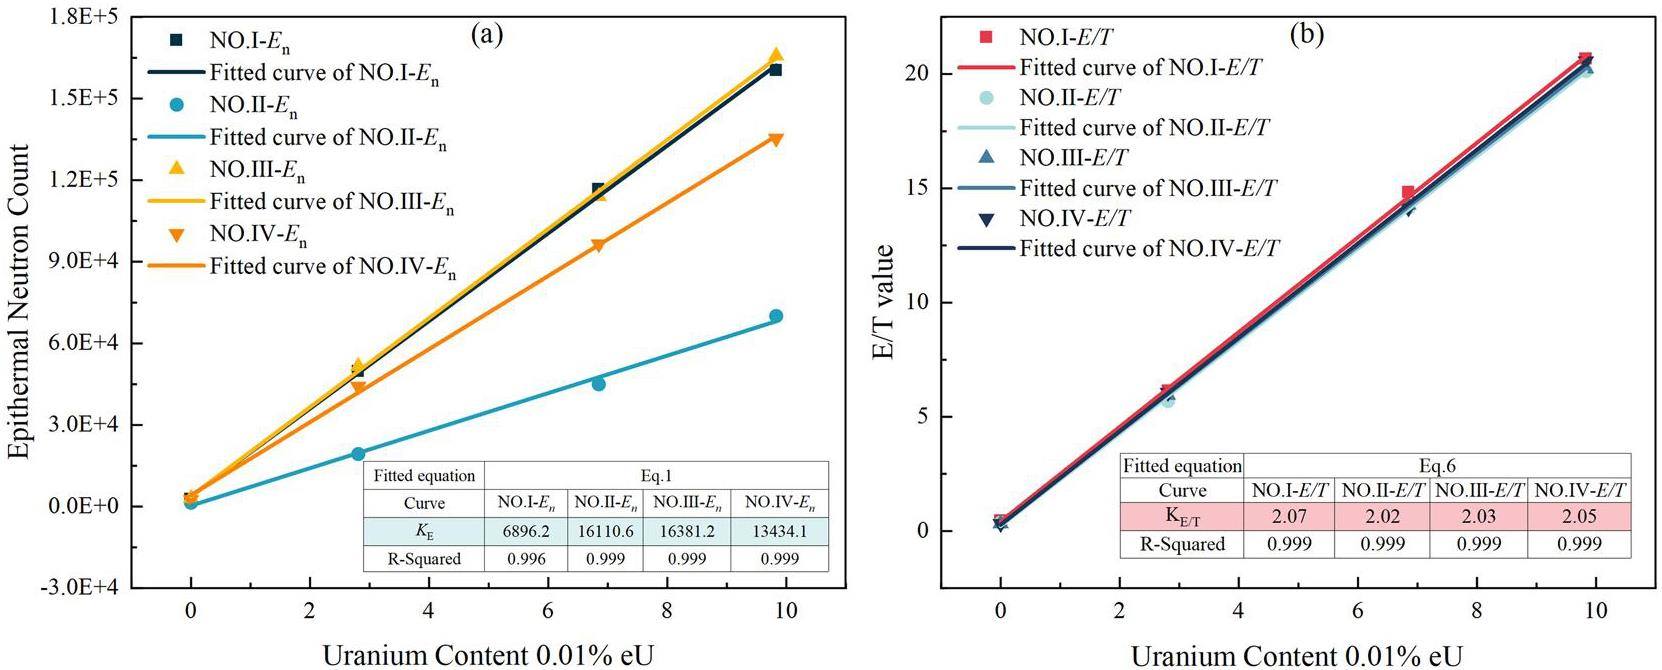
The linear fitting results showed that the uranium quantitative scale factors KE based on epithermal neutron counting without relevant correction factors in the four sets of experiments conducted were 6896.2, 16110.6, 16381.2, and 13434.1. The RSD value was 33.41%, and the uranium quantitative scale factors KE/T based on the E/T value were 2.07, 2.02, 2.03, and 2.05, respectively. The RSD value was 1.09%. It has been proven that the E/T-based uranium quantification method based on the double neutron time spectrum can effectively and accurately analyze uranium quantification and that the scale factor is not affected by the neutron tube yield, which can effectively improve the service life of the neutron logging instrument.
Conclusion
In this research, based on the prompt fission reaction between uranium and neutrons, a PFNUL method with an up and down detection structure is proposed. Moreover, the secondary neutron fading law is extracted from the epithermal neutron time spectrum, the primary neutron slowing law is extracted from the thermal neutron time spectrum, and a uranium quantification algorithm based on the E/T value of the dual neutron time spectrum is subsequently proposed, thus realizing the "direct measurement of uranium" and uranium quantification. Via Monte Carlo simulations, a model radius R ≥ 60 cm and height H ≥ 120 cm were determined for the saturated neutron uranium logging model, and the starting and ending times of the time window (Δt) were 200 and 800 μs for t1 and t2, respectively. The Monte Carlo simulation results showed that the E/T value had a strong positive relationship with the uranium content, with a scale factor of 1.93 and an R2 value of 0.999. Finally, in the saturated uranium model, experiments were carried out using the saturated uranium model to verify the positive relationship between the E/T value and uranium content, and the experimental results were compared with different neutron source intensities in the standard model of uranium ore. These results prove that the method can maintain the stability of the E/T value under different neutron source intensities and reduce the RSD of the scale factor of the uranium content from 33.41% to 1.09%, compared with the single method of quantification of epithermal neutron uranium ore. Hence, effectively eliminating the influence of fluctuations in neutron source yields, ensuring the accuracy of uranium quantification in the logging process, extending the service life of neutron tubing, and reducing the cost of neutron uranium logging are of great significance for the popularization and application of neutron uranium logging.
Simulation study of uranium content in uranium yellow cake using the active multiplicity method
. Nucl. Tech. (in Chinese) 47,Gamma-ray well-logging
. Geophysics 4, 106-114 (1939). https://doi.org/10.1190/1.1440486Gamma-ray logging
. Geophysics 48(11), 1421-1560 (1983). https://doi.org/10.1190/1.1441436Simultaneous gamma ray and resistance logging as applied to uranium exploration
. Geophysics 20(4), 745-961 (1955). https://doi.org/10.1190/1.1438193Borehole logging for uranium by measurement of natural γ-radiation
. Int. J. Appl. Radiat. Isot. 34, 231–260 (1983). https://doi.org/10.1016/0020-708X(83)90128-XNuclear Logging Methods
. Radioisotopes. 17(4), 171-185 (1968).https://doi.org/10.3769/radioisotopes.17.4_171A union neutron-gamma logging method for determination of uranium-radium disequilibrium coefficient
. Nucl. Technol. Radiat. Prot. 35(2), 103-108 (2020).https://doi.org/10.2298/NTRP2002103CImproved formation density measurement using controllable D-D neutron source and its lithological correction for porosity prediction
. Nucl. Sci. Tech. 33, 3 (2022). https://doi.org/10.1007/s41365-022-00988-1Direct uranium quantitative detection in high precision γ-logging by 1.001 MeV 234mPa γ-ray
. Nucl. Tech. 35(10), 745-750 (2012). https://api.semanticscholar.org/CorpusID:229713064Calculation of U, Ra, Th and K contents in uranium ore by multiple linear regression method
. Nucl. Tech. 6, 369–371 (1991). (in Chinese)Research development and tendency of controllable neutron and X-ray source well logging technology
. J. Isot. 32(3), 133-150 (2019). https://doi.org/10.7538/tws.2019.32.03.0133Low-resolution gamma spectrometry of uranium ores to determine U concentration and U/Rn imbalance
. IEEE Trans. Nucl. Sci. 69(4), 761-767 (2022). https://doi.org/10.1109/TNS.2021.3129343Radon emanation from low-grade uranium ore
. J. Environ. Radioact. 126, 104–14 (2013). https://doi.org/10.1016/j.jenvrad.2013.07.014Determination of uranium-radium equilibrium coefficient of uranium ore sample using characteristic peaks in γ-ray spectrum
. At. Energy Sci. Technol. 44(7), 769-772 (2010). https://doi.org/10.7538/yzk.2010.44.07.0769 (in Chinese)Theory of neutron logging; II
. Geophysics. 31, 214-224 (1961). https://doi.org/10.1190/1.1439737Dual-spaced neutron logging for porosity
. Geophysics 32, 60–68 (1967). https://doi.org/10.1190/1.1439857Pulsed neutron method for uranium well logging
. Geophysics 32(1), 160-173 (1970). https://doi.org/10.1190/1.1440244Determination of the probing distance in pulsed-neutron uranium logging experiments
. Nucl. Sci. Eng. 63(3), 330-335 (1977). https://doi.org/10.13182/NSE77-A27044Comparison of predicted signals from the delayed fission neutron and prompt fission neutron uranium logging methods
. J. Appl. Phys. 49(2), 6153-6159 (1978). https://doi.org/10.1063/1.324538Development of pulsed neutron uranium logging instrument
. Rev. Sci. Instrum. 86(3),Application of Prompt Fission Neutron Logging to the Uranium Deposits of Stratified Infiltration Type
.Current status and development trend analysis of neutron logging in uranium mines in China
. J. Phys. Conf. Ser. 1865(2),Correction algorithm of epithermal neutron decay time spectrum for uranium pulsed neutron logging
. For. Chem. Rev.. 1368-1376 (2022). www.forestchemicalsreview.comDevelopment of a sealed-accelerator-tube neutron generator
. Appl. Radiat. Isot. 53(4-5), 801-809 (2000). https://doi.org/10.1016/S0969-8043(00)00262-1The operation and life of the Zetatron neutron tube in a borehole logging application
. Int. J. Appl. Radiat. Isot. 34(1), 269-272 (1983). https://doi.org/10.1016/0020-708X(83)90130-8Development and performance of a 14-MeV neutron generator
. Nucl. Instrum. Methods Phys. Res., Sect. A. 959,Discharge characteristics of a penning ion source for compact neutron generator
. Nucl. Instrum. Methods Phys. Res., Sect. A. 768, 120–123 (2014). https://doi.org/10.1016/j.nima.2014.09.052Effect of target film materials on neutron yield of neutron tube with drive-in target
. Radiat. Phys. Chem. 182,A high-stability neutron generator for industrial online elemental analysis
. Nucl. Eng. Technol. 56(4), 1441-1453 (2024). https://doi.org/10.1016/j.net.2023.11.048Logging technique for assaying for uranium in earth formations
.Prompt fission neutron uranium logging(II): Dead-time effect of neutron time spectrum
. Nucl. Sci. Tech. 36(2), 19 (2025). https://doi.org/10.1007/s41365-024-01615-xDevelopment and application of nuclear logging technique
. At. Energy Sci. Technol. 38(S1), 201-201 (2004). https://doi.org/10.7538/yzk.2004.38.S1.0201 (in Chinese)Neutron shielding property test with combination detection method based on moderation sphere detectors
. Nucl. Sci. Tech. 39(5),The Monte Carlo simulation of pulsed neutron-fission neutron uranium logging technique
. J. Isot. 26(1), 48-52 (2013). https://doi.org/10.7538/tws.2013.26.01.0048Application of the Monte Carlo Library Least-Squares (MCLLS) approach for chromium quantitative analysis in aqueous solution
. Appl. Radiat. Isotopes. 150, 39–42 (2019). https://doi.org/10.1016/j.apradiso.2019.02.018Study on the PGNAA measurement of heavy metals in aqueous solution by the Monte Carlo Library Least-Squares (MCLLS) approach
. Appl. Radiat. Isotopes. 132, 13-17 (2018). https://doi.org/10.1016/j.apradiso.2017.10.037The authors declare that they have no competing interests.

