Introduction
Nowadays, radionuclides have been widely used in medical, industrial, agricultural, and scientific research fields [1, 2]. Accidental leakage or incidents involving radionuclides may cause serious harm to people and the surrounding environment [4, 3]. A low-cost and effective nuclide identification algorithm suitable for portable gamma spectrometers can quickly determine potential or unexpected radionuclide types, enabling follow-up emergency treatment to minimize harm to public health and the environment [5-7].
Traditional nuclide identification methods use the most prominent features in the gamma spectra—the address and area information of the full-energy peak—to search for and identify nuclides. These methods typically involve obtaining raw gamma spectrum data using digital multichannel analyzers, followed by smoothing, digital filtering [8], background subtraction [9], peak searching [10], and energy calibration [11-13]. This process ultimately establishes a functional relationship between full-energy peak addresses and energies for nuclide identification. These methods, which have strong interpretability and mature peak search algorithms, have been widely used in various nuclide identification systems [14, 15]. However, for nuclides with multiple characteristic energies such as (226Ra, 152Eu, 232Th, etc.), and others, or for spectra composed of multiple nuclides, the algorithm logic becomes complex and redundant. This renders traditional nuclide identification methods not suitable for portable gamma spectrometers. Sequential Bayesian algorithms for nuclide identification are statistical learning methods [16]. These methods, based on extracting energy and time information emitted by the nuclide source, construct a screening process for energy and time to predict the existence of nuclides. For a single nuclide with low noise interference, the method performs well [17]. However, sequential Bayesian methods can be easily affected by high background count levels. Additionally, the large number of calculations required for multiple nuclides makes it impossible to deploy sequential Bayesian methods in portable gamma spectrometers [18, 19].
With the rapid development of artificial intelligence, neural networks have been widely used to solve identification problems owing to their powerful nonlinear mapping capabilities. The application of neural networks to identification problems primarily involves extracting feature vectors, defining network structures, adjusting parameters, and calculating prediction results. In the field of nuclide identification, the application of neural networks aims to improve identification efficiency and lower the technical requirements for operators [20, 21].
Neural network algorithms for nuclide identification directly accept the gamma spectra measured by digital multichannel analyzers as input and obtain nuclide identification results through nonlinear operations [23, 22]. Recently, the widespread application of machine learning to classification problems has promoted the development of nuclide identification based on neural networks. Various algorithms and principles have been applied to nuclide identification. A scintillation detector nuclide identification algorithm based on a deep neural network with multiple hidden layers was implemented at a low-energy resolution [24]. Considering that an energy spectrum with 1024 or more channels is not suitable for direct utilization as a network input, multiple nuclide identification methods in low-count cases can be realized by combining feature enhancement technology and a one-dimensional neural network to improve identification accuracy and applicability [25]. For convolutional neural networks (CNNs), a novel nuclide identification method based on the Hilbert-Huang transform and a CNN was constructed, achieving high-precision identification by processing gamma pulse signals [26]. Using mixed nuclide gamma spectra simulated by Geant4, a trained convolutional neural network nuclide identification model demonstrated an accuracy of approximately 90% [27]. Additionally, the background contrast nuclide identification method can achieve high accuracy and rapid identification by comparing background signals with sample signals [28].
However, the aforementioned methods do not retain good interpretability of the extracted feature information. Moreover, the dimensionality of the feature information is high, resulting in significant computation and resource consumption by the neural network, making it difficult to deploy in portable equipment. Second, for multiple nuclide identification, the features of multiple nuclide spectra are usually treated as features of a new single-nuclide spectrum, which significantly increases the sparsity of the multi-classification neural network [29]. Additionally, the training datasets in the above studies were typically simulated using Monte Carlo method or collected under laboratory conditions, and all types of neural networks were trained on this basis [30, 31]. In the application scenario of a portable gamma spectrometer, the spectral features may change significantly under the influence of temperature and region, reducing the stability of these methods.
Therefore, in this study, we designed a nuclide identification method with low consumption and strong robustness suitable for portable gamma spectrometers. A peak-seeking algorithm was developed to obtain the full-energy peaks of the gamma spectra, and the exported characteristic energies were considered its features. Subsequently, a multilabel classification neural network with a low number of nodes was built, trained, and evaluated. Finally, low energy consumption and good identification accuracy were achieved after the implement in the spectrometer.
Methods and experiments
Classification problems are among the most important research topics in the field of machine learning and can be divided into two categories: single-label classification and multi-label classification.
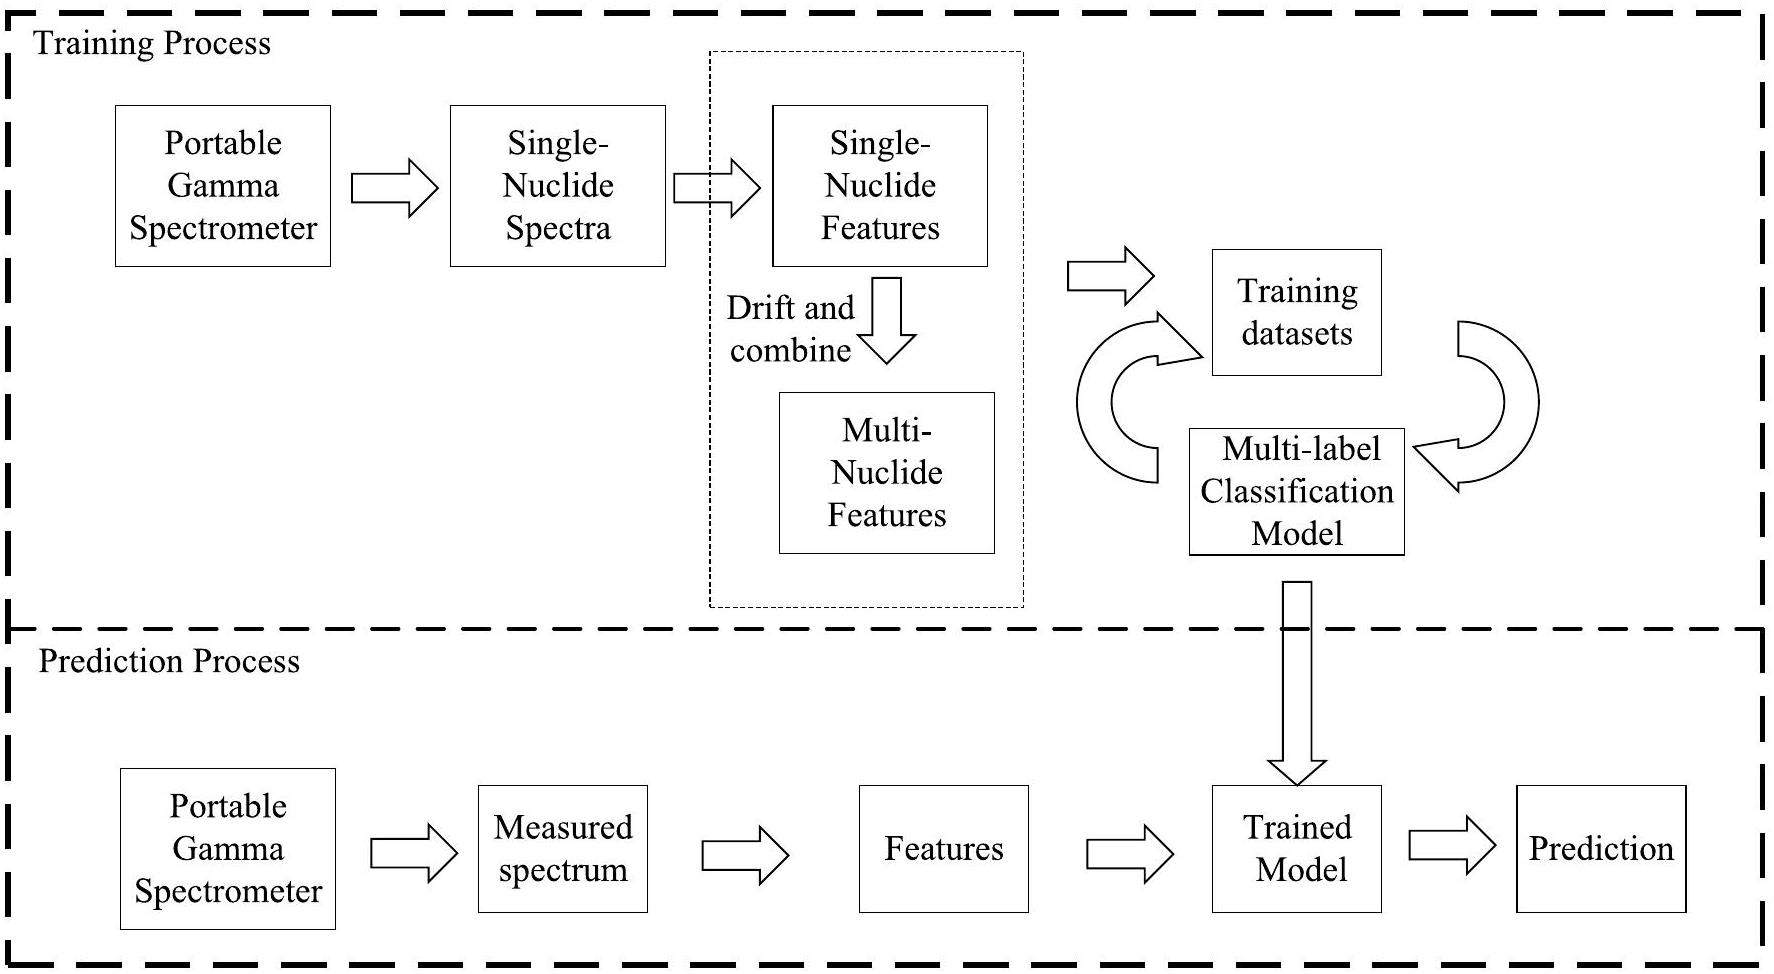
Single-label classification is primarily used to solve problems where a sample belongs to only one category. Each output node in the network represents a category. In the case of multiple nuclides, the single-label classification neural network for nuclide identification needs to enumerate all the considered nuclide combinations, which is redundant and not applicable [32]. However, in multi-label classification, a sample is considered to belong to multiple categories simultaneously, making it suitable for multiple nuclide identification. For this reason, a multi-label classification neural network was designed to fit the single and multiple nuclide cases simultaneously. The training and prediction processes are shown in Fig. 1. In the training process, the measured spectra were converted into training datasets through feature extraction, drifting, and combination. For the prediction process, the trained model is deployed in the portable gamma spectrometer to predict the nuclides of the measured spectra.
Multi-label classification
As shown in Fig. 2, the classification neural network for single-label and multi-label can have the same network topology construction. o={o1, o2 …, o5} is the output vector of the classification neural network. In single-label classification, the output vector satisfies ∑o=1, assuming o3 is the maximum value, its prediction vector y={y1,y2…,y5} yields {0, 0, 1,, 0, 0}, which indicates that the input feature vector only belongs to the 3-rd label. In the multi-label classification case, its output vector satisfies
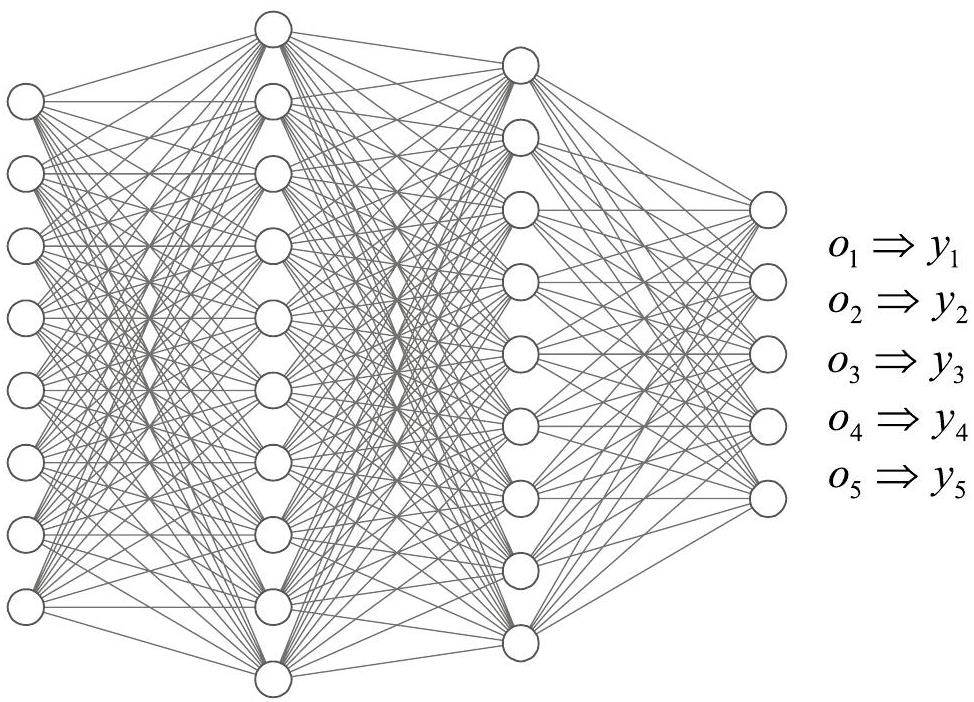
Although single-label and multi-label classification neural networks can have the same network topology, there are differences in the activation and loss functions. To avoid the logical redundancy of the traditional nuclide matching method and the high resource consumption of existing neural network algorithms, a loss function optimization method was designed to handle the multi-label output and optimize the loss function.
The designed neural network had an input layer, two hidden layers, and an output layer. All the layers were fully connected. The computational formula between two layers can be defined as
The loss function in the neural network quantifies the difference between the predicted and true values, which is considered as the difference between the real probability distribution and the predicted probability distribution for this network design. The output of the k-th node Ok can be regarded as the predicted presence probability of the k-th target nuclide and obeys the Bernoulli distribution. The probability density function can then be defined as
For the undefined network hyperparameters, a hyperparameter optimization process was implemented. In this process, random search is commonly employed to select hyperparameters and evaluate model performance. This approach identifies optimal hyperparameters over a wide range and provides an initial training set. By analyzing training results, the hyperparameter region converges more easily. The Keras-Tuner toolkit was utilized for hyperparameter searching, with the node numbers of the first and second hidden layers set to 30 and 26, respectively. The dropout rate for hidden layer neurons was 0.5, and the learning rate was set to 0.001.
The designed multilabel classification neural network was built, trained, and tested using the Keras library in Python 3.9. The backpropagation algorithm employed the Adam optimizer to adjust network parameters and minimize the loss function [33]. The number of training epochs was set to 20,000.
Features extraction
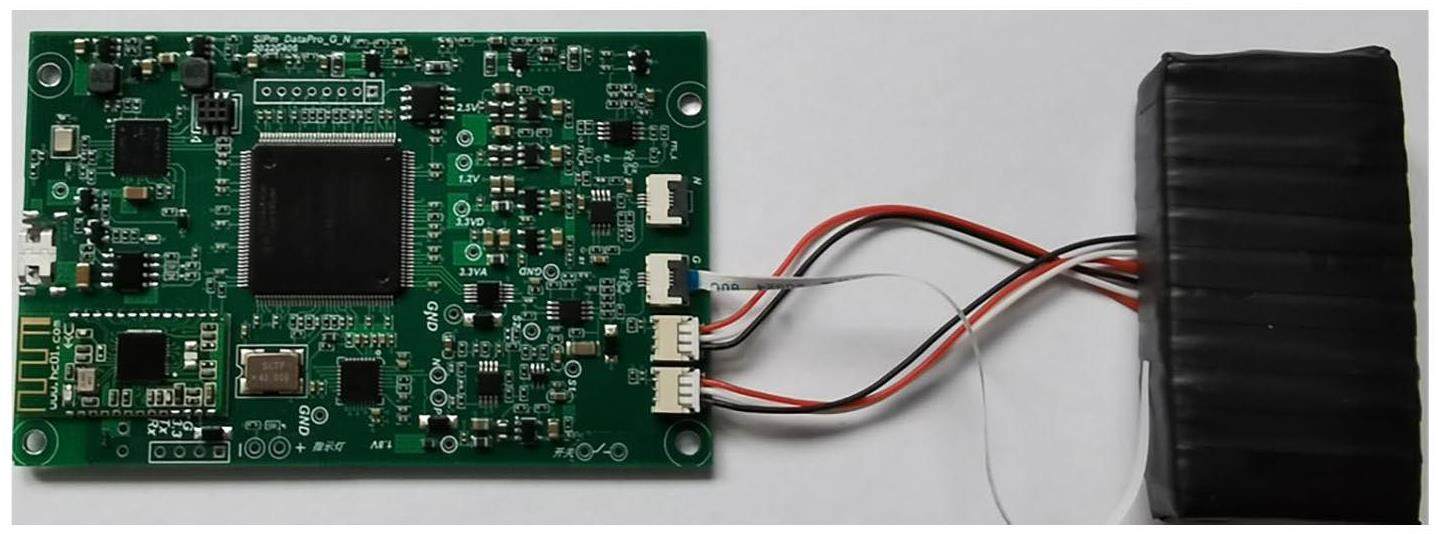
In this section, a portable gamma spectrometer was used to measure the spectra of 12 target nuclides (including the background case) with a dose rate of d≈0.5 μSv/h and a measurement time of tm=60 s. The self-developed portable gamma spectrometer is shown in Fig. 3. It comprises a 0.5 × 1 × 2-inch CsI scintillator detector and a signal processing circuit. Signals from the scintillator detector were amplified, shaped, counted, and analyzed using a signal processing circuit equipped with a low-power ARM chip operating at 200 MHz. Unlike existing portable gamma spectrometers [34], energy calibration was performed using LuO powder surrounding the scintillator crystal. By analyzing fluctuations in the decay characteristic energies of 176Lu in LuO, energy-scale coefficients were adjusted to achieve energy calibration. The measured nuclides included the industrial nuclides (241Am, 133Ba, 60Co, 137Cs, 152Eu, 22Na, 54Mn), the natural nuclides (40K) and the medical nuclides (131I, 177Lu, 99mTc). The measured gamma spectra were used as original samples, and features were extracted to construct the training datasets.
The characteristic energies of the spectra were used as elements in the feature vectors, enhancing the robustness of the algorithm, generalizability, and interpretability under higher dose rates or longer measurement times. Portable gamma spectrometers with scintillator detectors typically exhibit low energy resolution and can identify only a limited number of nuclides. To achieve multiple nuclide identification within three types of nuclides, the feature vector size was set to eight elements (empty elements were filled with zeros). This significantly reduced the number of input nodes and the computational burden of the neural network [22]. The following peak-searching algorithm was designed for feature extraction.
Considering the computing power of the gamma spectrometer and the reliability of the spectral data after smoothing, the smoothing algorithm employs the 7-point barycenter method, which is expressed as
In the spectra measured by the spectrometer, the background primarily originates from uranium, thorium, potassium, and their decay offspring in the environment. In addition, the shielding of materials can further complicate the spectra owing to significant scattering in the spectra. This places higher demands on the spectral feature extraction method. A symmetric zero area peak-searching algorithm was implemented to suppress high background levels and resolve overlapping peaks. The symmetric zero area method uses a symmetric window function with zero area to convolve with the obtained spectra and applies specific criteria to filter valid peaks in the transformed spectra. Its expression is defined as
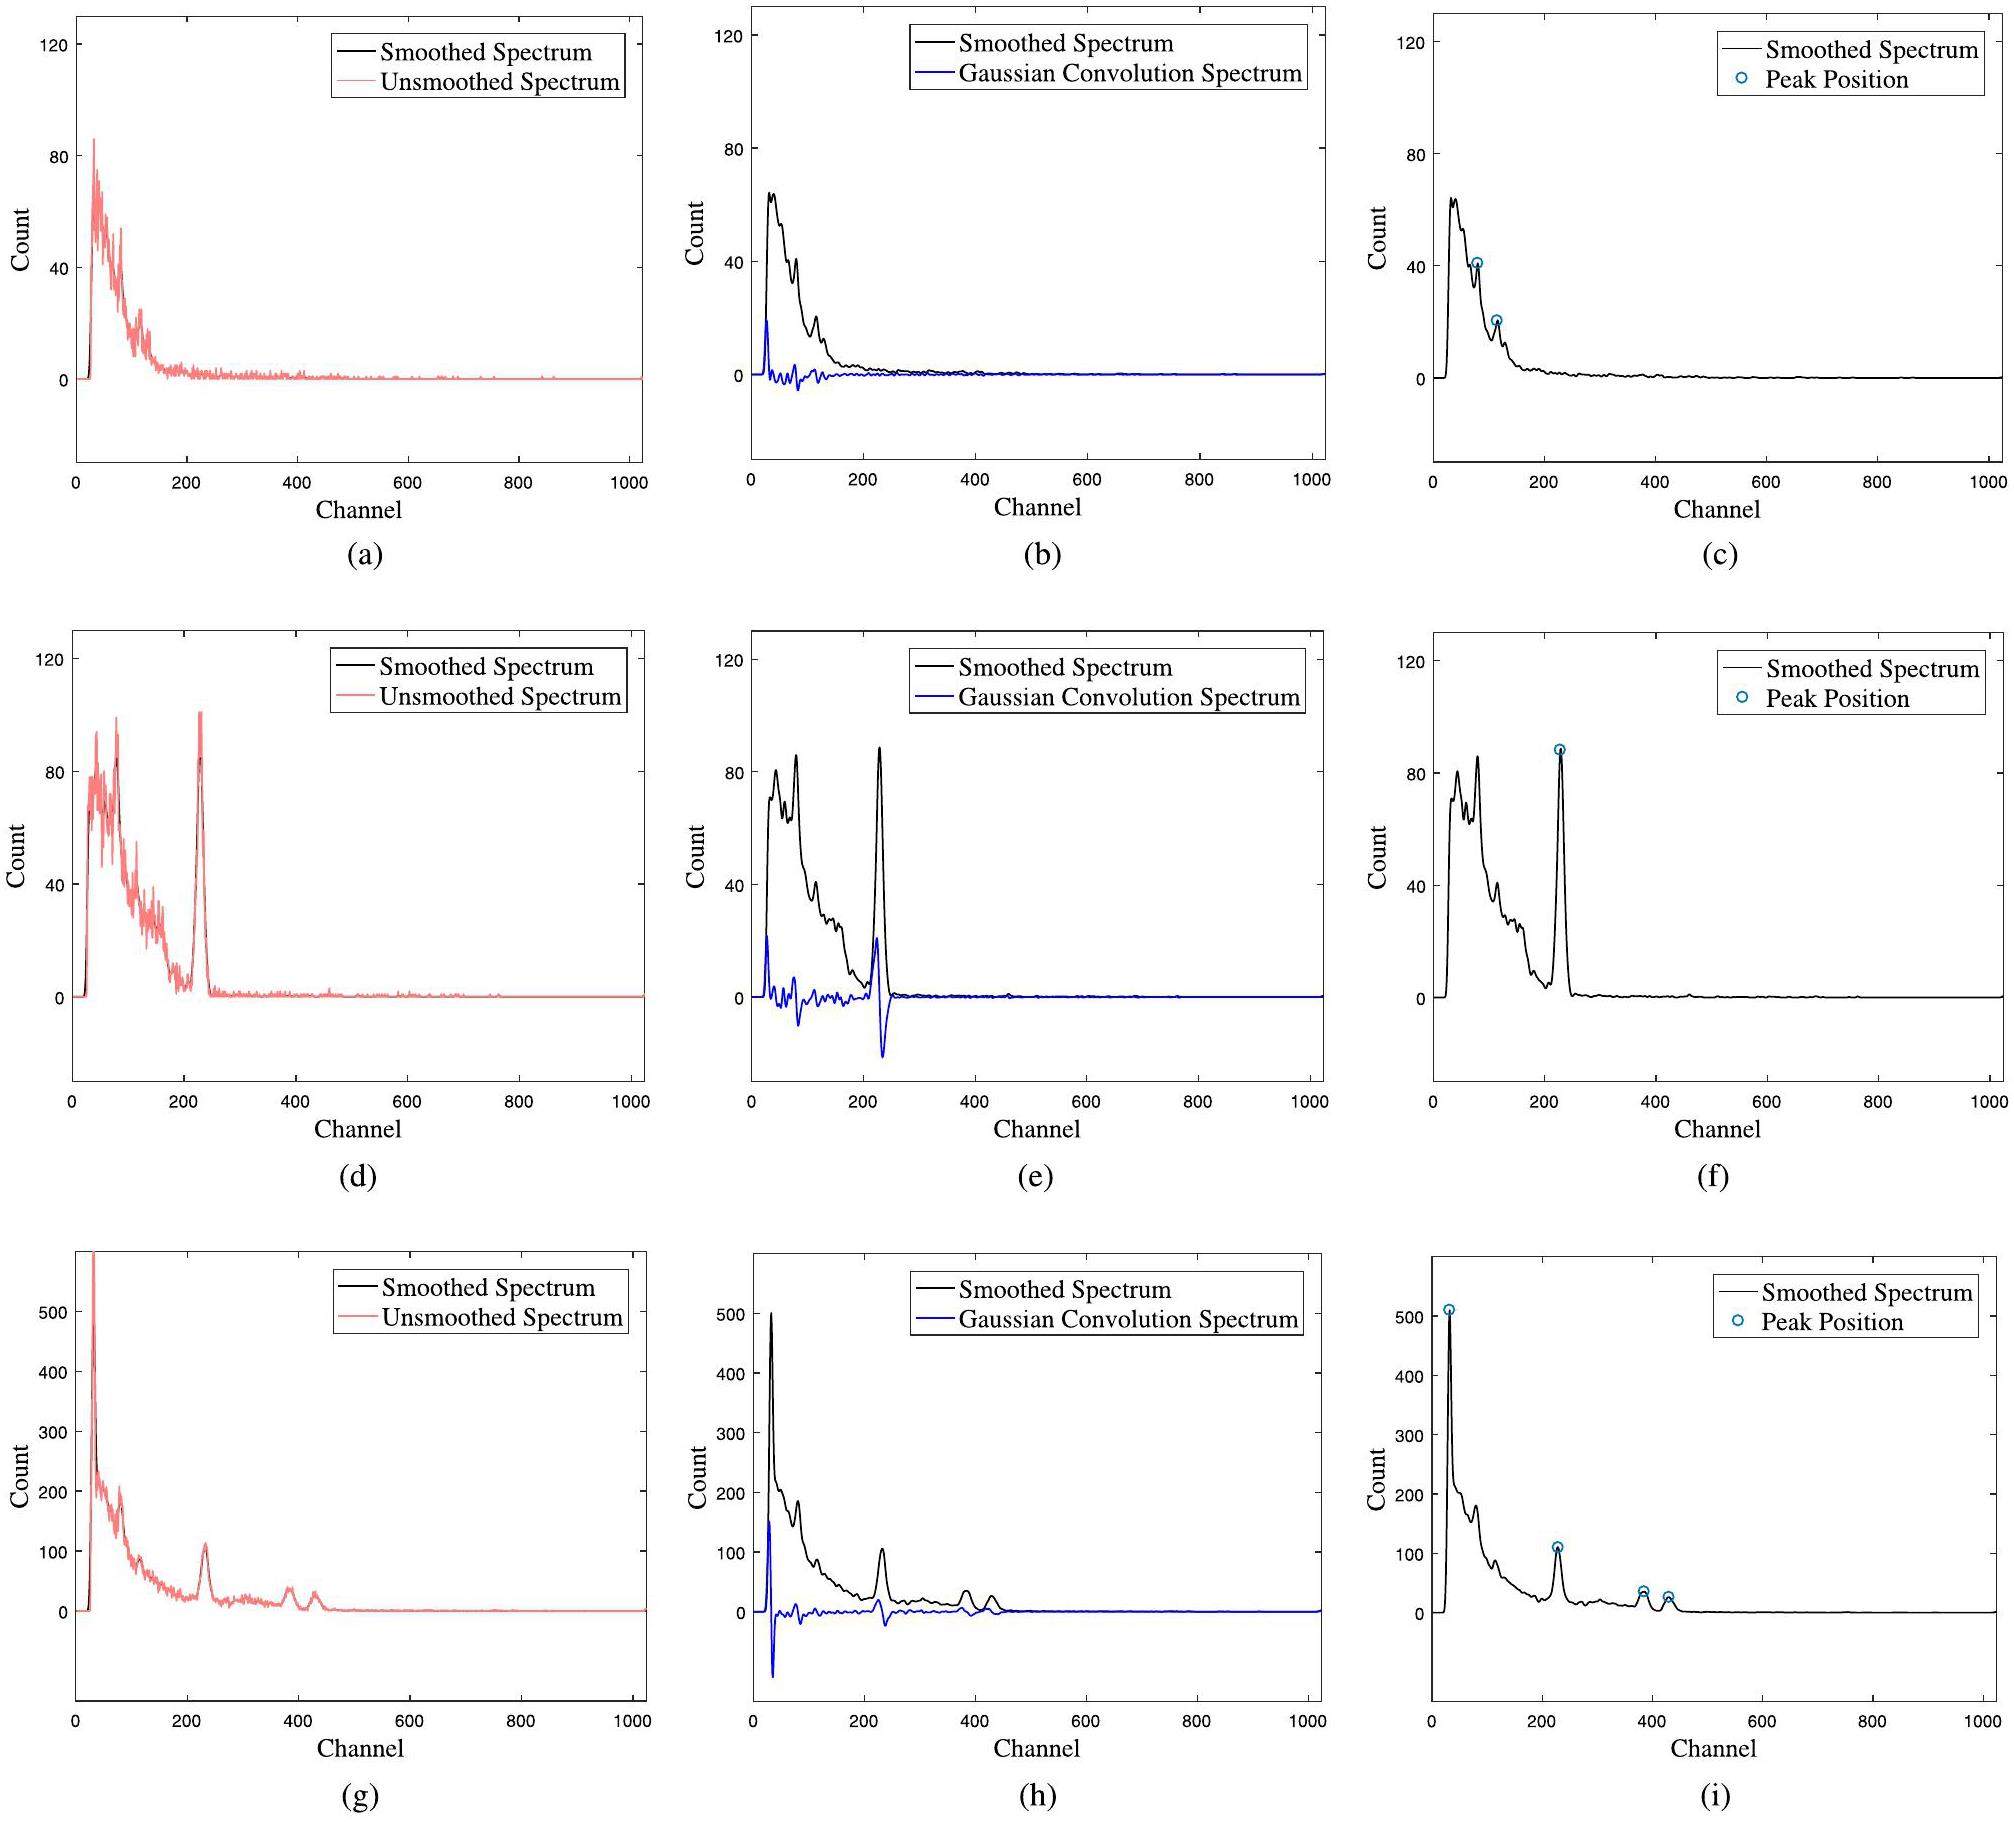
In Figs. 4a, d, and g, the smoothing algorithm demonstrates good performance, ensuring the non-negativity of the spectra around peak regions. The transformation process also effectively removes the background, as shown in Figs. 4b, e, and h. The peaks marked with blue circles in Figs. 4f and i represent the full-energy peaks of the single (137Cs) and multiple nuclides (241Am-137Cs-60Co) cases, respectively, indicating the effectiveness of the designed peak-searching algorithm.
Datasets construction
Using the designed feature extraction algorithm, the full-energy peaks of 12 nuclides were obtained from 1200 measured spectra (100 spectra for each nuclide). The characteristic energies were calculated based on the energy-scale coefficients of the spectrometer. Table 1 lists the characteristic energies of the measured nuclides obtained using the peak-searching algorithm and energy calibration. The designed peak-searching algorithm proves effective for gamma rays with high branching ratios emitted by the nuclides.
| Nuclides | Measured energies of the full-energy peaks (keV) | Standard decay energies (keV) |
|---|---|---|
| 241Am | 63.2 | 59.6 |
| 133Ba | 365.6, 302.9, 168.0, 92.7 | 356.0, 307.84, 165.76, 80.0 |
| 60Co | 1158.3,1308.2 | 1173.2,1332.5 |
| 137Cs | 659.5 | 661.7 |
| 152Eu | 136.1, 359.6, 783.4, 1100.2, 1387.3 | 121.78, 344.28, 778.9, 1173.2, 1408.0 |
| 131I | 378.4, 632.5 | 364.5,637.0 |
| 40K | 1423.6 | 1460.9 |
| 177Lu | 210.4 | 208.4 |
| 54Mn | 835.2 | 834.8 |
| 22Na | 1216.8 | 1274.5 |
| 99mTc | 150.6 | 140.5 |
The data listed in Table 1 demonstrates a noticeable error between the obtained energies and the standard characteristic energy. Simultaneously, considering the drift problem of the detector under varying working environment temperatures, the extracted datasets for a single nuclide were expanded within a range of ±2%. Consequently, the training dataset size for a single nuclide increased from 100 to 500. Then, the different expanded single-nuclide characteristic energies were combined to create multiple-nuclide characteristic energy vectors, with the number of nonzero elements kept at eight or fewer. The multiple-nuclide labels were formed by linearly superposing single-nuclide labels. This process generated datasets containing 18,500 input feature vectors. All input feature vectors were normalized and randomized to reduce positional sensitivity and enhance the generalizability of the model.
Results
Identification accuracy indicators
Hamming Loss is a common evaluation metric in machine learning and classification problems, particularly for multilabel classification tasks where each sample can have multiple labels. It measures the dissimilarity between predicted and actual labels using the Hamming distance, which quantifies the number of differing bits between two binary strings. Specifically, Hamming Loss is calculated as the average number of misclassified labels across an entire test dataset. Hamming Loss evaluates not only individual label predictions but also overall sample predictions. In addition, it is easy to understand and calculate, providing an intuitive measure of classifier performance on test datasets. A lower Hamming Loss indicates higher model accuracy. The calculation formula is as follows:
However, Hamming Loss has certain limitations. It primarily focuses on overall similarity and can fail to capture local characteristics. To address this issue, this study introduces a stricter evaluation method called the exact match ratio (EMR). This method considers only cases where the prediction matches the true label exactly as effective results. EMR is defined as
The EMR method is stricter than Hamming Loss because partially correct predictions are not considered effective. Nonetheless, for both metrics, a smaller value always indicates better network model performance.
Identification Test
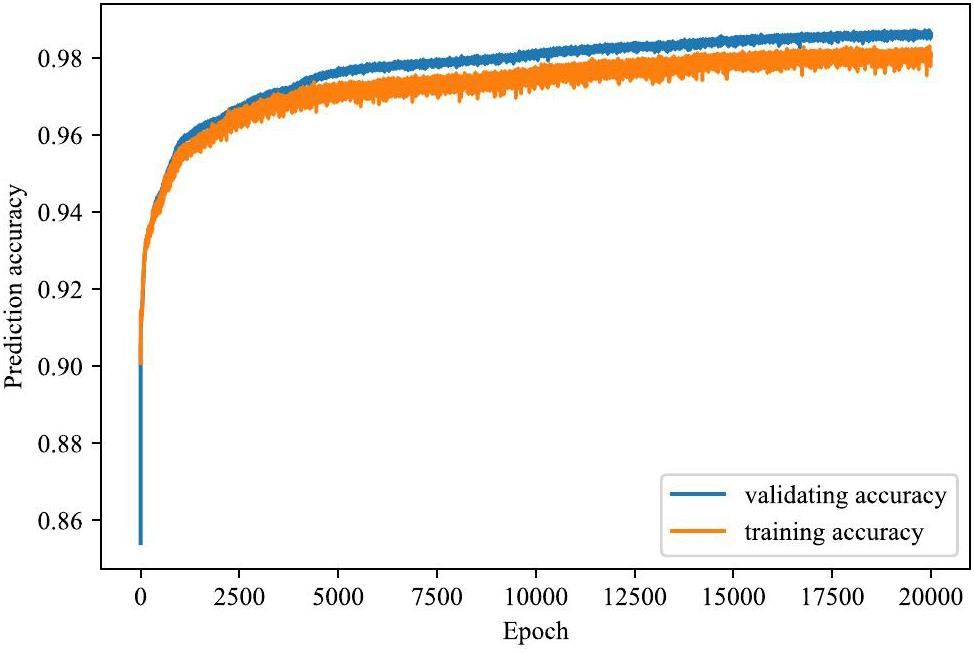
In this study, 14800 gamma spectra were used as training and validation datasets, while 3700 gamma spectra were used as test datasets. The training accuracy iteration processes for both the training and validation datasets were recorded over 20000 epochs, as shown in Fig. 5. The validation accuracy converged to 0.967. Two types of identification tests were performed: a validation test using 3700 validation spectra and an actual test using 900 spectra measured under both unshielded and shielded conditions.
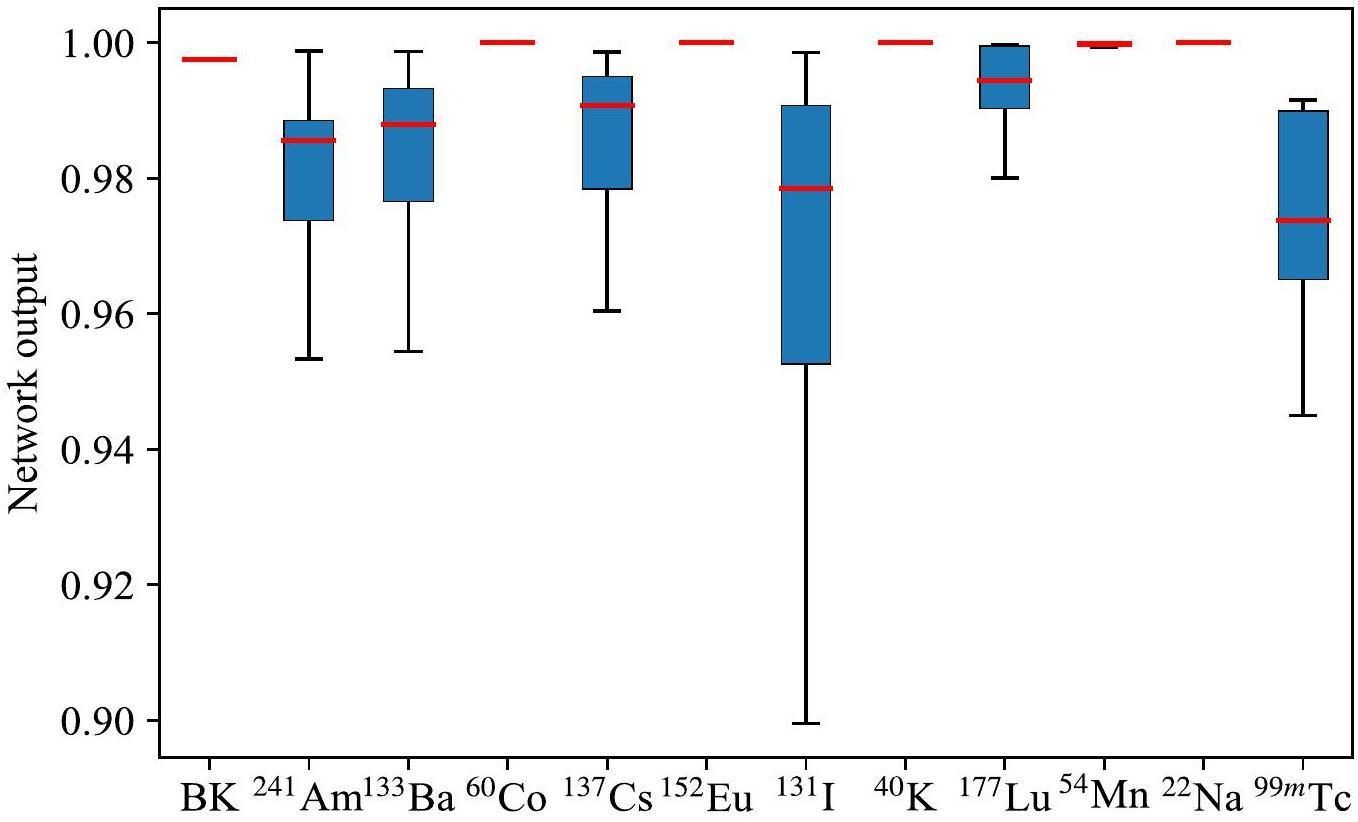
Using the trained network, validation datasets including single, double, and triple nuclides were tested. Table 2 lists the average neural network output for each node under a single-nuclide case, where the background case is also considered as a type of single-nuclide case. The 12 values in each row of Table 2 represent the average output of the 12 network output nodes for a specific nuclide case. Figure 6 illustrates the distribution of the network output for the corresponding nodes under a single-nuclide case. The bold numbers in Table 2 and the red lines in Fig. 6 indicate the average output of the corresponding nodes.
| Single-nuclide | Background | 241Am | 133Ba | 60Co | 137Cs | 152Eu | 131I | 40K | 177Lu | 54Mn | 22Na | 99mTc |
|---|---|---|---|---|---|---|---|---|---|---|---|---|
| Background | 0.998 | 0.014 | 0.003 | 0.000 | 0.000 | 0.000 | 0.000 | 0.000 | 0.000 | 0.000 | 0.000 | 0.002 |
| 241Am | 0.000 | 0.981 | 0.000 | 0.000 | 0.000 | 0.000 | 0.000 | 0.000 | 0.000 | 0.000 | 0.000 | 0.010 |
| 133Ba | 0.000 | 0.110 | 0.982 | 0.000 | 0.000 | 0.000 | 0.000 | 0.000 | 0.000 | 0.000 | 0.000 | 0.000 |
| 60Co | 0.000 | 0.061 | 0.000 | 1.000 | 0.000 | 0.000 | 0.000 | 0.000 | 0.000 | 0.000 | 0.000 | 0.000 |
| 137Cs | 0.000 | 0.093 | 0.003 | 0.000 | 0.985 | 0.000 | 0.000 | 0.000 | 0.000 | 0.000 | 0.000 | 0.000 |
| 152Eu | 0.000 | 0.029 | 0.000 | 0.000 | 0.000 | 0.998 | 0.000 | 0.000 | 0.000 | 0.001 | 0.000 | 0.000 |
| 131I | 0.000 | 0.049 | 0.190 | 0.000 | 0.045 | 0.000 | 0.944 | 0.000 | 0.000 | 0.000 | 0.000 | 0.000 |
| 40K | 0.000 | 0.000 | 0.000 | 0.000 | 0.003 | 0.000 | 0.000 | 1.000 | 0.000 | 0.000 | 0.000 | 0.000 |
| 177mLu | 0.000 | 0.000 | 0.000 | 0.000 | 0.000 | 0.000 | 0.000 | 0.000 | 0.993 | 0.000 | 0.000 | 0.027 |
| 54Mn | 0.000 | 0.000 | 0.000 | 0.000 | 0.034 | 0.000 | 0.000 | 0.000 | 0.000 | 0.999 | 0.000 | 0.000 |
| 22Na | 0.000 | 0.363 | 0.003 | 0.000 | 0.000 | 0.000 | 0.000 | 0.000 | 0.000 | 0.000 | 1.000 | 0.000 |
| 99mTc | 0.000 | 0.009 | 0.000 | 0.000 | 0.000 | 0.000 | 0.000 | 0.000 | 0.0123 | 0.000 | 0.000 | 0.972 |
Tables 3 and 4 list the average neural network output for each node under dual- and triple-nuclide cases, where the background case is not considered. This is because the dual- and triple-nuclide cases with the background included can be reduced to single- and dual-nuclide cases, respectively. The 12 values in each row of Tables 3 and 4 represent the average output of the 12 network output nodes for a specific multiple-nuclide case. Based on possible combinations of target nuclides in industrial and medical processes, 16 dual-nuclide cases and 12 triple-nuclide cases were tested. Figure 7 and Fig. 8 illustrate the distribution of the network output for the corresponding nodes under dual- and triple-nuclide cases. The bold numbers in Tables 3 and 4 and the red lines in Fig. 7 and Fig. 8 demonstrate the observations listed in Table 2 and shown in Fig. 6.
| Dual-nuclides | Background | 241Am | 133Ba | 60Co | 137Cs | 152Eu | 131I | 40K | 177Lu | 54Mn | 22Na | 99mTc |
|---|---|---|---|---|---|---|---|---|---|---|---|---|
| 241Am-133Ba | 0.000 | 0.894 | 0.999 | 0.000 | 0.012 | 0.000 | 0.000 | 0.000 | 0.000 | 0.000 | 0.000 | 0.008 |
| 241Am-60Co | 0.000 | 0.855 | 0.000 | 1.000 | 0.000 | 0.000 | 0.000 | 0.000 | 0.000 | 0.000 | 0.000 | 0.000 |
| 241Am-137Cs | 0.000 | 0.806 | 0.002 | 0.000 | 0.987 | 0.000 | 0.010 | 0.000 | 0.000 | 0.000 | 0.000 | 0.000 |
| 241Am-22Na | 0.000 | 0.632 | 0.023 | 0.000 | 0.000 | 0.000 | 0.000 | 0.000 | 0.000 | 0.000 | 1.000 | 0.000 |
| 133Ba-60Co | 0.000 | 0.221 | 1.000 | 1.000 | 0.000 | 0.000 | 0.000 | 0.000 | 0.000 | 0.003 | 0.002 | 0.000 |
| 133Ba-137Cs | 0.000 | 0.286 | 0.693 | 0.000 | 0.788 | 0.000 | 0.084 | 0.000 | 0.004 | 0.000 | 0.000 | 0.020 |
| 133Ba-54Mn | 0.000 | 0.000 | 0.718 | 0.000 | 0.352 | 0.000 | 0.000 | 0.000 | 0.000 | 0.999 | 0.000 | 0.000 |
| 133Ba-22Na | 0.000 | 0.089 | 0.905 | 0.000 | 0.043 | 0.000 | 0.000 | 0.000 | 0.000 | 0.012 | 1.000 | 0.000 |
| 60Co-137Cs | 0.000 | 0.248 | 0.026 | 1.000 | 0.990 | 0.000 | 0.000 | 0.000 | 0.000 | 0.000 | 0.001 | 0.000 |
| 60Co-54Mn | 0.000 | 0.013 | 0.047 | 1.000 | 0.008 | 0.000 | 0.000 | 0.000 | 0.000 | 0.958 | 0.001 | 0.000 |
| 60Co-22Na | 0.000 | 0.000 | 0.101 | 1.000 | 0.034 | 0.000 | 0.000 | 0.000 | 0.000 | 0.229 | 0.911 | 0.000 |
| 137Cs-54Mn | 0.000 | 0.000 | 0.391 | 0.000 | 0.796 | 0.000 | 0.000 | 0.000 | 0.001 | 1.000 | 0.000 | 0.000 |
| 137Cs-22Na | 0.000 | 0.014 | 0.000 | 0.000 | 0.821 | 0.000 | 0.000 | 0.000 | 0.000 | 0.004 | 1.000 | 0.000 |
| 131I-177Lu | 0.000 | 0.119 | 0.217 | 0.000 | 0.216 | 0.000 | 0.707 | 0.000 | 0.699 | 0.000 | 0.000 | 0.337 |
| 177Lu-99mTc | 0.000 | 0.002 | 0.012 | 0.000 | 0.000 | 0.000 | 0.000 | 0.000 | 1.000 | 0.000 | 0.000 | 0.945 |
| 54Mn-22Na | 0.000 | 0.023 | 0.000 | 0.000 | 0.012 | 0.000 | 0.000 | 0.000 | 0.000 | 0.988 | 1.000 | 0.000 |
| Tripe-nuclides | Background | 241Am | 133Ba | 60Co | 137Cs | 152Eu | 131I | 40K | 177Lu | 54Mn | 22Na | 99mTc |
|---|---|---|---|---|---|---|---|---|---|---|---|---|
| 241Am-133Ba-60Co | 0.000 | 0.648 | 0.942 | 1.000 | 0.012 | 0.000 | 0.000 | 0.000 | 0.000 | 0.000 | 0.000 | 0.000 |
| 241Am-133Ba-137Cs | 0.000 | 0.515 | 0.535 | 0.000 | 0.534 | 0.000 | 0.167 | 0.000 | 0.262 | 0.000 | 0.000 | 0.094 |
| 241Am-60Co-637Cs | 0.000 | 0.681 | 0.000 | 1.000 | 0.989 | 0.000 | 0.000 | 0.000 | 0.000 | 0.002 | 0.000 | 0.000 |
| 241Am-54Mn-22Na | 0.000 | 0.900 | 0.000 | 0.000 | 0.000 | 0.000 | 0.000 | 0.000 | 0.000 | 0.998 | 1.000 | 0.000 |
| 133Ba-60Co-137Cs | 0.000 | 0.000 | 0.913 | 1.000 | 0.554 | 0.000 | 0.000 | 0.000 | 0.000 | 0.304 | 0.008 | 0.000 |
| 133Ba-60Co-54Mn | 0.000 | 0.000 | 0.566 | 1.000 | 0.392 | 0.000 | 0.000 | 0.000 | 0.000 | 0.969 | 0.008 | 0.000 |
| 133Ba-60Co-22Na | 0.000 | 0.000 | 0.852 | 0.972 | 0.022 | 0.000 | 0.000 | 0.000 | 0.000 | 0.033 | 0.985 | 0.000 |
| 133Ba-137Cs-54Mn | 0.000 | 0.000 | 0.979 | 0.000 | 0.994 | 0.000 | 0.004 | 0.000 | 0.009 | 1.000 | 0.002 | 0.000 |
| 133Ba-54Mn-22Na | 0.000 | 0.018 | 1.000 | 0.010 | 0.000 | 0.000 | 0.000 | 0.000 | 0.000 | 0.989 | 1.000 | 0.000 |
| 60Co-137Cs-54Mn | 0.000 | 0.000 | 0.095 | 1.000 | 0.512 | 0.000 | 0.000 | 0.000 | 0.000 | 0.979 | 0.023 | 0.000 |
| 60Co-137Cs-22Na | 0.000 | 0.000 | 0.015 | 0.993 | 0.944 | 0.000 | 0.000 | 0.000 | 0.000 | 0.001 | 0.988 | 0.000 |
| 131I-177Lu-99mTc | 0.000 | 0.002 | 0.003 | 0.000 | 0.033 | 0.000 | 0.965 | 0.000 | 1.000 | 0.033 | 0.000 | 0.782 |


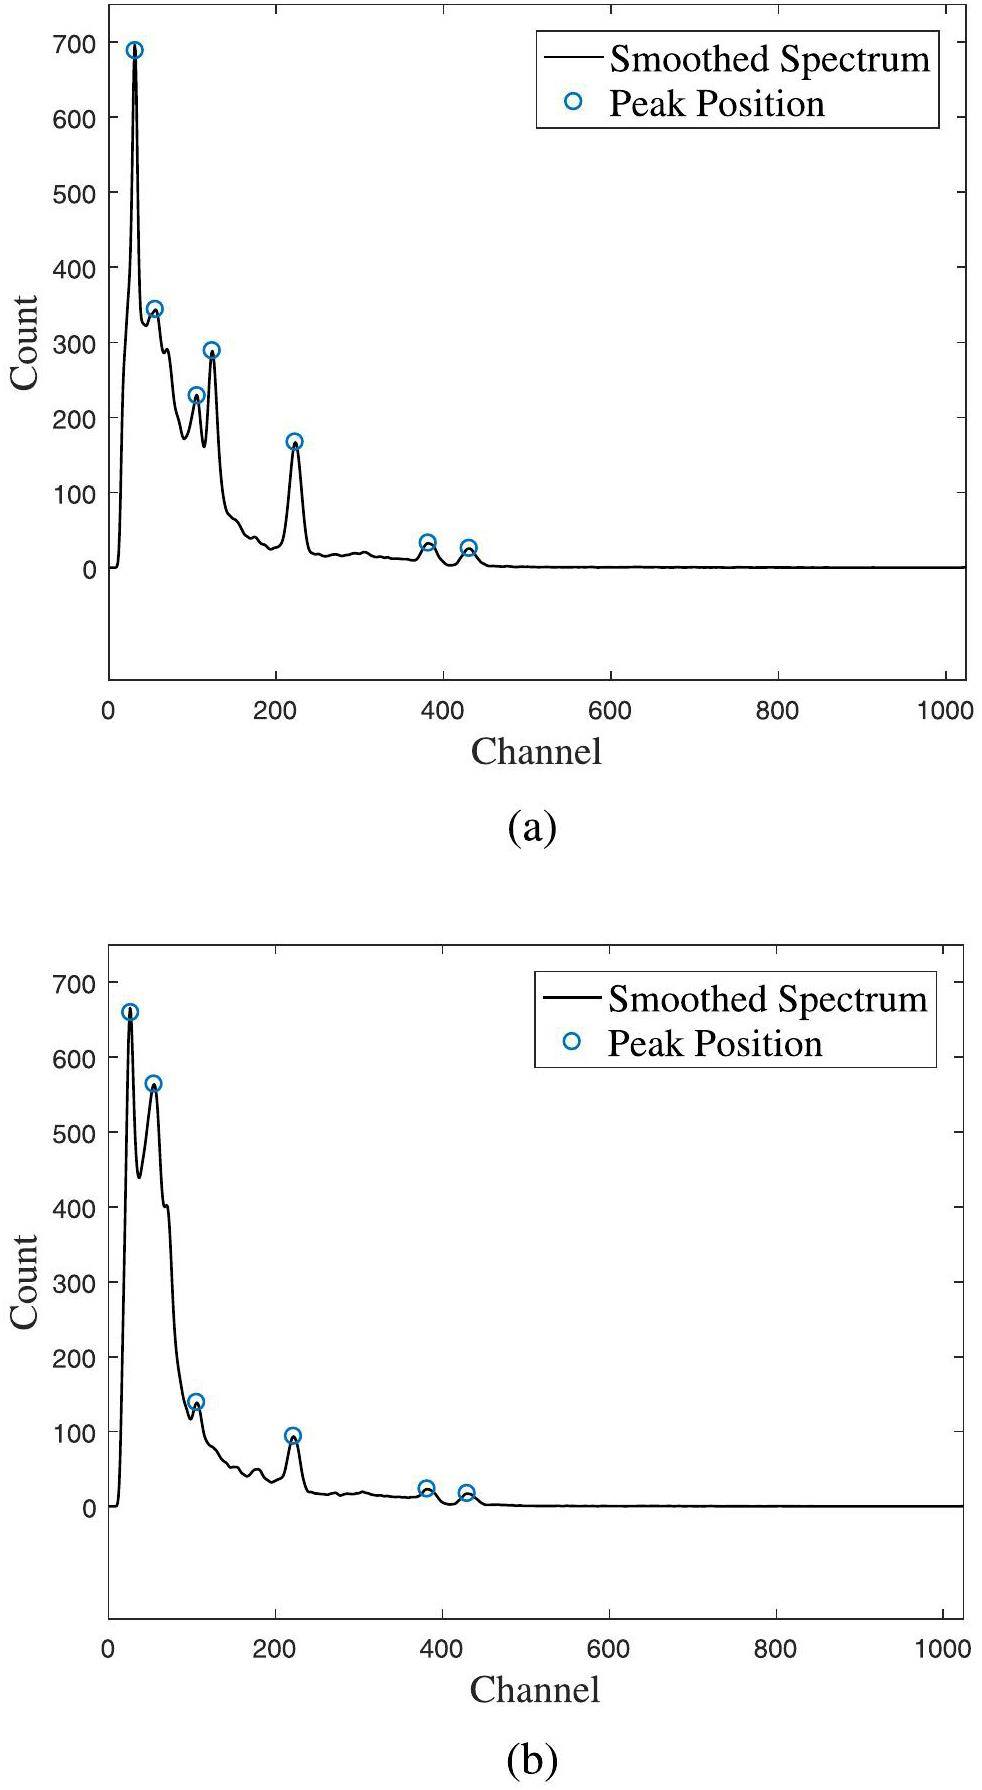
After the identification test using validation datasets, an actual test of the identification method was conducted under unshielded and shielded conditions (using a 10 mm lead brick). To verify the validity and feasibility of the algorithm in scenarios with energy resolution challenges and complex background interference, several types of single, double, and triple nuclides were randomly selected for 100 repeated identification tests under both conditions. All the shielded spectra were excluded from the training datasets, but the nuclides were included in the output layer. Figure 9 illustrates the peak-searching results for unshielded and shielded multiple-nuclide cases. Figure 9a shows peak-searching results for the unshielded 133Ba-60Co-137Cs case, and Fig. 9b shows the results for the shielded case.
discussion
Identification accuracy
As shown in Fig. 6, for single nuclides with similar decay energies, the average output of the corresponding nodes is relatively lower than that for other nuclides. For example, the decay characteristic energies of 364.5 keV and 637.0 keV for 131I are close to the 356.0 keV of 133Ba and the 661.7 keV of 137Cs, indicating that there are small differences between their input vectors after normalization. A similar situation occurs between 241Am, 177Lu, and 99mTc. These small differences are likely to be treated as noise signals, causing a drop in the output of the corresponding nodes. The results in Table 3 show that the outputs of the corresponding nodes are significantly different from those of other nodes.
For the dual-nuclide case results in Fig. 7 and Table 4, and the triple-nuclide case results in Fig. 8 and Table 4, the decline in the output of the corresponding nodes is caused not only by similar decay characteristic energies but also by mutual interference within the dual- and triple-nuclide training datasets. For example, in the 241Am-133Ba-60Co case, the weight of 241Am (normalized characteristic energy value of 241Am) in its input vector is close to zero after normalization because since the normalization process is performed by dividing all the feature input vectors by the largest characteristic energy value in the datasets. The characteristic energy of 241Am and the largest characteristic energy were 63.2 and 1452.1 keV, respectively. This causes a decline and an increase in the 241Am node in the 241Am-133Ba-60Co and 133Ba-60Co cases. Nevertheless, the 12 values of each row in Tables 3 and 4 also show a relatively significant difference between the correct and other nodes, and by choosing an appropriate threshold, a high identification accuracy can be obtained.
Based on the analysis in the table above, the threshold for determining the presence or absence of nuclides was set at 0.4. If the output of a node exceeds 0.4, then it is considered to indicate the presence of the corresponding nuclide, and vice versa. Using this threshold, the Hamming Loss and EMR were calculated as 0.013 and 0.052, respectively. The accuracy of complete identification was 1-EMR=94.8%. Compared to the full-spectrum identification method with an accuracy of 90.0% (considering only six kinds of nuclides) [22], the proposed algorithm demonstrates higher accuracy and a superior ability to identify multiple nuclides. Moreover, as shown in Fig. 9, the full-energy peak positions can be accurately determined in both unshielded and shielded multiple-nuclide cases (133Ba-60Co-137Cs), highlighting the effectiveness of the peak-searching method. After 100 repetitions for each case, the Hamming Loss, EMR, and the accuracy of complete identification for each case with the chosen threshold are listed in Table 5. The total Hamming Loss and EMR were 0.007 and 0.016, respectively, with an overall accuracy of 1 - EMR = 98.4% for the actual test. As shown in Fig. 9b, the energy resolution and complex background interference caused by the shielding can change the shape and characteristics of the peaks, which leads to biased network input. Nevertheless, good identification results were achieved for both unshielded and shielded cases, demonstrating the effectiveness and robustness of the algorithm.
| Single-nuclide | Hamming Loss | EMR |
|---|---|---|
| 241Am | 0.000 | 0.000 |
| 133Ba | 0.000 | 0.000 |
| 133Ba (shielded) | 0.020 | 0.020 |
| 133Ba-60Co | 0.000 | 0.000 |
| 133Ba-60Co (shielded) | 0.015 | 0.030 |
| 60Co-137Cs | 0.000 | 0.000 |
| 60Co-137Cs (shielded) | 0.000 | 0.000 |
| 133Ba-60Co-137Cs | 0.007 | 0.020 |
| 133Ba-60Co-137Cs (shielded) | 0.027 | 0.080 |
This algorithm could be further developed to include additional standard nuclides. Incorporating new standard nuclides typically reduces identification accuracy. This study considered eleven common nuclides and their combinations. To include new sources, their gamma spectra must be measured, or their full-energy peak data directly. These characteristic energies can then be combined with those of existing nuclides to update the training datasets. The directly used full-energy peak data should account for uncertainties based on detector performance (e.g., peak drifting or resolution changes). The output layer should also be expanded to include all considered nuclides. Expanding the number of output nodes slightly increases resource consumption and reduces the identification accuracy of the chip. However, previous neural network identification methods require expanding the output layer to include not only the considered nuclides but also their combinations, leading to significant chip resource consumption. The decrease in identification accuracy primarily depends on the proximity of characteristic energies of the new nuclides to those of existing nuclides; greater differences result in smaller effects.
Complexity analysis
Time and space complexities are fundamental concepts in algorithm analysis and are used to describe the time and space resources required by an algorithm during execution.
Time complexity refers to the computational work needed to execute an algorithm and reflects the growth in execution time as input size increases. Specifically, the time complexity is expressed as a function that relates the number of basic operations (e.g., addition, comparison, and assignment) performed by an algorithm to the input size, typically described using the notation O(·). Space complexity refers to the amount of memory required to execute an algorithm and reflects the growth in required storage space as the input size increases. Similar to time complexity, space complexity is described using O(·).
In this study and other related studies, the time and space complexities of algorithms primarily stem from the forward computation of neural networks and convolutional computations. Since neural network training is typically performed on high-performance computers, only the time and space complexities during the prediction process were considered. The time and space complexities of the designed algorithm are given by
Conclusion
In this study, the gamma spectra of 12 common nuclides were measured using a portable gamma spectrometer. Features from these spectra were extracted and combined to generate feature vectors of multiple nuclides. Considering the influence of spectrum drift, the extracted spectral datasets were expanded within a range of ±2%. Finally, a low-consumption, robust nuclide identification method capable of execution within 2 s on an ARM chip was developed. According to experimental results, for a dose rate of d≈0.5 μSv/h and a measurement time of tm=60 s, the identification accuracy of the proposed model reached at least 94.8%. Furthermore, the actual test achieved an identification accuracy of 98.4%, meeting the basic requirements for nuclide screening and monitoring. In future work, the identification speed of the method can be further improved. Real-time spectra or pulses could be processed using deep reinforcement learning methods to enable early warnings and nuclide identification.
Airborne radiation mapping: overview and application of current and future aerial systems
. Int. J. Remote Sens. 37, 5953-5987 (2016). https://doi.org/10.1080/01431161.2016.1252474A comparative study of machine learning methods for automated identification of radioisotopes using NaI gamma-ray spectra
. Nucl. Eng. Technol. 53, 4072-4079 (2021). https://doi.org/10.1016/j.net.2021.06.020Loss of offsite power (LOOP) accident analysis by integration of deterministic and probabilistic approaches in Bushehr-1 VVER-1000/V446 nuclear power plant
. Nucl. Sci. Tech. 33, 56 (2022). https://doi.org/10.1007/s41365-022-01044-8A novel approach for feature extraction from a gamma-ray energy spectrum based on image descriptor transferring for radionuclide identification
. Nucl. Sci. Tech. 33, 158 (2022). https://doi.org/10.1007/s41365-022-01150-7Data for training and testing radiation detection algorithms in an urban environment
. Sci. Data. 7, 1-6 (2020). https://doi.org/10.1038/s41597-020-00672-2Evaluation of source identification method based on energy-weighting level with portal monitoring system using plastic scintillator
. J. Radiat. Protection Res. 45, 117-129 (2020).https://doi.org/10.14407/JRPR.2020.45.3.117Radiological characterization of building materials used in Malaysia and assessment of external and internal doses
. Nucl. Sci. Tech. 30, 46 (2019). https://doi.org/10.1007/s41365-019-0569-3High-accuracy differential resonant pressure sensor with linear fitting method
. J. Micromech. Microeng. 31,Estimation of 2-D DOA for coherently distributed sources with two parallel linear arrays
. Chin. J. Radio. 25, 1123-1129 (2010).https://doi.org/10.1016/S1876-3804(11)60008-6The symmetric zero-area conversion adptive peak-seeking method research for LIBS/Raman spectra
. Spectrosc. Spect. Anal. 33, 438-443 (2013).https://doi.org/10.3964/j.issn.1000-0593(2013)02-0438-06Methods for obtaining characteristic γ-ray net peak count from interlaced overlap peak in HPGe γ-ray spectrometer system
. Nucl. Sci. Tech. 30, 11 (2019). https://doi.org/10.1007/s41365-018-0525-7A novel method for gamma spectrum analysis of low-level and intermediate-level radioactive waste
. Nucl. Sci. Tech. 34, 87 (2023). https://doi.org/10.1007/s41365-023-01236-wSimulation method of airborne gamma radiation detector response based on the equivalent transformation
. J. Instrum. 19,The use of energy windowing to discriminate SNM from NORM in radiation portal monitors
. Nucl. Instrum. Methods Phys. Res. A, Accel. Spectrom. Detect. Assoc. Equip. 560, 373-387 (2006).https://doi.org/10.1016/j.nima.2006.01.053Radionuclide identification algorithm for organic scintillator-based radiation portal monitor
, Nucl. Instrum. Methods Phys. Res. A, Accel. Spectrom. Detect. Assoc. Equip. 849, 41-48 (2017). https://doi.org/10.1016/j.nima.2017.01.009Physics-based detection of radioactive contraband: A sequential bayesian approach
, IEEE. T. Nucl. Sci. 56, 3694-3711 (2009).https://doi.org/10.1109/TNS.2009.2034374Numerical study on the sequential Bayesian approach for radioactive materials detection
, Nucl. Instrum. Meth. A. 697, 107-113 (2013).https://doi.org/10.1016/j.nima.2012.09.031A Bayesian nuclide identification algorithm based on the energy spectrum
. IEEE Trans. Nucl. Sci. 70, 831-839 (2023). https://doi.org/10.1109/TNS.2023.3268637Fast nuclide identification based on a sequential Bayesian method
. Nucl. Sci. Tech. 32, 143 (2021).https://doi.org/10.1007/s41365-022-01011-3Spectrometry analysis based on approximation coefficients and deep belief networks
. Nucl. Sci. Tech. 29, 69 (2018). https://doi.org/10.1007/s41365-018-0402-4Neural network-based nuclear charge Z identification from ionization chamber waveforms of low-energy heavy ions
. Nucl. Instrum. Meth. B. 542, 176-182 (2023). https://doi.org/10.1016/j.nimb.2023.06.014Nuclide identification algorithm for the large-size plastic detectors based on artificial neural network
. IEEE Trans. Nucl. Sci. 69, 1203-1211 (2022). https://doi.org/10.1109/TNS.2022.3173371Novel algorithm for detection and identification of radioactive materials in an urban environment
. Nucl. Sci. Tech. 34, 154 (2023). https://doi.org/10.1007/s41365-023-01304-1Nuclide identification algorithm for Polyvinyl Toluene scintillation detector based on Deep Neural Network
. J. Nucl. Sci. Technol. 12, 46-55 (2022).A new radionuclide identification method for low-count energy spectra with multiple radionuclides
. Appl. Radiat. Isotopes. 185,Novel radionuclides identification method based on Hilbert–Huang Transform and Convolutional Neural Network with gamma-ray pulse signal
. Nucl. Instrum. Meth. A. 1051,Application of convolutional neural networks in identification of complex nuclides
. Trans. Micro. Tech. 38, 154-156 (2019). (in Chinese)Research of nuclide identification method based on background comparison method
. Appl. Radiat. Isotopes, 192,Multi-radioisotope identification algorithm using an artificial neural network for plastic gamma spectra
. Appl. Radiat. Isotopes. 147, 83-90 (2019). https://doi.org/10.1016/j.apradiso.2019.01.005Rapid radionuclide identification algorithm based on the discrete cosine transform and BP neural network
. Ann. Nucl. Energy. 112, 1-8 (2018). https://doi.org/10.1016/j.anucene.2017.09.032Development of a radionuclide identification algorithm based on a convolutional neural network for radiation portal monitoring system
. Radiat. Phys. Chem. 180,Radionuclide identification method for NaI low-count gamma-ray spectra using artificial neural network
. Nucl. Eng. Technol. 54, 269-274 (2022). https://doi.org/10.1016/j.net.2021.07.025ADAM: A method for stochastic optimization
, arXiv. 1412.6980 (2014).Design of CsI(TI) detector system to search for lost radioactive source
. Nucl. Sci. Tech. 30, 132 (2019). https://doi.org/10.1007/s41365-019-0658-3Nuclide identification algorithm based on K–L transform and neural networks
. Nucl Instrum Meth A, 598, 450-453 (2009). https://doi.org/10.1016/j.nima.2008.09.035Convolutional neural networks for challenges in automated nuclide identification
. Sensors, 21, 5238 (2021). https://doi.org/10.3390/s21155238Rapid nuclide identification algorithm based on convolutional neural network
. Ann. Nucl. Energy. 133, 483-490 (2019). https://doi.org/10.1016/j.anucene.2019.05.051The authors declare that they have no competing interests.


