Introduction
In deep space exploration missions, the provision of stable energy in complex and harsh environments, without human intervention, is crucial. The use of chemical energy on spacecraft requires a substantial amount of mass and space. Solar energy is highly influenced by the planetary environment and distance from the sun. In deep space, factors such as sand and dust can hinder the effectiveness of solar panels, limiting their potential for exploration in these conditions. Space nuclear reactors offer several advantages, including small size, high power density, independence from sunlight, and long operational life. Consequently, nuclear reactors are an ideal energy source for future space missions, such as deep space exploration and the development of star bases. Over the past 50 years, the United States has successfully launched 43 nuclear power electric systems on space missions [1]. Additionally, the advancement of space nuclear power research played a key role in the launch of the Strategic Defense Initiative (SDI) [2]. The lithium-cooled fast reactor (SP-100) was designed for various space thrusters, making nuclear power an important energy source for spacecraft [3]. The Kilowatt Reactor Using Stirling Technology (KRUST) project successfully demonstrated the first fully tested space nuclear fission reactor [4]. During the same period, Russia conducted extensive and in-depth research on space nuclear power, and successfully launched the TOPAZ-I nuclear power supply with in-orbit applications. Building on this progress, the development of TOPAZ-II followed, and ground testing of a full-scale prototype was successfully completed [5]. Leveraging years of research and engineering experience, the Russian Federal Space Agency outlined a development plan for a megawatt-class space nuclear-powered aircraft designed for interplanetary manned and unmanned missions. The latest European policy on the field of space nuclear power mainly focuses on the megawatt-class International Space Nuclear Power Propulsion spacecraft for 2030-2040, primarily supporting the development of three international cooperation projects (DiPoP, DEMOCRITOS, and MEGAHIT). In China, numerous researchers have conducted neutronics and thermal-hydraulic numerical simulations of space reactors. Different conceptual designs of space reactors, such as the space reactor with Stirling engine [6, 7], heat pipe cooled space power system with thermal-electric conversion units [8], megawatt-class gas-cooled space reactor [9, 10], and dual drum-controlled space molten salt reactor [11], have been proposed. Due to rocket launch loading restrictions, achieving high power density and long operating life while simultaneously minimizing the volume and mass of both the reactor and its radiation shield is difficult. Another challenge is the unpredictable environmental disruptions and long-distance communication delays in space missions. Sudden faults cannot be solved through remote intervention, and the procedures to for resolving these issues via autonomous control are highly complex, requiring exceptional reliability.
To meet safety, reliability, survivability, and longevity requirements of space missions, automatic control is a key technology in the design of space reactors. The main requirement for nuclear reactor operation is to maintain stable control performance under different operating conditions. However, space missions face unpredictable environmental disruptions and long-distance communication delays. Thus, automatic control process and decision-making need be implemented, through complex control systems, to reduce human intervention. Therefore, achieving an optimal design for the control system in the presence of environmental uncertainties is important for space reactors with remote deployment capabilities. However, the transient characteristics and control mechanisms of space reactors differ substantially from traditional ground-based nuclear reactors, presenting new challenges in designing control systems that account for uncertainty quantification. On one hand, system model uncertainty arises from both theoretical simulation approximations and empirical correlation fitting during the experimental process. On the other hand, the components of the space reactor will undergo multi-degree of freedom movements such as ups, downs, swings, and tilts, in the variable space environment. This leads to parameter uncertainty in the reactor neutronics and thermal-hydraulics model. Simultaneously, the sensors and actuators in the control system can introduce additional uncertainties due to environmental disturbances, as shown in Fig. 1. The uncertainties in the dynamic model and control system of the space reactor can cause the original controllers to deviate from the optimal state, potentially leading to system instability. At a minimum, this results in control performance reduction. In severe cases, if design flaws are present, dynamic system uncertainties could lead to loss of spacecraft power, resulting in catastrophic consequences. Therefore, conducting uncertainty coupling analysis of the dynamic model and control system for the space reactor is crucial.
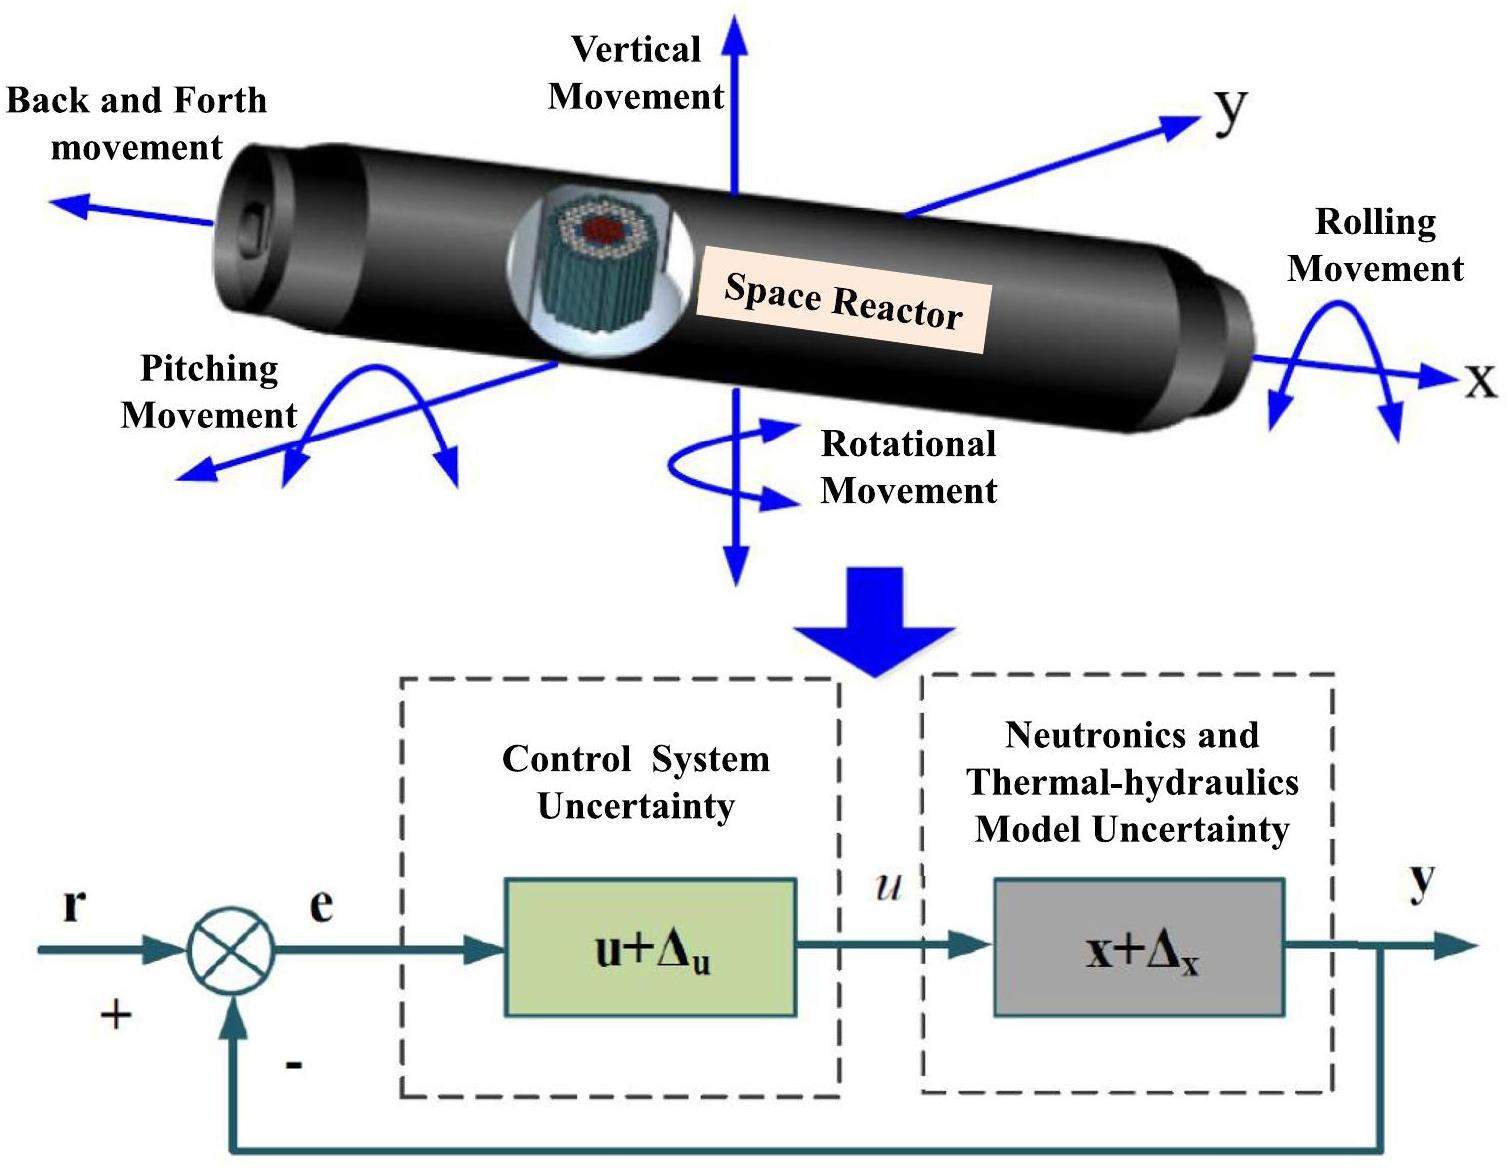
Under the guidance of the U.S. Nuclear Regulatory Commission and OECD/NEA, various countries have proposed and developed different uncertainty analysis tools for nuclear energy systems. The main methods for uncertainty analysis in nuclear energy systems are as follows: CASU (United States), KYADJ (China), AEAW (United Kingdom), ENUSA (Spain), IPSN (France), GRS (Germany), and UMAE (Italy) [12-15]. Among these methods, the GRS algorithm can be applied to any nuclear engineering calculation without additional code modification, rendering it suitable for uncertainty quantification analysis of dynamic systems [16]. In addition, the number of samples required for the uncertainty calculation is solely determined by the set tolerance limit and confidence level. Thus, the cost of uncertainty quantification is relatively low, making it widely used in practical nuclear engineering applications. Current uncertainty studies in nuclear energy systems mainly focus on the uncertainties associated with reactor neutronics parameters such as the reaction cross-section, prompt fission spectrum, scattering angle distribution, and neutron kinetics parameters [17-20]. In contrast, some research focuses on the uncertainty analysis of thermal-hydraulics parameters, including thermal physical properties and heat transfer coefficients [21-24]. He et al. proposed an uncertainty quantification methodology for model parameters in sub-channel codes using Markov Chain Monte Carlo (MCMC) sampling [25]. Additionally, researchers conduct uncertainty analysis on the coupling parameters between reactor neutronics and thermal-hydraulics [26-28]. Several researchers have also conducted uncertainty analysis on non-nuclear powered aerospace vehicles [29]. However, research on the uncertainty of coupling parameters between the dynamic model and control system in nuclear energy systems is still lacking, as shown in Fig. 1. In particular, studies on uncertainty quantification analysis and controller optimization design based on uncertainty dynamic systems remain insufficient.
Currently, space reactor design does not adequately consider the impact of system parameter uncertainty on control system performance. Existing research primarily focuses on controller design for deterministic dynamic systems. For example, Alvarez-Ramirez presented the PI controller of the TOPAZ-II space reactor [30]. Shtessel designed a sliding mode controller for the TOPAZ-II space reactor, and simulation results showed an improvement in system control performance [31]. A model predictive controller for the SP-100 space reactor was designed to track the target power [32]. Zeng et al. designed a fuzzy-PID controller for reactor core power based on a nonlinear model of the space reactor [33]. Ning et al. proposed a control strategy for control rods and reflector blocks to realize reactivity insertion [34]. Li et al. evaluated the control characteristics of a space reactor closed Brayton cycle system [35]. Zhao et al. proposed an axial power distribution control for a space reactor based on nonlinear model [36]. Ma et al. designed a cascade control system for the space thermionic nuclear reactor based on the developed state-space model [37, 38]. However, traditional controllers struggle to adapt to power regulation in uncertainty systems and are unable to achieve optimal control performance. Therefore, considering the system uncertainty and time-varying characteristics of space reactors, multi-objective intelligent optimization methods can be applied to controller design of uncertainty systems to improve the adaptive control capabilities of the space reactor. Compared to controller optimization designs that rely on manual experience, the Non-dominated Sorting Genetic Algorithm (NSGA-II) method is highly effective for solving multi-objective optimization problems [39]. Owing to the advantage of low computational complexity and fast acquisition of global optimal solution, this method has been applied to the controller optimization design of small pressurized water reactors [40].
Therefore, in this study, we focused on the SP-100 space reactor system. A comprehensive dynamic model of the whole space reactor system was developed, including the reactor neutron kinetics model, reactivity control model, reactor heat transfer model, heat exchanger model, and thermoelectric conversion model. An electrical power control system was designed based on the developed dynamic model. The GRS method was used to quantitatively calculate the uncertainty of coupling parameters for the neutronics, thermal-hydraulics, and control system of the space reactor. The Spearman correlation coefficient was applied for sensitivity analysis of system input parameters to output parameters. To analyze the impact of system uncertainty on the dynamic characteristics of the space reactor, two typical transient conditions were selected for simulation, including Uncontrolled External Load Variation (UELV) and Uncontrolled Reactivity Insertion (URI). The NSGA-II method was employed to optimize the controller parameters based on the uncertainty system to obtain optimal control performance. Two typical transient simulations were used to evaluate the adaptive ability of the optimized controller to uncertain systems, including 100% FP to 90% FP step load reduction transient and 5% FP/min linear variable load transient.
Dynamic model of the whole space reactor system
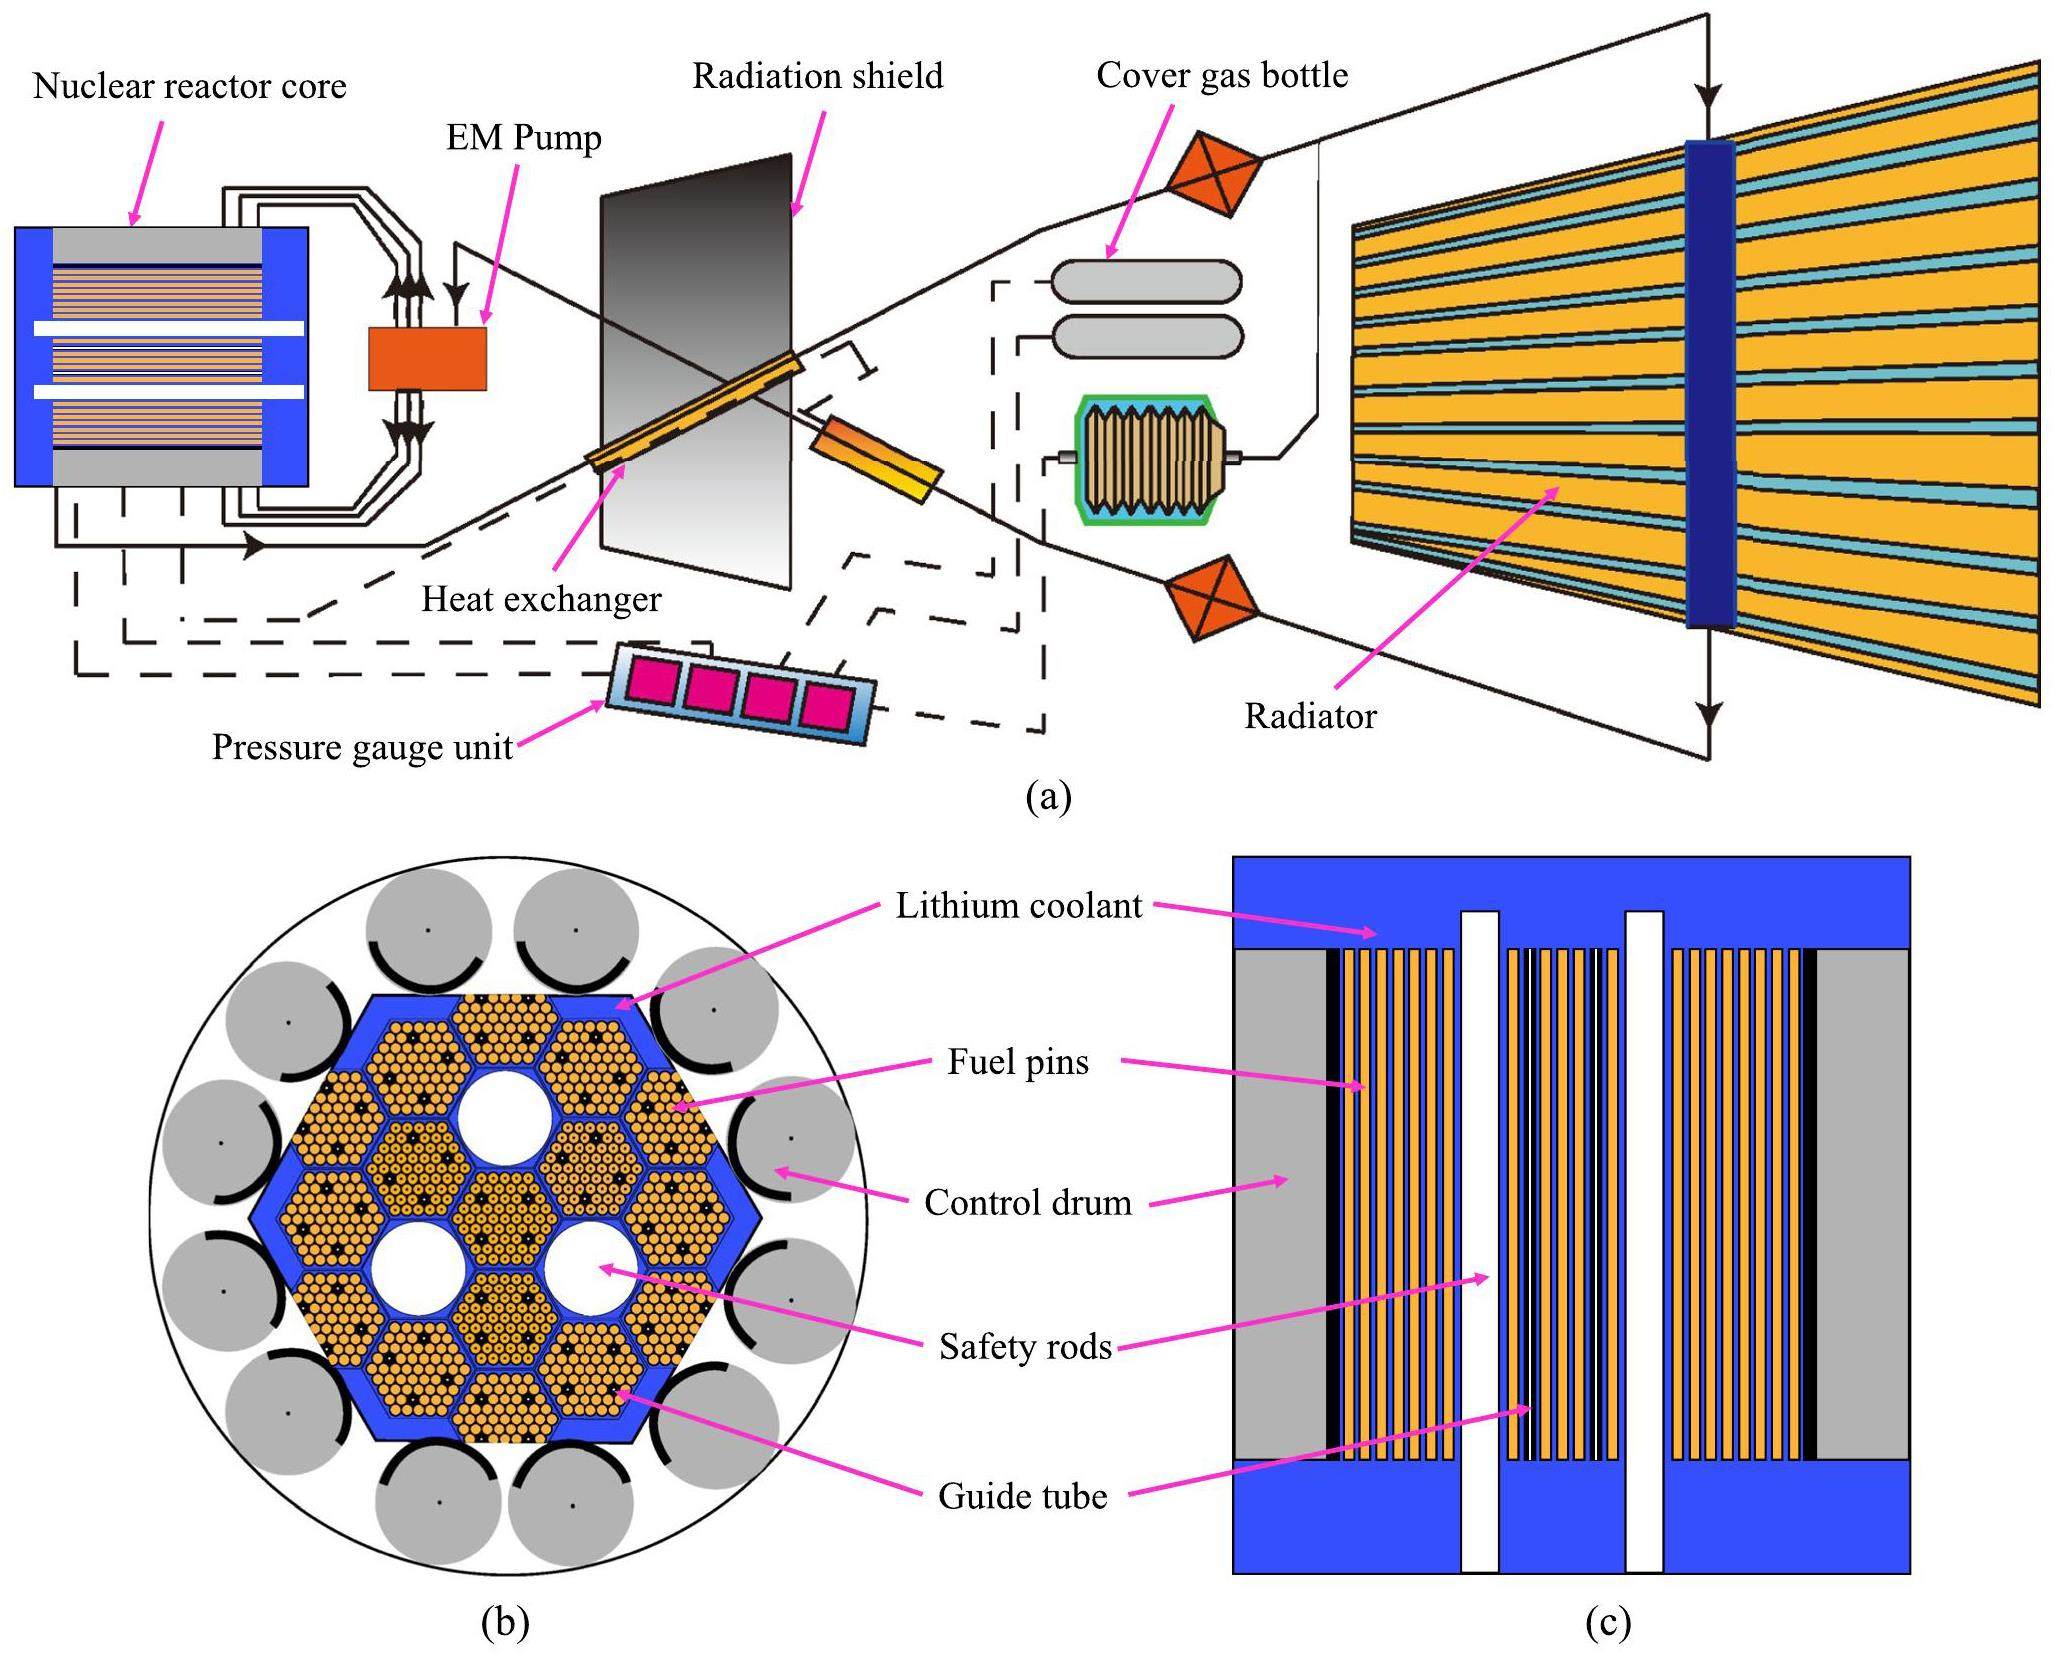
The SP-100 space reactor was adopted as the research object to conduct uncertainty analysis [41]. This nuclear power plant is a lithium-cooled fast neutron reactor coupled with a Thermal-Electric (TE) conversion, which dissipates waste heat into space via a radiator, as shown in Fig. 2. The system parameter values of the reactor are presented in Table 1. High concentration uranium nitride was used as the nuclear fuel, enabling the reactor to achieve a long operating cycle. Lithium is employed as a heat carrier due to its excellent thermal conductivity and high boiling point. The nuclear power was regulated using a boron carbide control drum. The heat generated by the nuclear reactor was transferred through liquid lithium, pumped by an electromagnetic (EM) pump, while the main Heat eXchanger (HX) serves as the interface between the main heat transfer system and the energy conversion system [42]. The EM pump transports the main coolant from the reactor core to the tube bundle of the main HX. The high-temperature coolant is then distributed to each flow channel of the HX. Approximately 480 thermoelectric conversion units are installed on the surface of each channel to transfer energy to the TE device. The second coolant loop transfers waste heat from the TE device to a thermal radiator, effectively dissipating the heat into space.
| Parameters | Values |
|---|---|
| Height of reactor core active zone (m) | 0.35 |
| Fuel rod diameter (m) | 7.62×10⁻³ |
| Assembly central distance (m) | 5.4×10⁻² |
| Total delayed neutron fraction (pcm) | 727 |
| Average neutron generation time (s) | 1.55×10⁻⁷ |
| Fuel Doppler feedback coefficient | 2.4×10⁻⁷ |
| Fuel temperature feedback coefficient (K-1) | -1.22×10⁻⁵ |
| Cladding temperature feedback coefficient (K-1) | 1.2×10⁻⁷ |
| Coolant temperature feedback coefficient (K-1) | -3.25×10⁻⁶ |
| Reactor core coolant flow rate (kg/s) | 14.1 |
| Total radiator surface area (m2) | 98.5 |
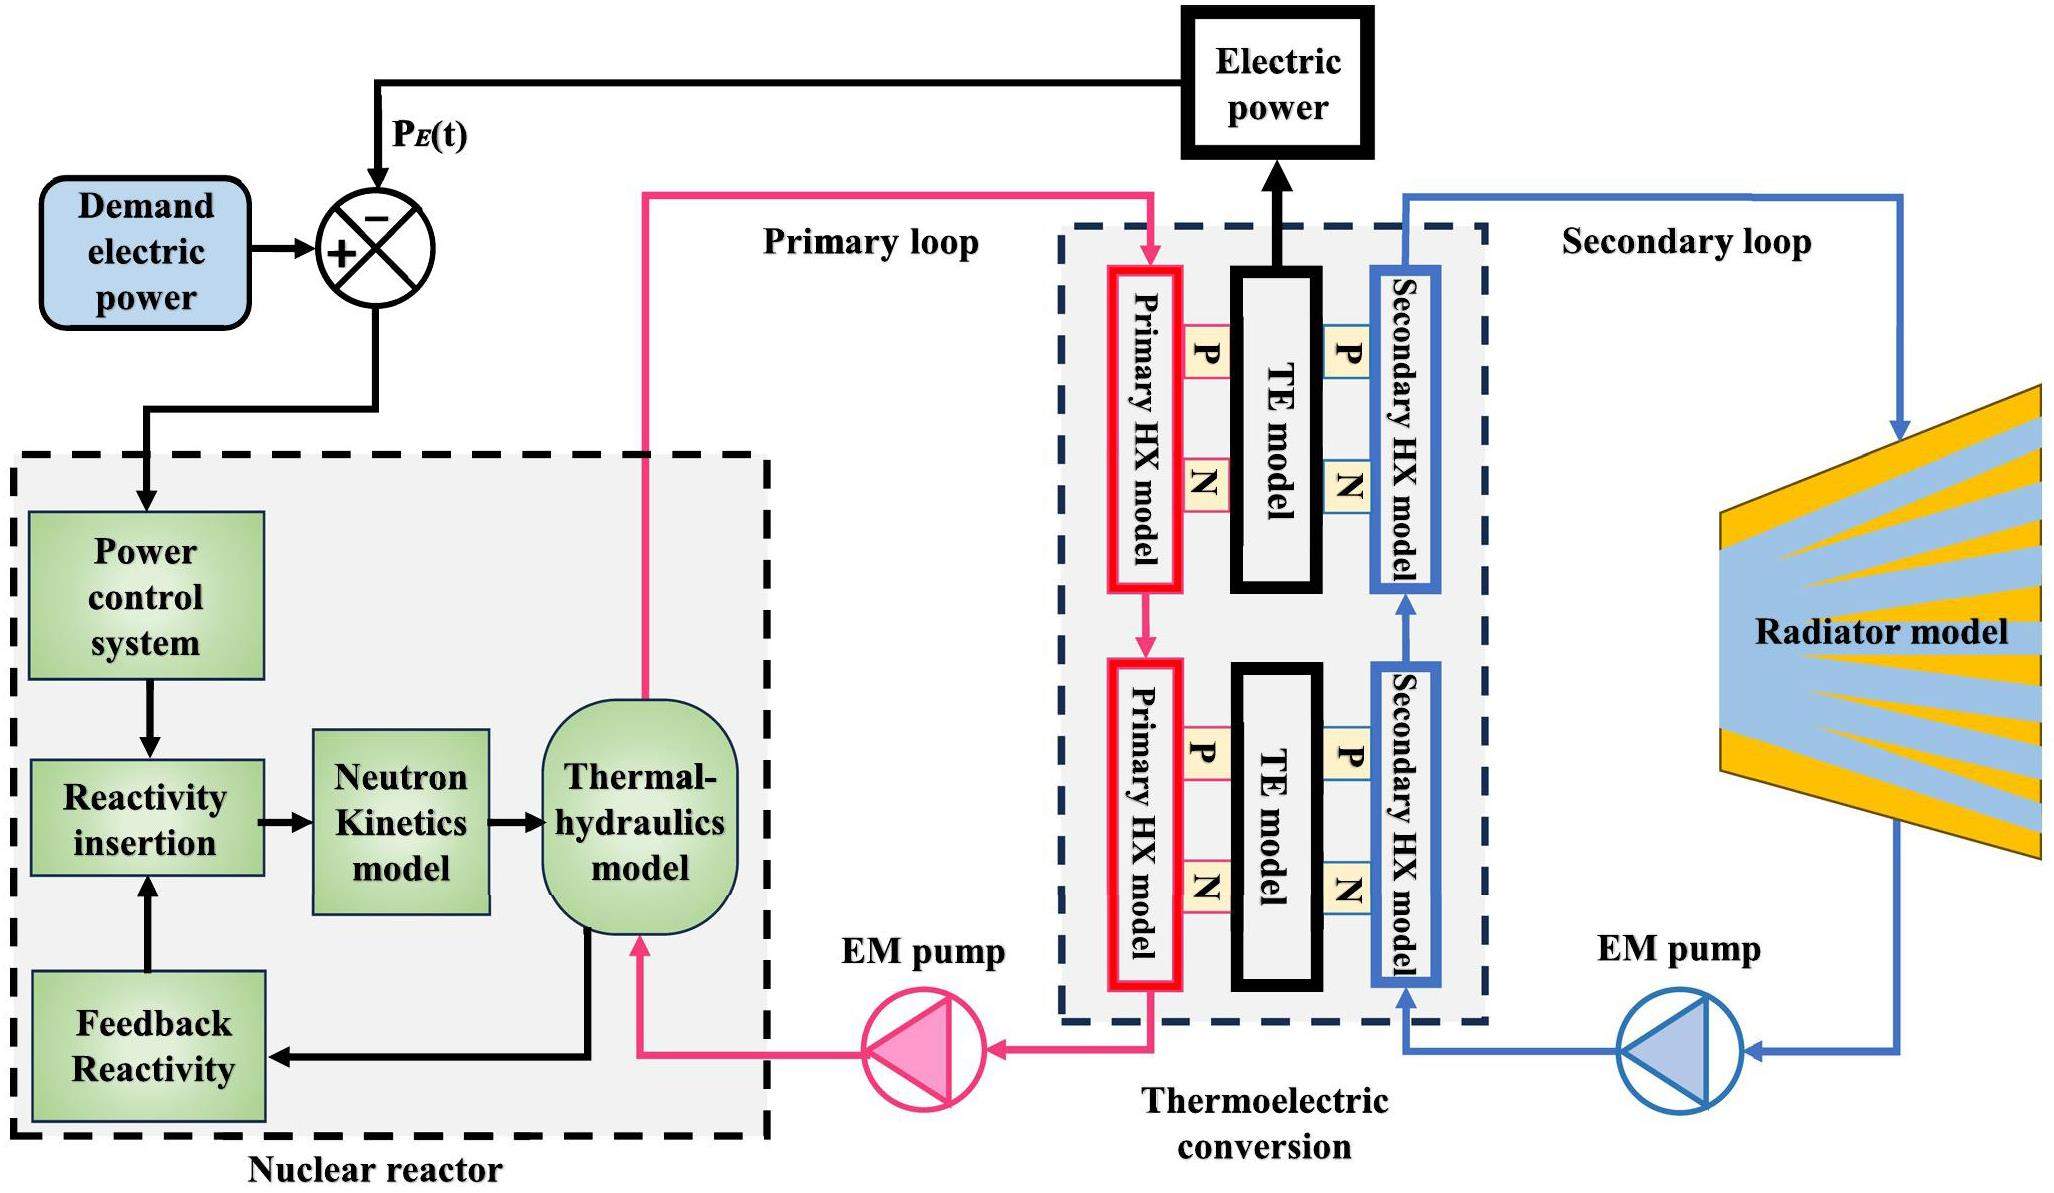
A lumped parameter simulation model was developed based on the SP-100 system, including the reactor neutron kinetics model, reactivity control model, reactor core heat transfer model, heat exchanger model and thermoelectric conversion model, as shown in Fig. 3. A system simulation platform was developed based on the dynamic model of the space reactor.
Reactor core model
Neutron kinetics model
The point reactor kinetics model, with six delayed neutron groups, is used to illustrate the relationship between nuclear reactor power and reactivity variation. This is given by the Eqs. (1)–(2).
Reactivity control mechanism
The developed model incorporates an external reactivity control mechanism based on the stepper motor control drum system. This system allows for rotation (range: 0 to 180 degrees) of the control drum shaft. The control voltage is converted into a set of 27 V rectangular impulses, with the frequency adjustable from 0 to 1.33 Hz. These impulses subsequently translate into discrete movements of the control drum-connected shaft. During the reactor power control process, all control drums work together to adjust the reactivity of the reactor core to ensure that the variations of reactor power are distributed symmetrically, potentially reducing distortion of the spatial distribution of reactor power [31, 32]. The precise position of the stepper motor shaft is determined using Eq. (4).
Reactor heat transfer model
According to the principle of conservation of energy, a simplified heat transfer model of reactor core was developed to calculate fuel, cladding, and coolant temperature. The model can be described by the following Eqs. (6)–(8) [42].
Heat exchanger model
In the primary HX model, the primary fluid flows into the hot header and is distributed into individual flow channels of the HX. The thermal model of the primary HX is coupled with an energy conversion model of TE. The heat removed from the primary HX depends on the temperature of the hot shoe in the TE unit. The heat source of the TE model is determined by the fluid temperature of the HX primary loop. Approximately, 480 TE units were attached to the surface of each HX flow channel. The secondary HX coupled with the cold shoe of the TE unit is similar to the primary loop. The energy conservation equations of these two HX loops are given as the Eqs. (9)–(10).
Thermal electric model
In the space reactor design, each TE unit is composed of two semiconductors, one P-type semiconductor and one N-type semiconductor. If the physical properties are independent of temperature, Thomson's effect could be disregarded. Assuming further that the P-type and N-type semiconductors possess identical physical properties, and that the temperatures of TE hot shoe and cold shoe remain constant. The temperature distributions obtained from the governing equation with the specified boundary conditions are expressed as the Eqs. (11)–(13).
The efficiency of thermoelectric conversion η could be described by the following Eq. (14).
Radiator model
A lumped parameter model is applied to describe heat removal by the radiator. The time-varying temperature of radiator TS,in could be described as the following Eq. (15).
Uncertainty quantification and multi-objective optimization methods
The influence of system uncertainty on the dynamic characteristics was analyzed by uncertainty quantification of the coupling parameters of the neutronics, thermal-hydraulics, and control system for the space power reactor. The GRS method was used for system uncertainty analysis, and the Spearman correlation coefficient was adopted for real-time sensitivity analysis. According to the uncertainty quantification results, the controller parameters are optimized based on the NSGA-II method to ensure that the space reactor obtains optimal control performance and maintains stable and safe operation while accounting for system uncertainty.
GRS uncertainty quantification method
To assess the parameter uncertainty of the space reactor, the GRS method was employed for the quantification calculation of system uncertainty [16]. The WILKS formula was used to evaluate the tolerance limit of the confidence interval. It utilizes probabilistic and statistical principles to determine the minimum amount of computation required to estimate the confidence interval tolerance limit at a specific confidence level. The upper or lower bound of the unilateral confidence tolerance limit could be obtained with a limited amount of computation, thus assessing the security domain of the analyzed object. This method offers several advantages that make it widely applicable to uncertainty analysis of nuclear energy system. First, the amount of required computation is determined solely by the set uncertainty tolerance limits and confidence levels, rather than the number of uncertainty parameters selected. This ensures reliable computational results while keeping the evaluation process within reasonable computational costs. Second, the values of the uncertainty parameters vary with each code calculation. By analyzing how changes in these parameters affect the output, their impact on these computational results could be accurately. This integrated approach to uncertainty analysis makes the evaluation more comprehensive and reliable. An additional advantage over traditional methods is that there is no need to rank the input parameters, simplifying the process. Since the number of calculations is independent of the number of uncertain parameters, this approach can substantially reduce computational costs and improve calculation efficiency.
In this study, the Wilks statistical method was used to determine the sample number. The law of multivariate distributions was adopted in the Wilks formula and we constructed an arbitrary order two-sided confidence probability density function by neglecting higher order infinitesimal terms, as given by the Eq. (16).
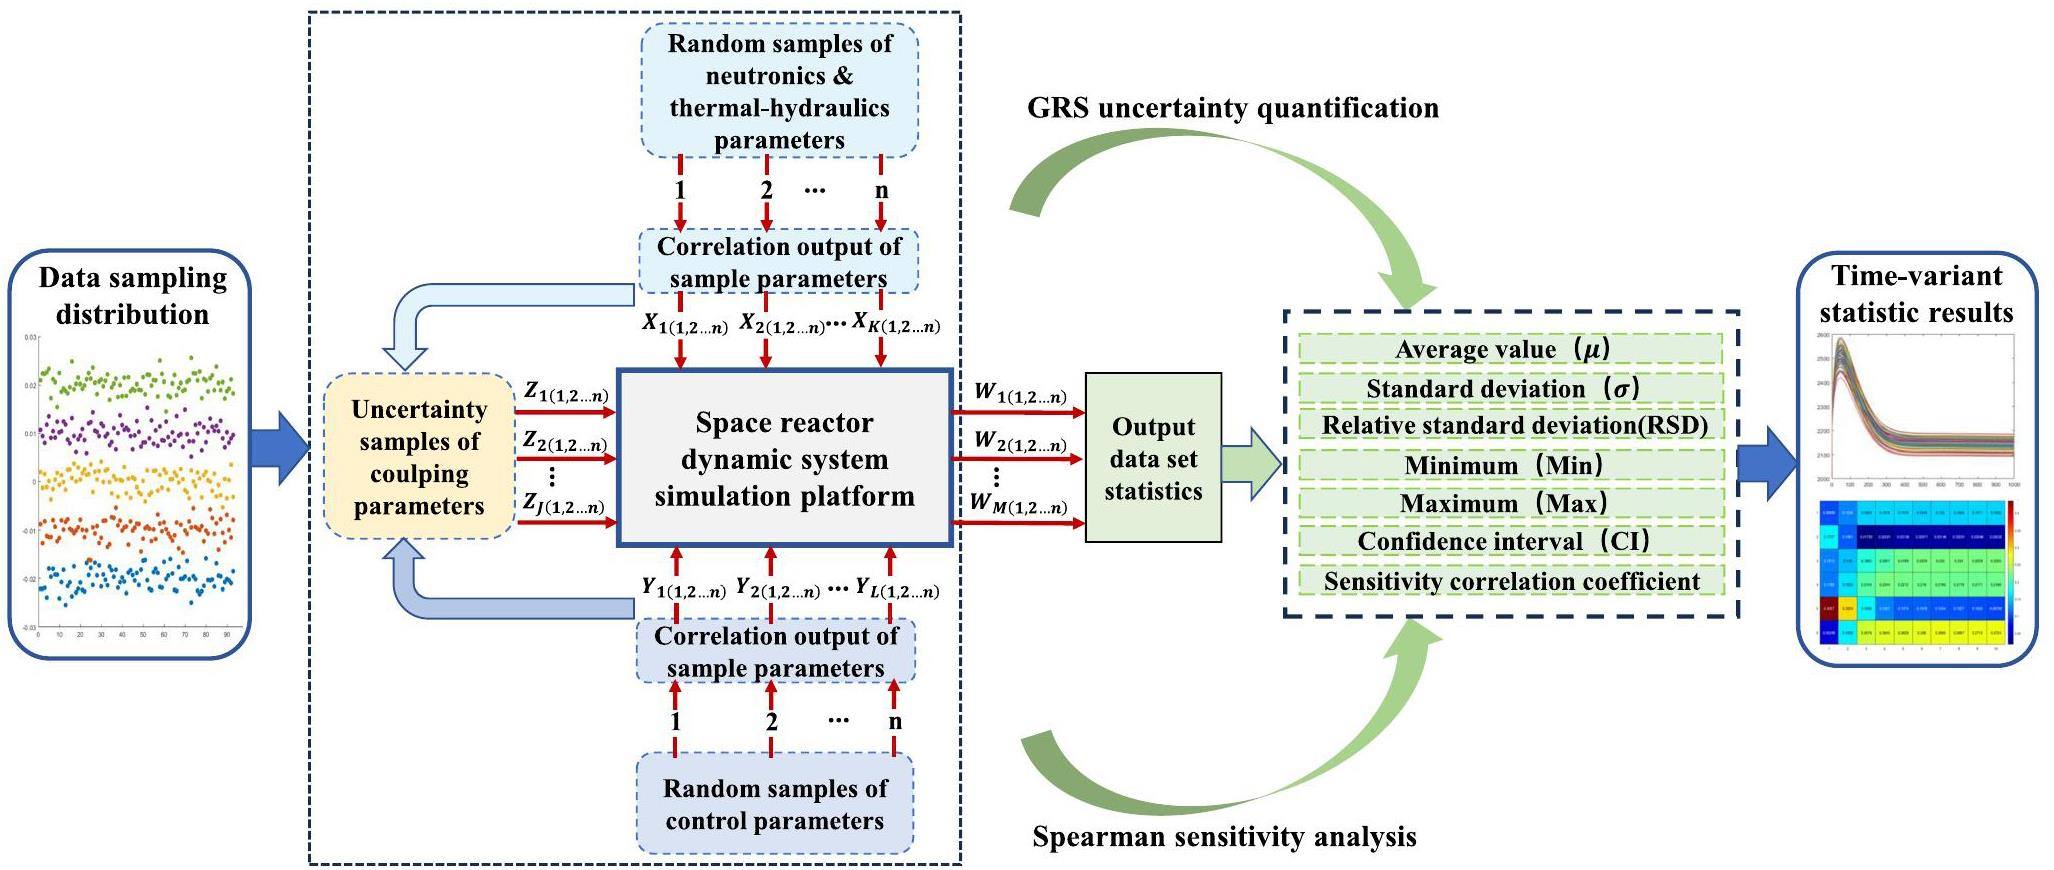
In order to satisfy the "95/95 criterion", the GRS method requires 93 sets of samples in the two-sided tolerance interval. Through the uncertainty analysis of the best estimation procedure, not only is the number of calculations required by the procedure independent of the number of uncertainty parameters, but all uncertainty parameters can be sampled and calculated simultaneously. This simplifies the process of quantitative uncertainty calculation. The uncertainty quantification calculation of the coupling parameters for the neutronics, thermal-hydraulics, and control systems of the space power reactor was conducted, as shown in Fig. 4. To ensure the quality of random samples, a correlation analysis between each sample was conducted before the randomly generated samples were input into the uncertainty simulation platform. If the correlation between samples was high, random re-sampling was performed again.
Spearman sensitivity analysis method
The Spearman sensitivity value is a nonparametric ranking statistical coefficient that is independent of the data distribution. For two random variables X and Y, the rank correlation coefficient r(X,Y) is given as the Eq. (23).
To calculate the sensitivity of the input parameters of the dynamic system to the output parameters, the Spearman correlation coefficient was calculated at time intervals to obtain real-time sensitivity analysis results of the dynamic system, as shown in Fig. 4.
Multi-objective optimization method
NSGA-II algorithm
For the NSGA-II algorithm calculation, crowding-distance and crowding selection maintained population diversity. The elite strategy rapidly increases population quality. Crowding distance was used to measure the clustering degree of individuals (solutions) within the same ranking hierarchy, as a criterion to maintain population diversity. It is represented by calculating the absolute sum of the distance differences between an individual and an adjacent individual on each target. The crowding-distance can quantify the degree of dispersion among individuals within the same ranking hierarchy, avoiding excessive concentration of individuals in a certain area, thereby maintaining population diversity. The crowding-distance of individual i on the k th target fk is
For instance, such a selection strategy selects the best individuals to build the next generation population while maintaining individual diversity. The elite selection strategy is adopted to retain the best individuals in the parent generation and directly enter the offspring. The population is sorted using non-dominated sorting, and the local crowding distance for each individual is calculated. Individuals are selected one at a time, until the number of individuals reaches N, forming a new parent population. Accordingly, a new round of selection, crossover, and mutation begins to form a new offspring population (a new generation of solutions).
Control system optimization by the NSGA-II
The power control system can maintain or adjust the output electrical power of the space reactor to the required target value. Its control principle is shown in Fig. 5. The error between the set value and the actual value of the electrical power was transferred into the PID controller. The control signal generates the driving signal of the control drum, as presented in Fig. 5. The changing angle of the control drum was converted into the reactivity introduced into the reactor core, and the reactor power was adjusted, ensuring the output electrical power reached the target value. In the process of designing the initial PID controller parameters, the following three steps were carried out. First, an open-loop response was obtained to determine what needs to be improved. Second, a proportional control was added to improve the rise time. Third, a derivative control was added to reduce the overshoot, and then an integral control was added to reduce the steady-state error. Finally, each of the gains (Kp, Ki, Kd) was adjusted until the desired overall response was obtained.
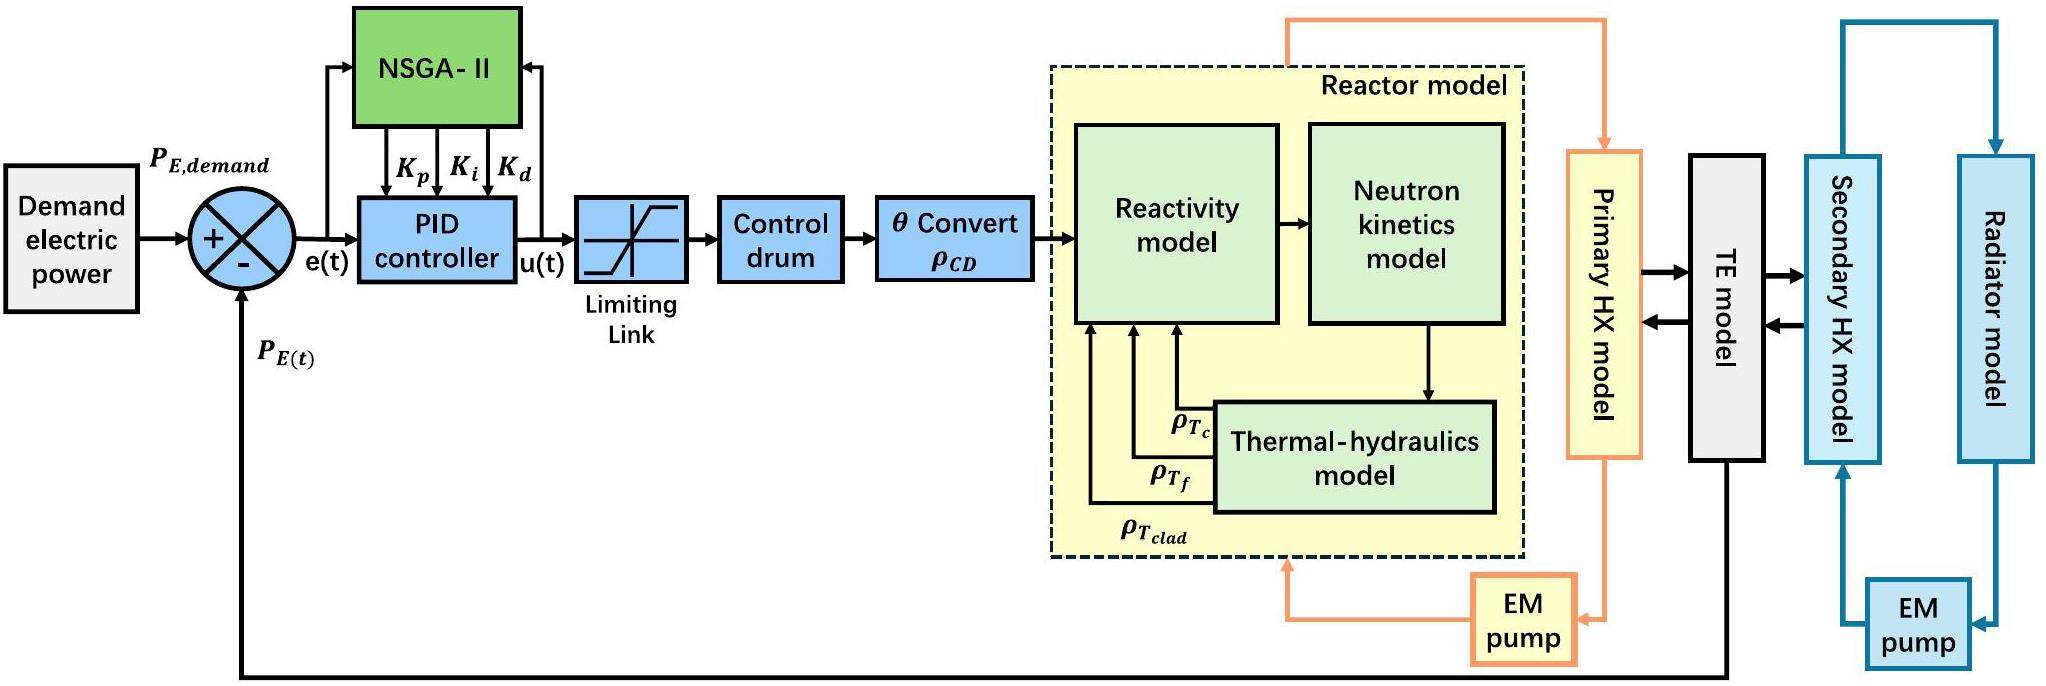
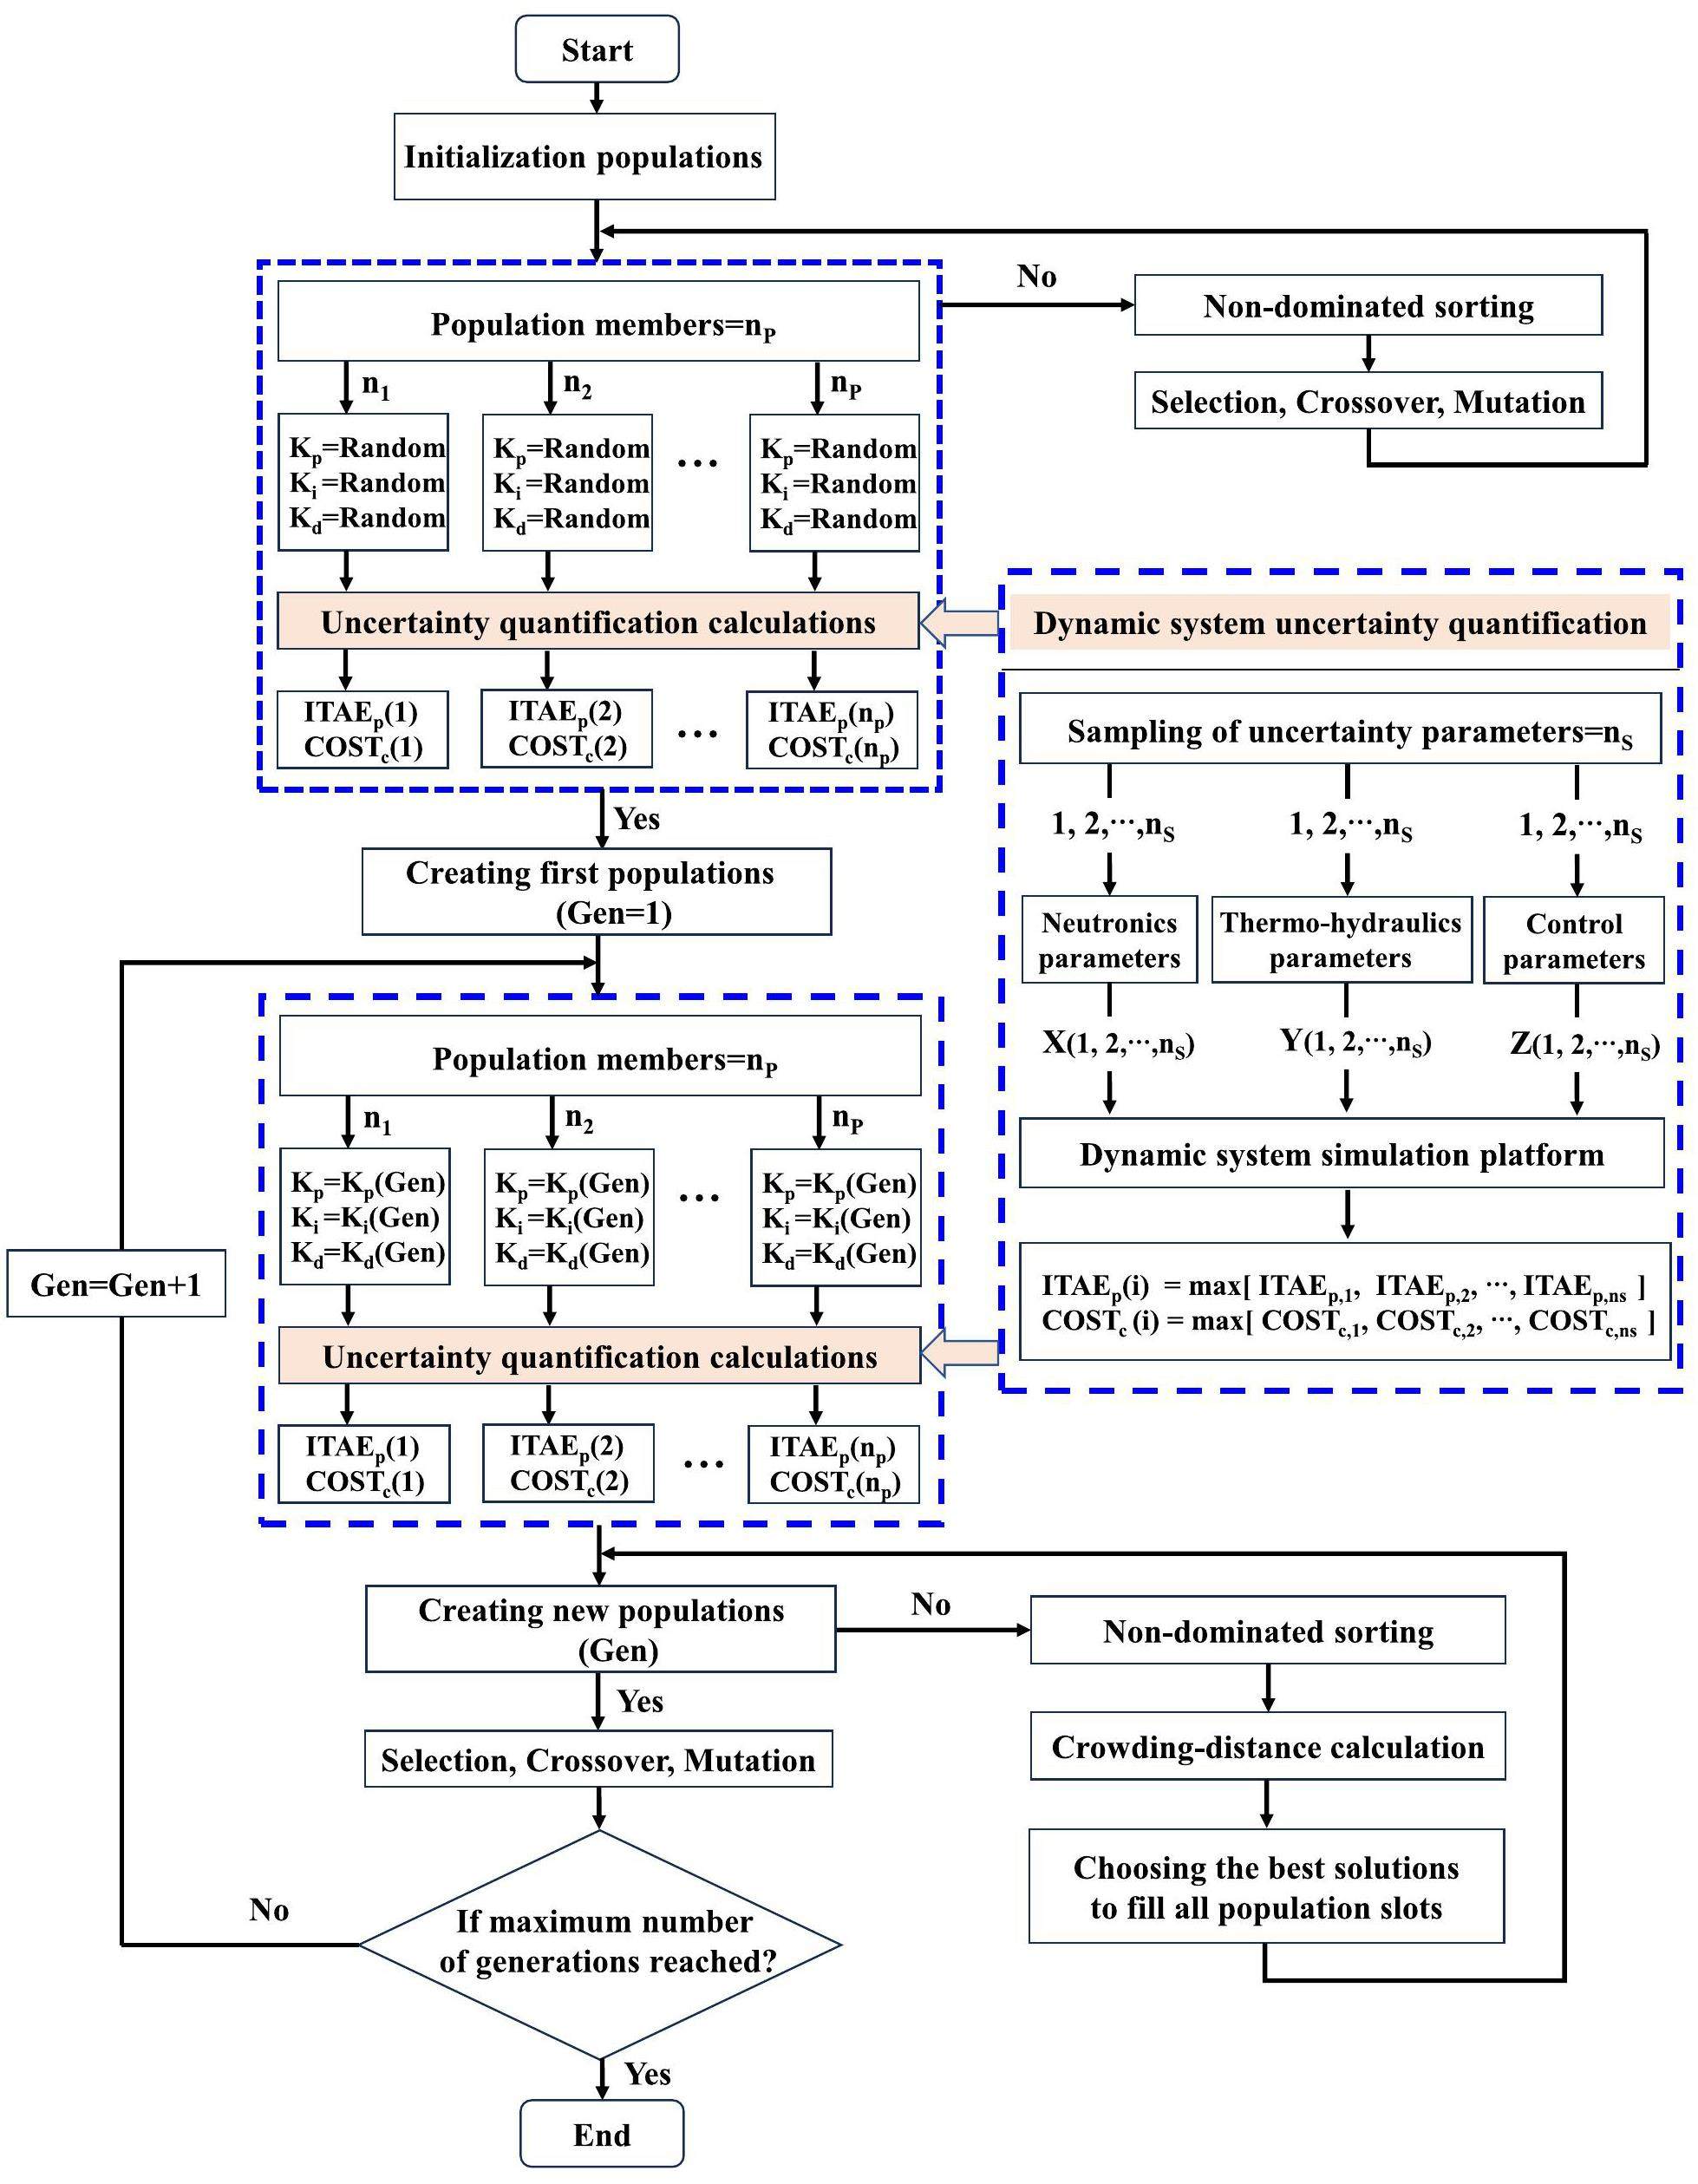
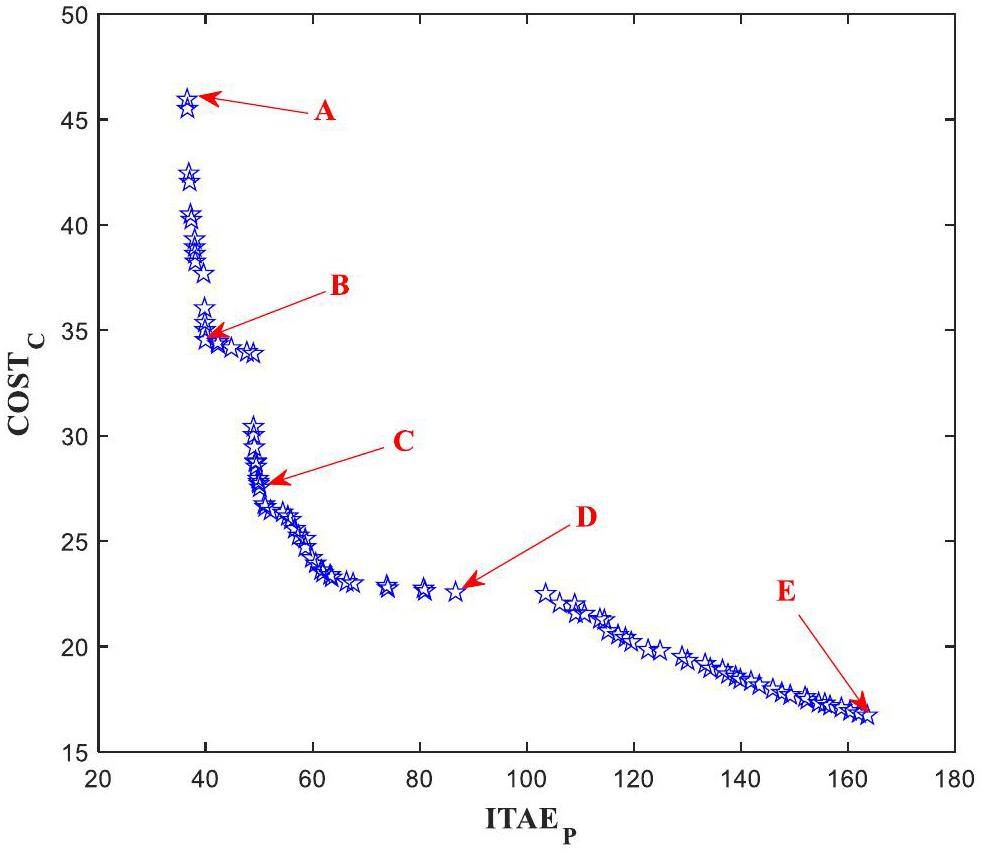
During the multi-objective optimization process, the integral time absolute error (ITAEp) and the control cost required of the power regulation (COSTc) served as two objective functions, PID controller parameters (Kp, Ki, Kd) are the optimization objects, as shown in Fig. 6. In each iterative process of the controller optimization, the objective function values caused by the coupling parameter uncertainty of neutronics, thermal-hydraulics, and control system in the transient model were calculated. The maximum values of the objective functions of the uncertainty calculations were selected as the final objective function values. Optimal control performance can be obtained considering system parameter uncertainty, as shown in Fig. 6.
Results and Discussion
Based on the developed model, a dynamic simulation platform of the space reactor was established, and the calculation values were compared with those of the design values in the literature to confirm accuracy of the program [42], as shown in Table 2. The results show that the simulation values agree with the design parameters. Thus, the established simulation model can be used for space reactor uncertainty analysis and control system optimization. In this study, the NSGA-II method was applied for the uncertainty-based controller optimization in the simulation platform.
| Parameters | Design values | Simulation values |
|---|---|---|
| Nuclear thermal power (kW) | 2000 | 2000 |
| Electrical power output (kW) | 112 | 116 |
| Conversion efficiency η (%) | 5.6 | 5.8 |
| Core inlet temperature (K) | 1254 | 1250.2 |
| Core outlet temperature (K) | 1284 | 1283.7 |
| Fuel average temperature (K) | 1376 | 1375.8 |
| Cladding temperature (K) | 1288 | 1287.6 |
| TE hot shoe temperature (K) | 1237 | 1236.8 |
| TE cold shoe temperature (K) | 857 | 857.1 |
Uncertainty quantification and sensitivity analysis
Both the theoretical simulation approximation and empirical correlation fitting in the experimental process cause system model uncertainty. Furthermore, the device of the space reactor will be accompanied by multi-degree freedom movements such as ups, downs, swings, and tilts in the changeable space environment, resulting in parameter uncertainty of the reactor neutronics and thermal-hydraulics model. Simultaneously, the sensors and actuators of the control system can introduce uncertainty due to environmental disturbances. To ensure safe and reliable operation, system uncertainty of space reactors must be quantified. Due to the limited computing resources, all uncertainty parameters could not be considered. Therefore, based on the insights from previous studies, the analysis primarily focuses on the most representative parameters. These parameters were selected for their influence on system performance, streamlining the uncertainty analysis while ensuring that key factors are adequately addressed.
The key uncertainty parameters selected in this study were divided into three categories: cross-section and kinetics parameters of the neutronics, thermophysical property parameters and heat transfer coefficients of thermal-hydraulics, and sensor measurement parameters of the control system. The selected uncertain parameters are treated as inputs for the uncertainty quantification program, with the assumption that they are uniformly distributed within their specified range. The distribution range of the input parameter uncertainty is determined based on the relevant information from references and engineering experience [26, 43], as shown in Table 3. The uncertainty quantification results obtained using a uniform distribution are larger than those obtained with a normal distribution, which aligns with the conservative approach typically adopted in space reactor uncertainty quantification. The number of samples required for the uncertainty calculation is determined solely by the set tolerance limit and confidence level. In theory, all uncertainty factors can be exhausted, and results that meet the specified requirements can be achieved at the minimum calculation cost. Given that the GRS method has a small computational burden, it is widely used for quantitative uncertainty analysis in nuclear engineering. Therefore, it is used to conducted uncertainty analysis of the coupling parameters in neutronics, thermal-hydraulics, and the control system for the space reactor. In our analysis, seventeen uncertainty input parameters related to the transient process were selected as samples, as shown in Table 3. To achieve a 95% confidence level, 93 samples were randomly generated with a uniform distribution.
| Parameters | Probability distribution | Uncertainty | |
|---|---|---|---|
| Neutronics parameters | Doppler reactivity coefficient | Uniform | ±3% |
| Fuel expansion reactivity coefficient | Uniform | ±3% | |
| Cladding expansion reactivity coefficient | Uniform | ±3% | |
| Coolant expansion reactivity coefficient | Uniform | ±3% | |
| Effective delayed neutron fraction | Uniform | ±1.2% | |
| Average neutron generation time | Uniform | ±1% | |
| Thermal-hydraulics parameters | Fuel heat capacity | Uniform | ±1.5% |
| Coolant heat capacity | Uniform | ±1.5% | |
| Fuel-cladding heat transfer coefficient | Uniform | ±2% | |
| Cladding-coolant heat transfer coefficient | Uniform | ±2% | |
| Coolant-hot shoe heat transfer coefficient | Uniform | ±1% | |
| Coolant-cold shoe heat transfer coefficient | Uniform | ±1% | |
| Control parameters | Coolant mass flow rate | Uniform | ±2% |
| Reactor core inlet temperature | Uniform | ±0.5K | |
| Reactor core outlet temperature | Uniform | ±0.5K | |
| HX secondary-side inlet temperature | Uniform | ±0.5K | |
| HX secondary-side outlet temperature | Uniform | ±0.5K |
In this study, to analyze the impact of system uncertainty on the dynamic characteristics of the space reactor, two typical transient operating conditions, including UELV and URI, were selected. To analyze the uncertainty quantification results, the mean, standard deviation, relative standard deviation (RSD), maximum and minimum values, and confidence intervals were used for quantitative characterization. The mean value is given by the Eq. (27).
UELV transient uncertainty analysis
In the UELV transient, the external load resistance increases twice in the space reactor system. The uncertainty parameters of the neutronics and thermal-hydraulics models (N-TH uncertainty), control system uncertainty parameters (Control uncertainty), and coupling uncertainty parameters of the neutronics, thermal-hydraulics and control system (Coupling uncertainty) were studied. The UELV transient simulations of these three cases were conducted as shown in Fig. 7. The corresponding samples were input into the simulation platform separately for each set of uncertainty parameters. The uncertainty quantification values of the output parameters such as nuclear power, electric power, fuel temperature, and TE hot shoe temperature, were calculated. In the UELV transient, when the external load resistance increases, the output current changes slightly, while the output electrical power increases sharply. The increase in external load resistance leads to an increase in the TE hot shoe temperature, which in turn causes the temperatures of the fuel and coolant to increase. Due to the inherent negative reactivity feedback of the fuel and coolant temperatures, the nuclear power initially decreases, which causes the fuel temperature to decrease. After a brief increase, the fuel temperature gradually decreases again, driven by the negative feedback effect of temperature. This results in a slight increase in nuclear power, finally reaching a new equilibrium state. The uncertainty variation amplitude of the response parameters caused by coupling parameters is the largest. For nuclear power, the uncertainty change amplitude caused by N-TH parameters is slightly lower than that caused by the control parameters. For electrical power, the uncertainty change amplitude caused by N-TH parameters is slightly higher than that caused by control parameters. However, for fuel temperature and TE hot shoe temperature, the uncertainty change amplitude caused by N-TH parameters is significantly higher than that of control parameters.
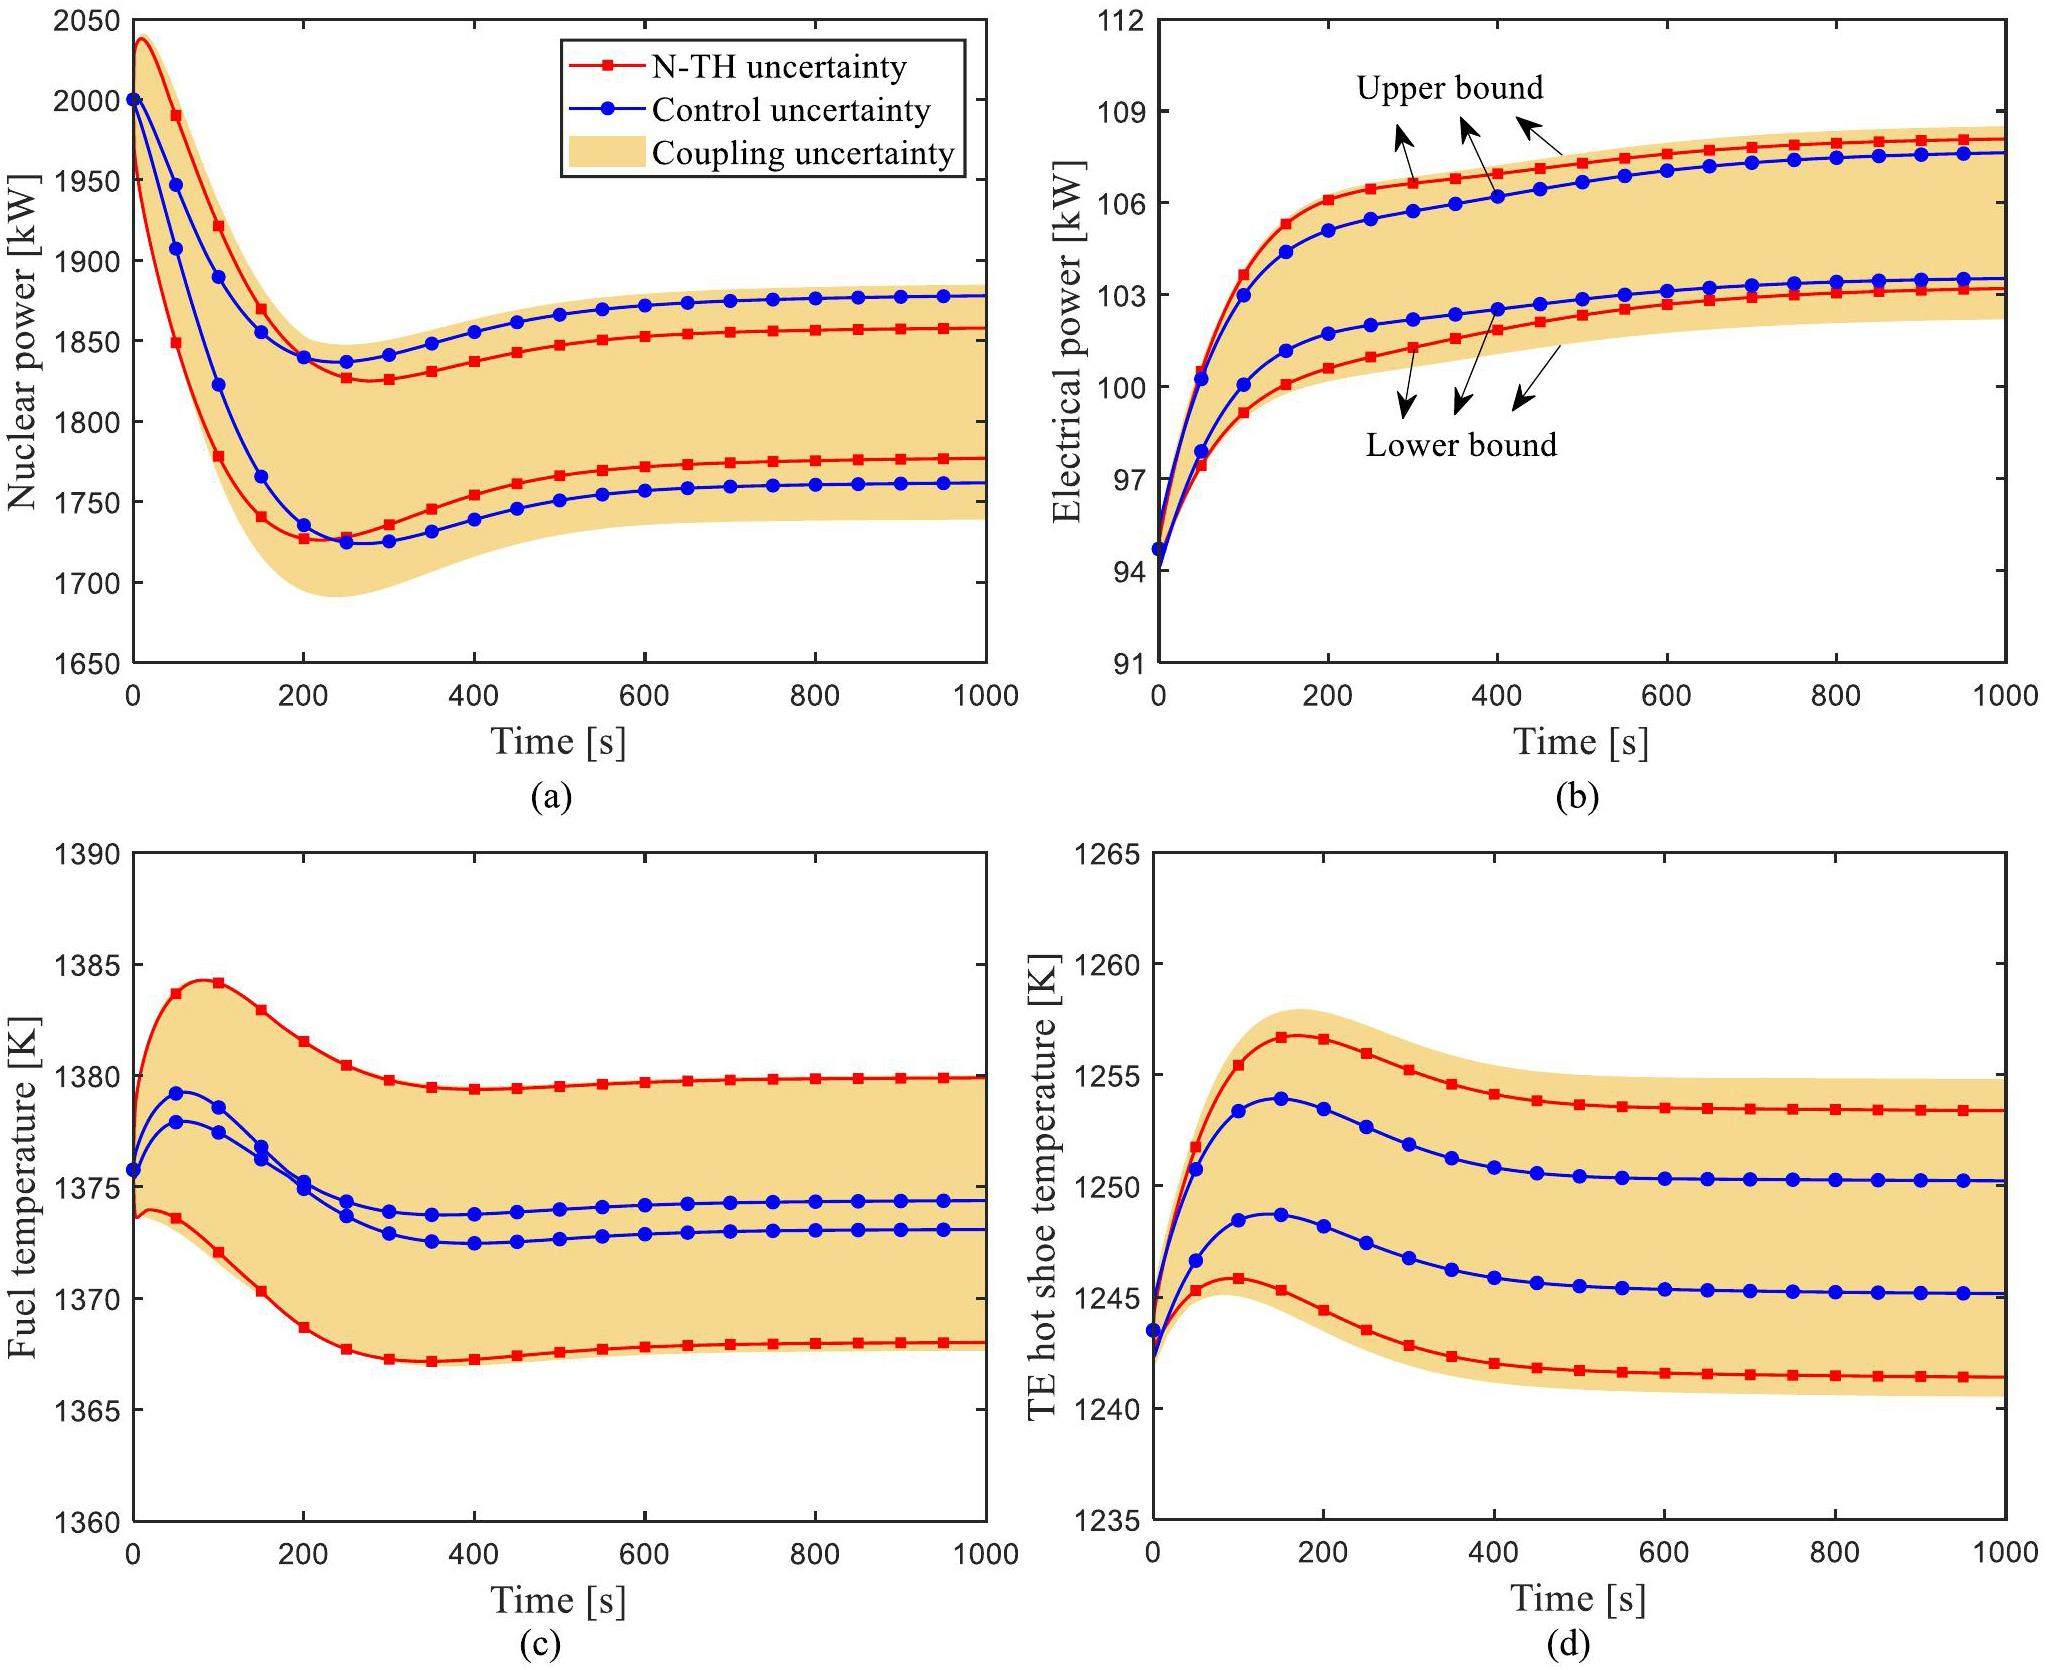
The quantitative uncertainty evaluation of the output parameters is shown in Table 4. The RSD values of nuclear power, electrical power, fuel temperature, and TE hot shoe temperature are less than 2.01%. The uncertainty of nuclear power caused by coupling parameters shows the largest change. In contrast, the uncertainty of fuel temperature caused by control parameters shows the smallest change, with an RSD value of only 0.02%. Therefore, during the UELV transient process, nuclear power is the most sensitive of the four output parameters.
| Parameters | μ | σ | RSD(%) | Minimum | Maximum | Confidence interval | |
|---|---|---|---|---|---|---|---|
| Nuclear power (kW) | N-TH | 1817.15 | 18.63 | 1.03 | 1777.01 | 1857.93 | [1780.63, 1853.67] |
| Control | 1816.19 | 30.62 | 1.69 | 1761.70 | 1877.99 | [1756.17, 1876.21] | |
| Coupling | 1815.16 | 36.49 | 2.01 | 1738.89 | 1884.94 | [1743.64, 1886.69] | |
| Electrical power (kW) | N-TH | 105.58 | 1.01 | 0.96 | 103.21 | 108.09 | [103.60, 107.56] |
| Control | 105.77 | 0.94 | 0.89 | 103.53 | 107.64 | [103.92, 107.62] | |
| Coupling | 105.82 | 1.29 | 1.22 | 102.20 | 108.50 | [103.28, 108.36] | |
| Fuel temperature (K) | N-TH | 1374.10 | 3.11 | 0.23 | 1368.02 | 1379.89 | [1367.99, 1380.21] |
| Control | 1373.69 | 0.34 | 0.02 | 1373.08 | 1374.38 | [1373.02, 1374.36] | |
| Coupling | 1374.08 | 3.08 | 0.22 | 1367.64 | 1380.00 | [1368.04, 1380.12] | |
| TE hot temperature (K) | N-TH | 1247.79 | 2.80 | 0.22 | 1241.39 | 1253.39 | [1242.29, 1253.29] |
| Control | 1247.59 | 1.32 | 0.11 | 1245.15 | 1250.23 | [1245.00, 1250.18] | |
| Coupling | 1247.83 | 3.33 | 0.27 | 1240.51 | 1254.81 | [1241.30, 1254.37] |
URI transient uncertainty analysis
In the URI transient, 70pcm reactivity is introduced into the reactor core. As described above (‘UELV transient uncertainty analysis’), the corresponding samples were input into the simulation platform, and the uncertainty quantification values of the output parameters of nuclear power, electrical power, fuel temperature, and TE hot shoe temperature calculated under the URI transient. The simulation results are shown in Fig. 8. In the URI transient, with the introduction of 70pcm positive reactivity, the neutron flux density increased, the nuclear power first increased instantly, and the fuel and TE hot shoe temperatures increased. Due to negative reactivity feedback, the increase in fuel and coolant temperature in the reactor core will introduce negative reactivity, and nuclear power will decrease, eventually reaching a new equilibrium point. Fig. 8 shows that coupling parameters cause the largest uncertainty change in output parameters. For nuclear power and electrical power, the uncertainty change caused by N-TH parameters was slightly higher than that caused by control parameters. For fuel temperature and TE hot shoe temperature, the uncertainty change amplitude caused by N-TH parameters was significantly higher than that caused by control parameters.
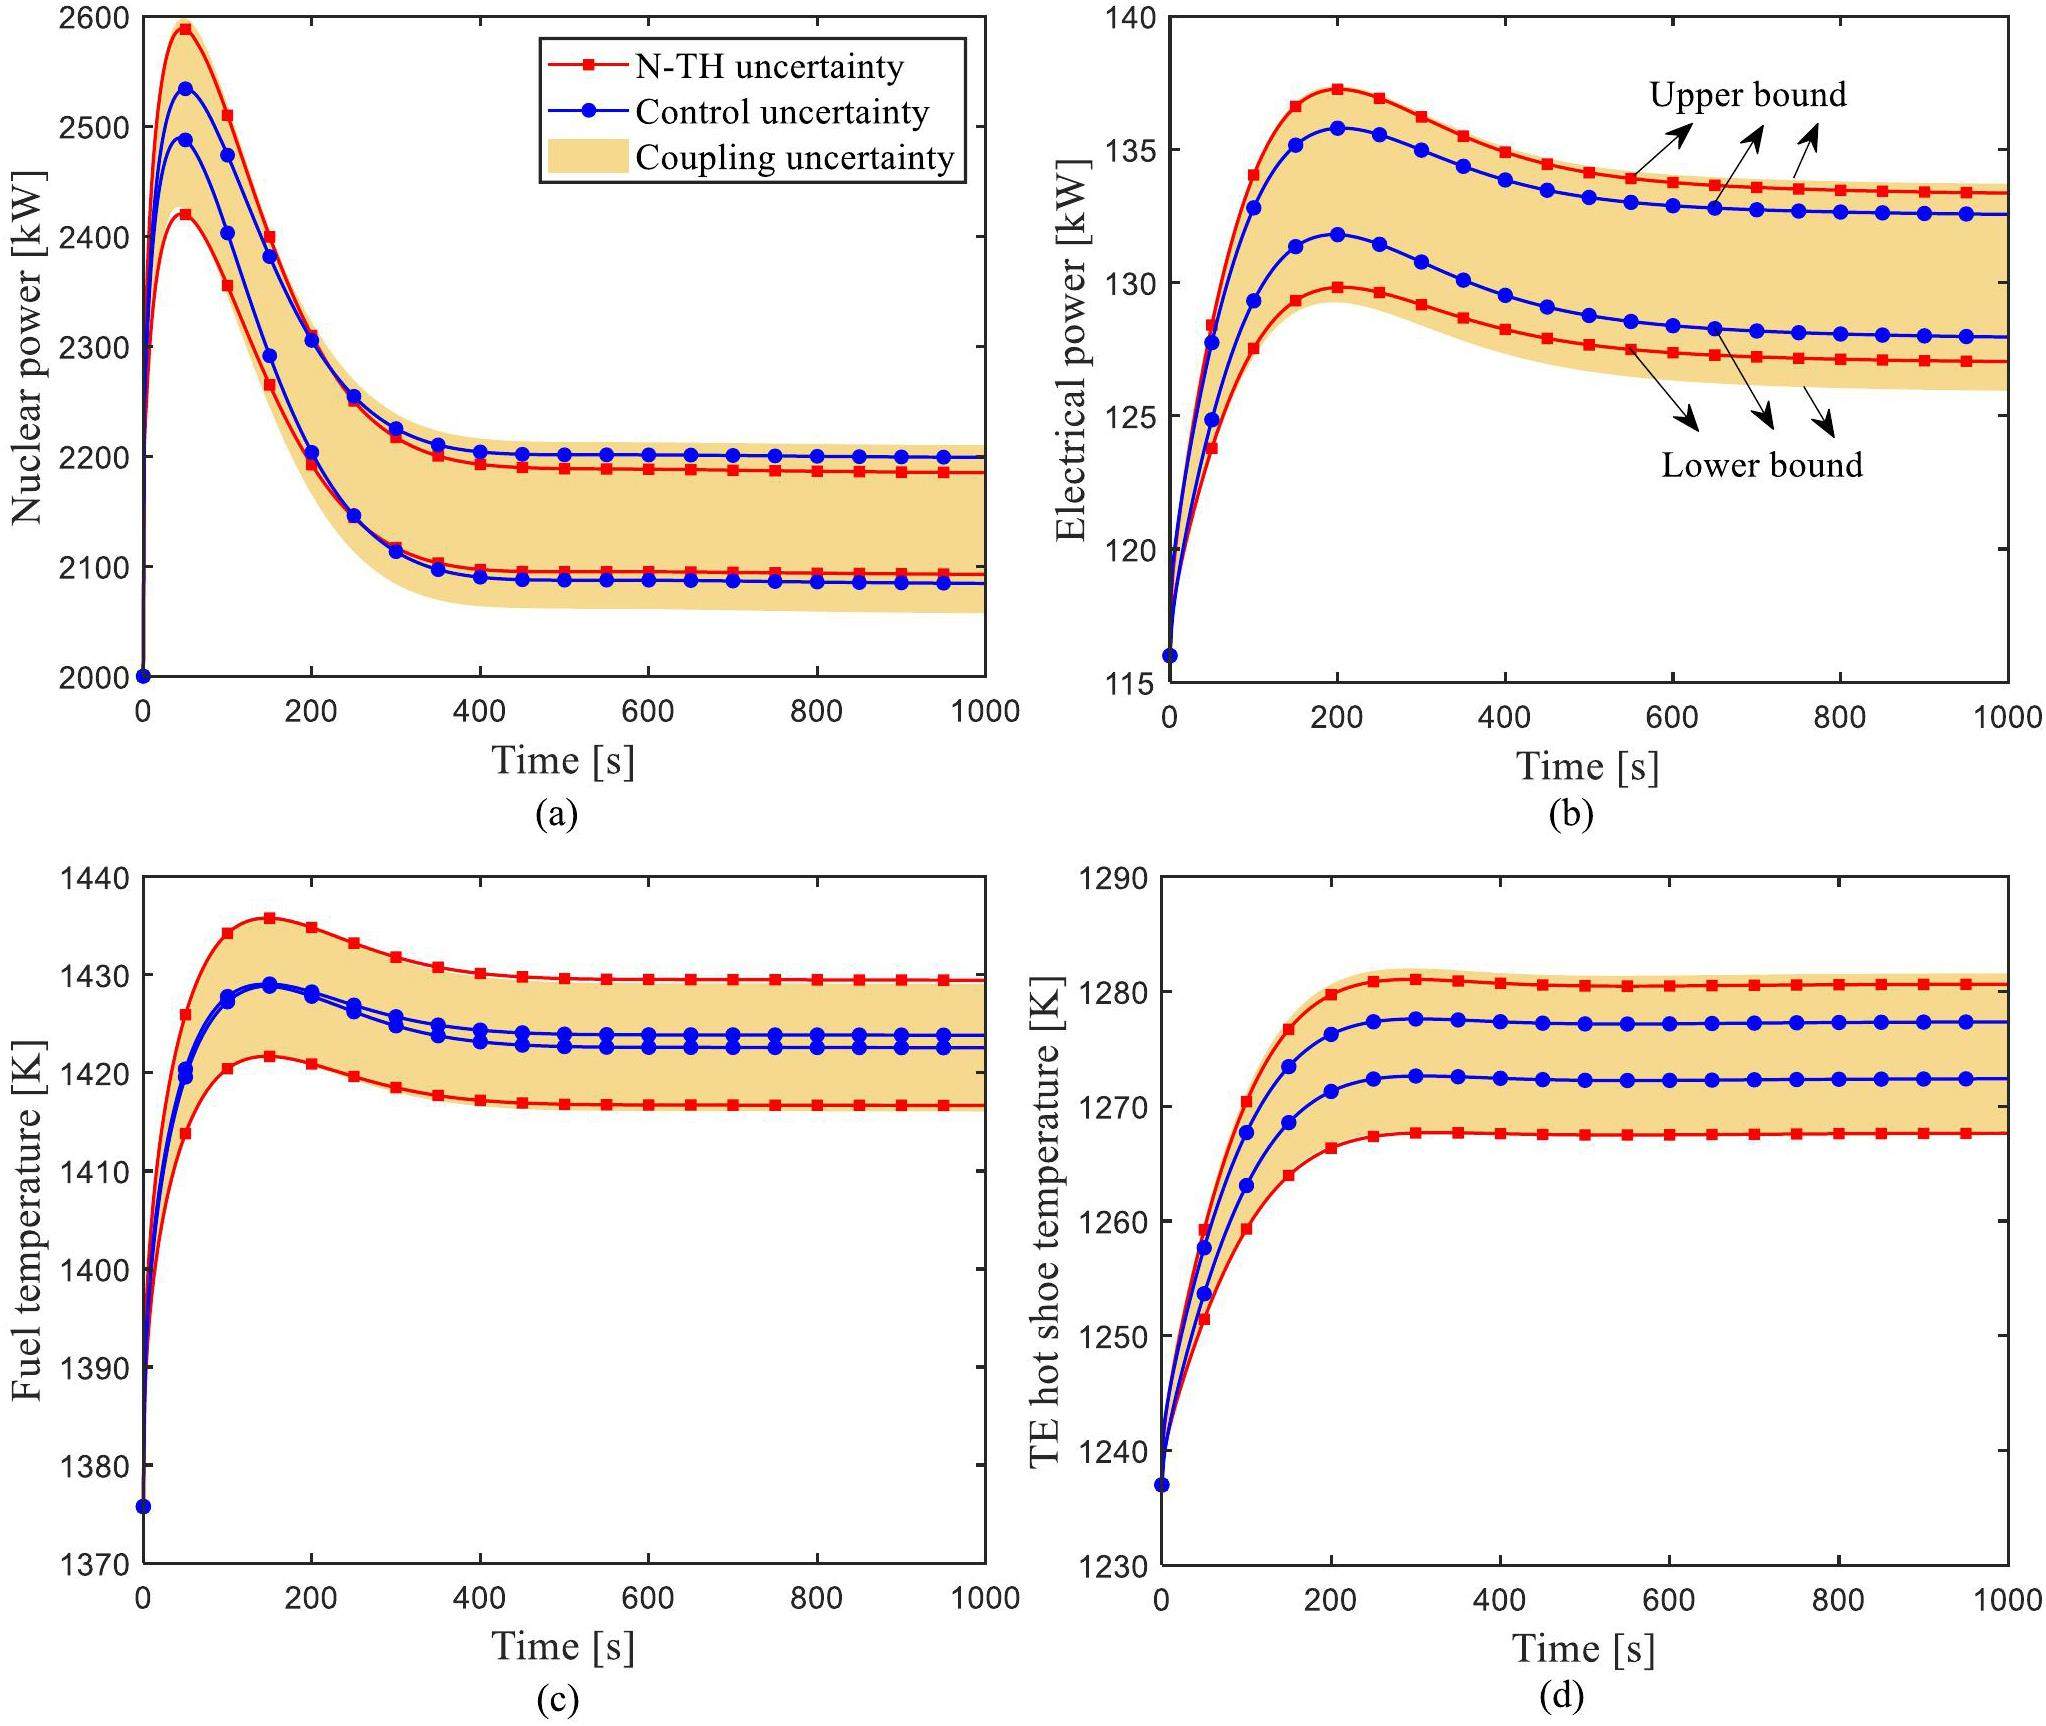
The uncertainty evaluation results of the four output parameters are shown in Table 5. The RSD values of nuclear power, electrical power, fuel temperature, and TE hot shoe temperature were less than 1.76%. The change of nuclear power caused by coupling parameters was the largest. The fuel temperature uncertainty change caused by control parameters was the smallest, with an RSD value of only 0.02%. Therefore, during the URI transient process, nuclear power is still the most sensitive of the four output parameters, and fuel temperature is the least sensitive parameter.
| Parameters | μ | σ | RSD(%) | Minimum | Maximum | Confidence interval | |
|---|---|---|---|---|---|---|---|
| Nuclear power(kW) | N-TH | 2138.98 | 21.64 | 1.01 | 2092.68 | 2185.09 | [2096.57, 2181.39] |
| Control | 2137.96 | 30.05 | 1.41 | 2084.38 | 2198.95 | [2079.06, 2196.85] | |
| Coupling | 2137.06 | 37.53 | 1.76 | 2057.25 | 2210.01 | [2063.49, 2210.63] | |
| Electrical power(kW) | N-TH | 130.29 | 1.24 | 0.95 | 127.04 | 133.36 | [127.86, 132.71] |
| Control | 130.46 | 1.04 | 0.80 | 127.96 | 132.56 | [128.42, 132.51] | |
| Coupling | 130.55 | 1.55 | 1.18 | 125.94 | 133.71 | [127.51, 133.58] | |
| Fuel temperature(K) | N-TH | 1423.70 | 3.25 | 0.23 | 1416.67 | 1429.44 | [1417.32, 1430.07] |
| Control | 1423.16 | 0.34 | 0.02 | 1422.56 | 1423.84 | [1422.50, 1423.81] | |
| Coupling | 1423.68 | 3.21 | 0.23 | 1416.05 | 1429.09 | [1417.37, 1429.97] | |
| TE hot temperature(K) | N-TH | 1275.03 | 2.90 | 0.23 | 1267.63 | 1280.64 | [1269.35, 1280.72] |
| Control | 1274.74 | 1.29 | 0.10 | 1272.39 | 1277.35 | [1272.21, 1277.27] | |
| Coupling | 1275.06 | 3.42 | 0.27 | 1267.67 | 1281.58 | [1268.35, 1281.77] |
Sensitivity analysis
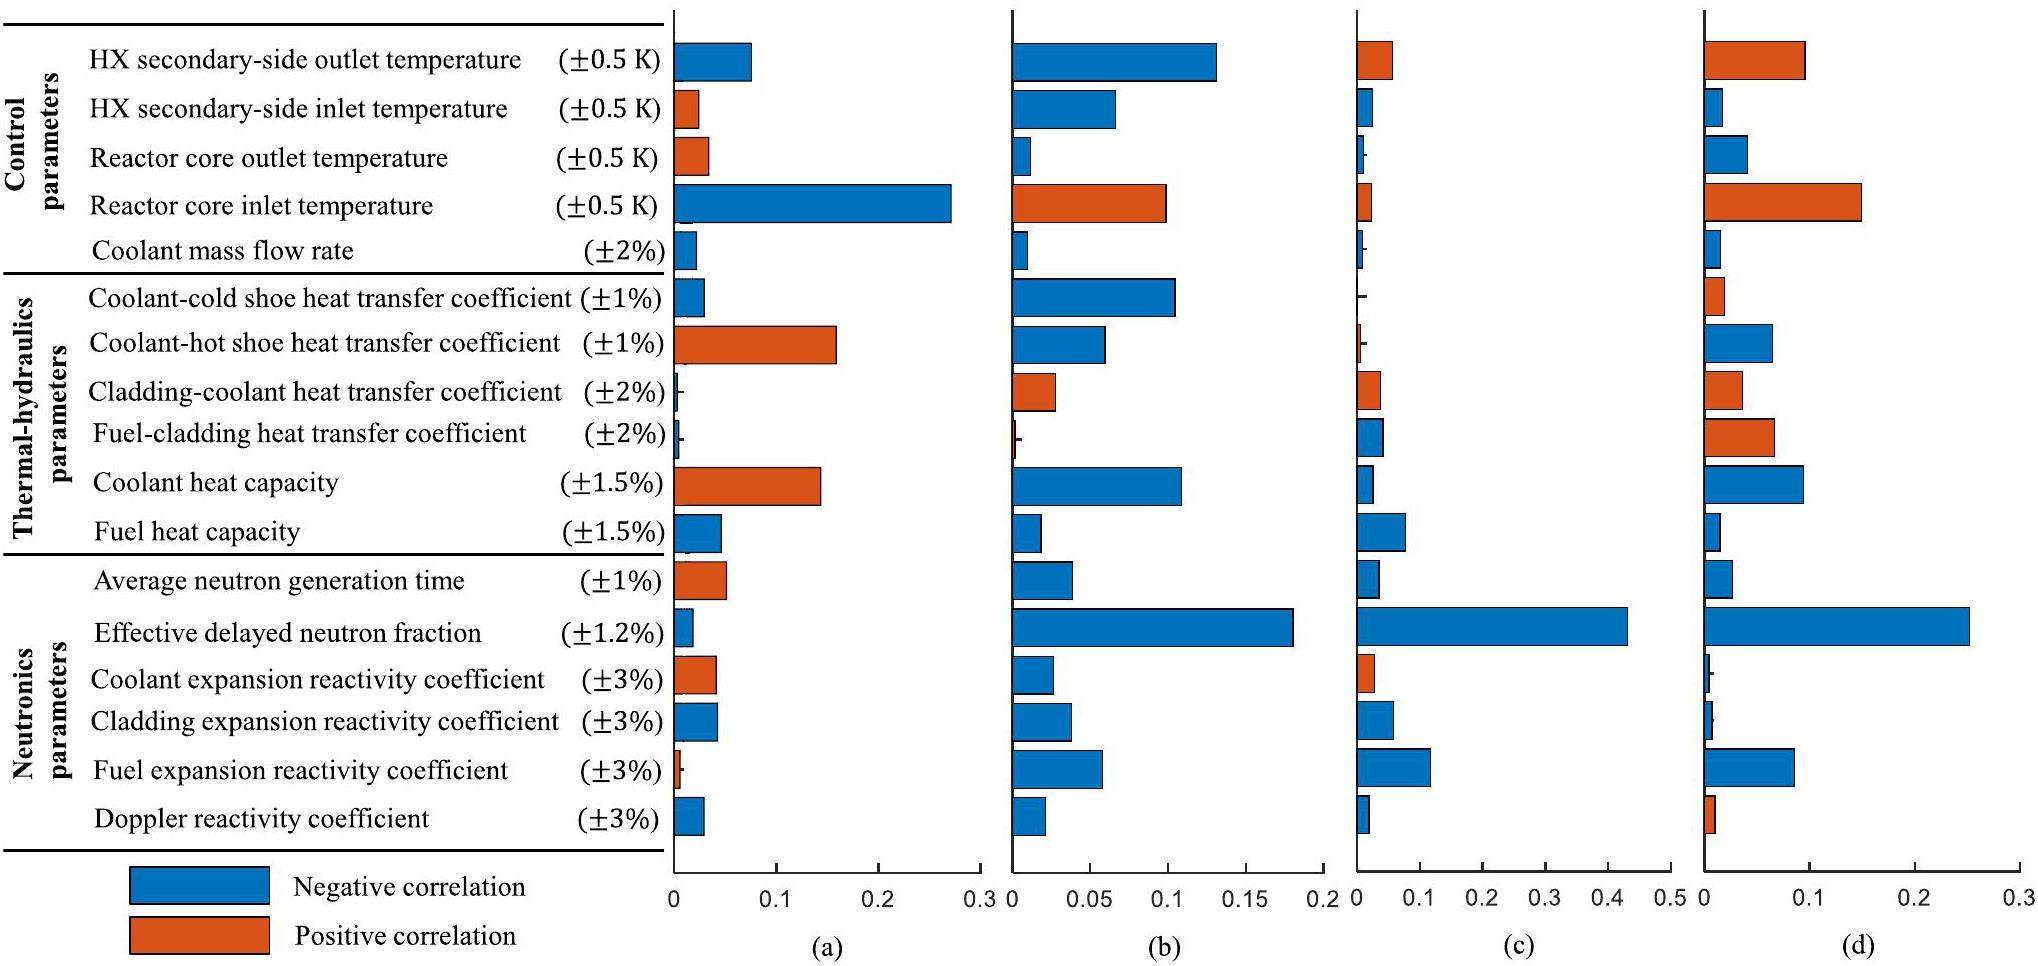
The Spearman correlation coefficient was calculated for influence analysis of system input parameters on the output parameters. The Spearman method is a global sensitivity analysis method that simultaneously calculates the impact of multiple input parameters on multiple output parameters. The sensitivity calculation results of the seventeen input parameters to four output parameters (nuclear power, electrical power, fuel temperature, and TE hot shoe temperature) are presented in Fig. 9. The sensitivity calculation results were normalized, as shown in Fig. 9, with the red color representing a positive correlation the blue a negative correlation. The presented sensitivity values are the final time results during the transient process. For the output parameter of nuclear power, the input parameter reactor core inlet temperature had the greatest impact. The cladding-coolant heat transfer coefficient was the least sensitive to nuclear power. Effective delayed neutron fraction has the greatest impact on electrical power, while fuel-cladding heat transfer coefficient has the least impact. Effective delayed neutron fraction was most sensitive to the output parameters of fuel temperature and TE hot shoe temperature.
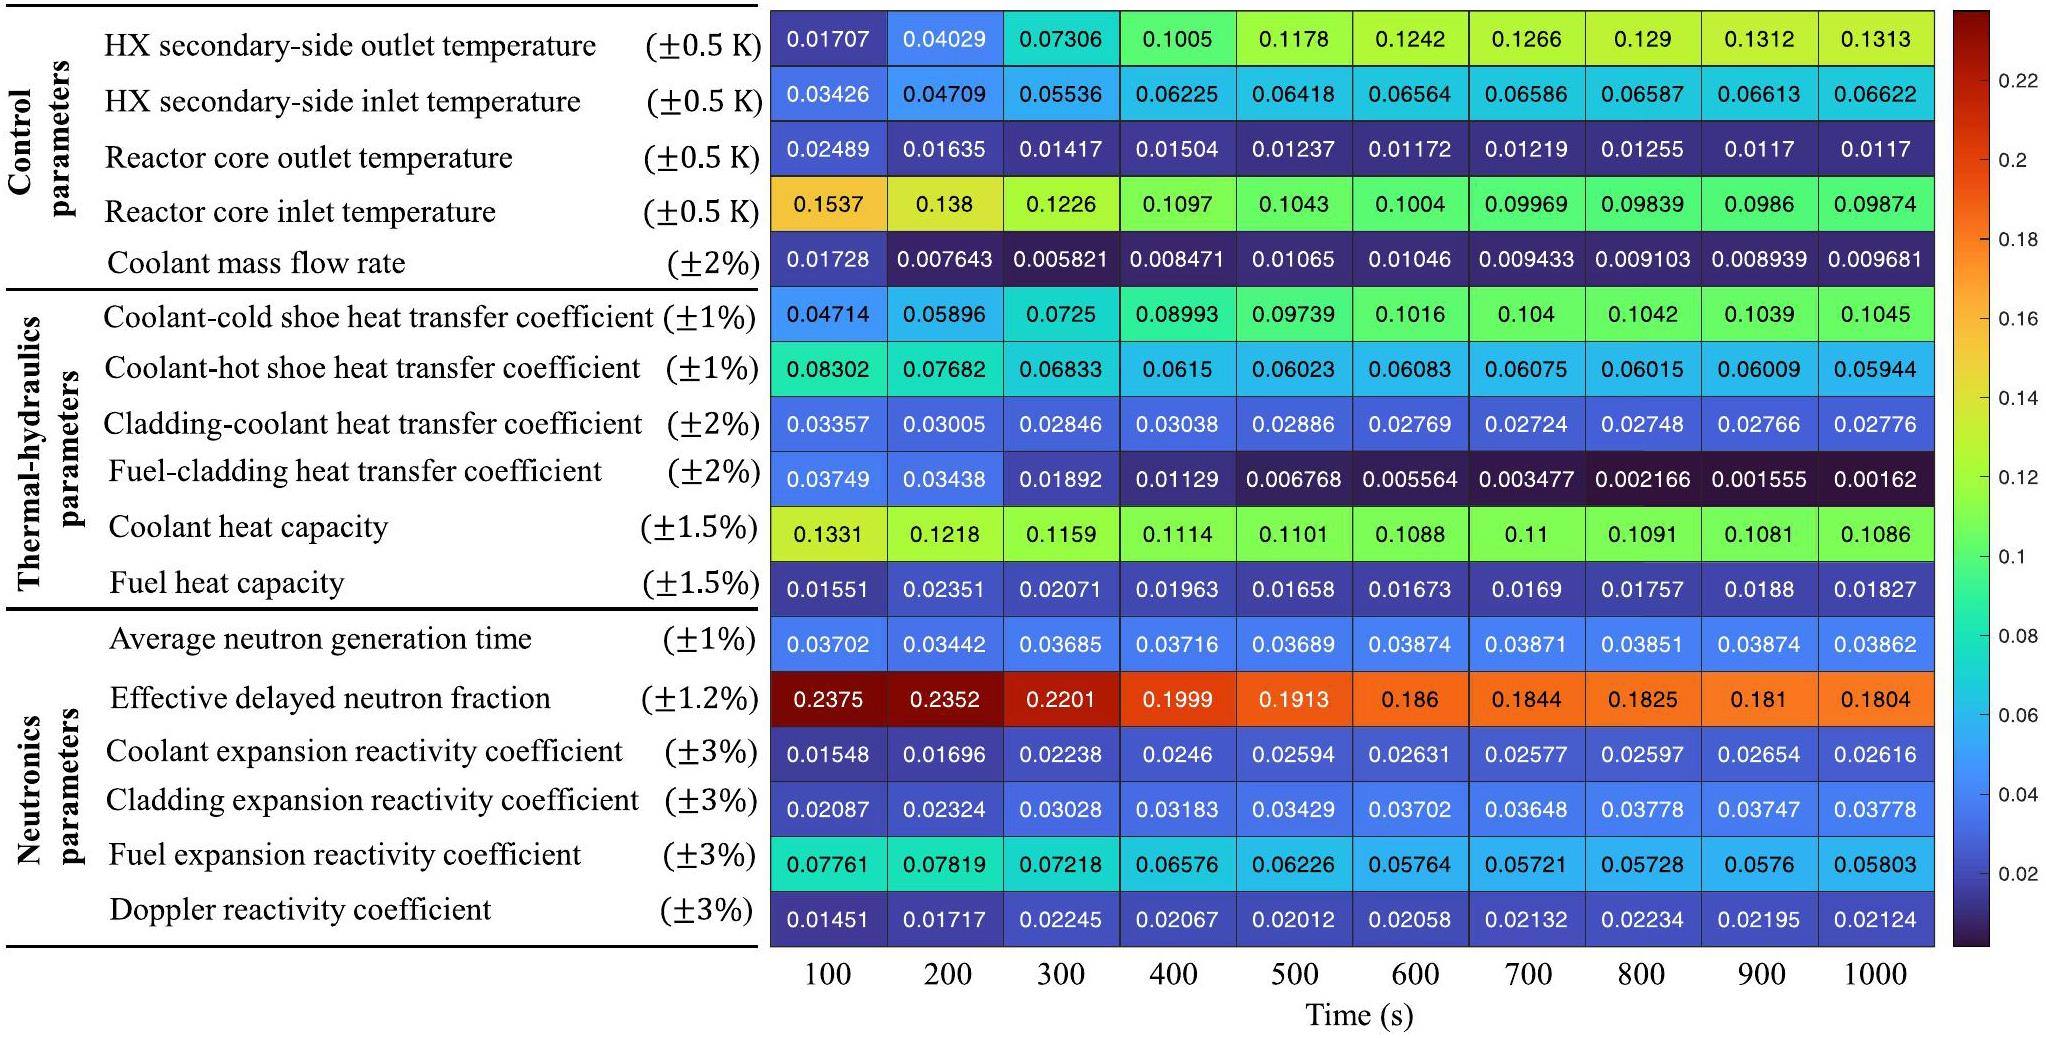
To analyze the sensitivity of input parameters to the electrical power (control target parameter) at different times during the transient process, the correlation coefficients of seventeen input parameters to the electrical power were calculated at intervals of 100 s, as shown in Fig. 10. The results show that the correlation coefficient of the effective delayed neutron fraction is 0.2376 (strongest correlation), and the correlation coefficient of Doppler reactivity coefficient is 0.01451 (weakest correlation) at 100 s. The correlation coefficient of effective delayed neutron fraction weakened to 0.1913 at 400 s, but remained the most sensitive parameter to the output parameter of electrical power. Simultaneously, the correlation coefficient of the coolant mass flow rate was 0.0085, which is the least sensitive. At 1000 s, the effective delayed neutron fraction was still the most sensitive parameter, but the least sensitive parameter at this time was the fuel-cladding heat transfer coefficient. Therefore, during the transient change process, the correlation coefficient values of the seventeen input parameters to the electrical power change, but the main trend does not change markedly.
Uncertainty-based control system optimization
NSGA-II multi-objective optimization
The goal of space reactor control was to minimize the cost of actuator control while ensuring efficient load follow capability, which can minimize the wear of the control drum mechanism and extend the life of the control system. The electrical power control system of the space reactor was designed based on the developed simulation model. Its control principle is shown in Fig. 5. The error e(t) between the set value and the actual value was provided to the PID controller as feedback information, and then the value of the controller output u(t) is calculated, that is used as a variable input to the control drum actuator to adjust the reactor core power. The electrical power was finally delivered to the desired value through the control system. To avoid the reactor criticality accident, the adjustment angle of the control drum was limited to
| A | B | C | D | E | |
|---|---|---|---|---|---|
| Kp | 96.9 | 48.5 | 30.9 | 18.9 | 18.8 |
| Ki | 3.9 | 1.5 | 0.7 | 0.5 | 0.1 |
| Kd | 149.5 | 148.9 | 136.9 | 147.7 | 148.1 |
As presented in Table 6, the minimum ITAEp exists at point A where COSTc is maximum. At point E, ITAEp is the largest and COSTc is the smallest. Therefore, a boundary between the two objectives is present, and it is clear from the Pareto front that no single solution is known that can minimize both objective functions simultaneously. The final optimal solution should selected via a decision-making process based on the importance of each goal. For the selection of optimal parameters, if control performance is more important, the point from A to C can be selected as the final optimal solution. Otherwise, points from C to E should be chosen as emphasis of the control cost.
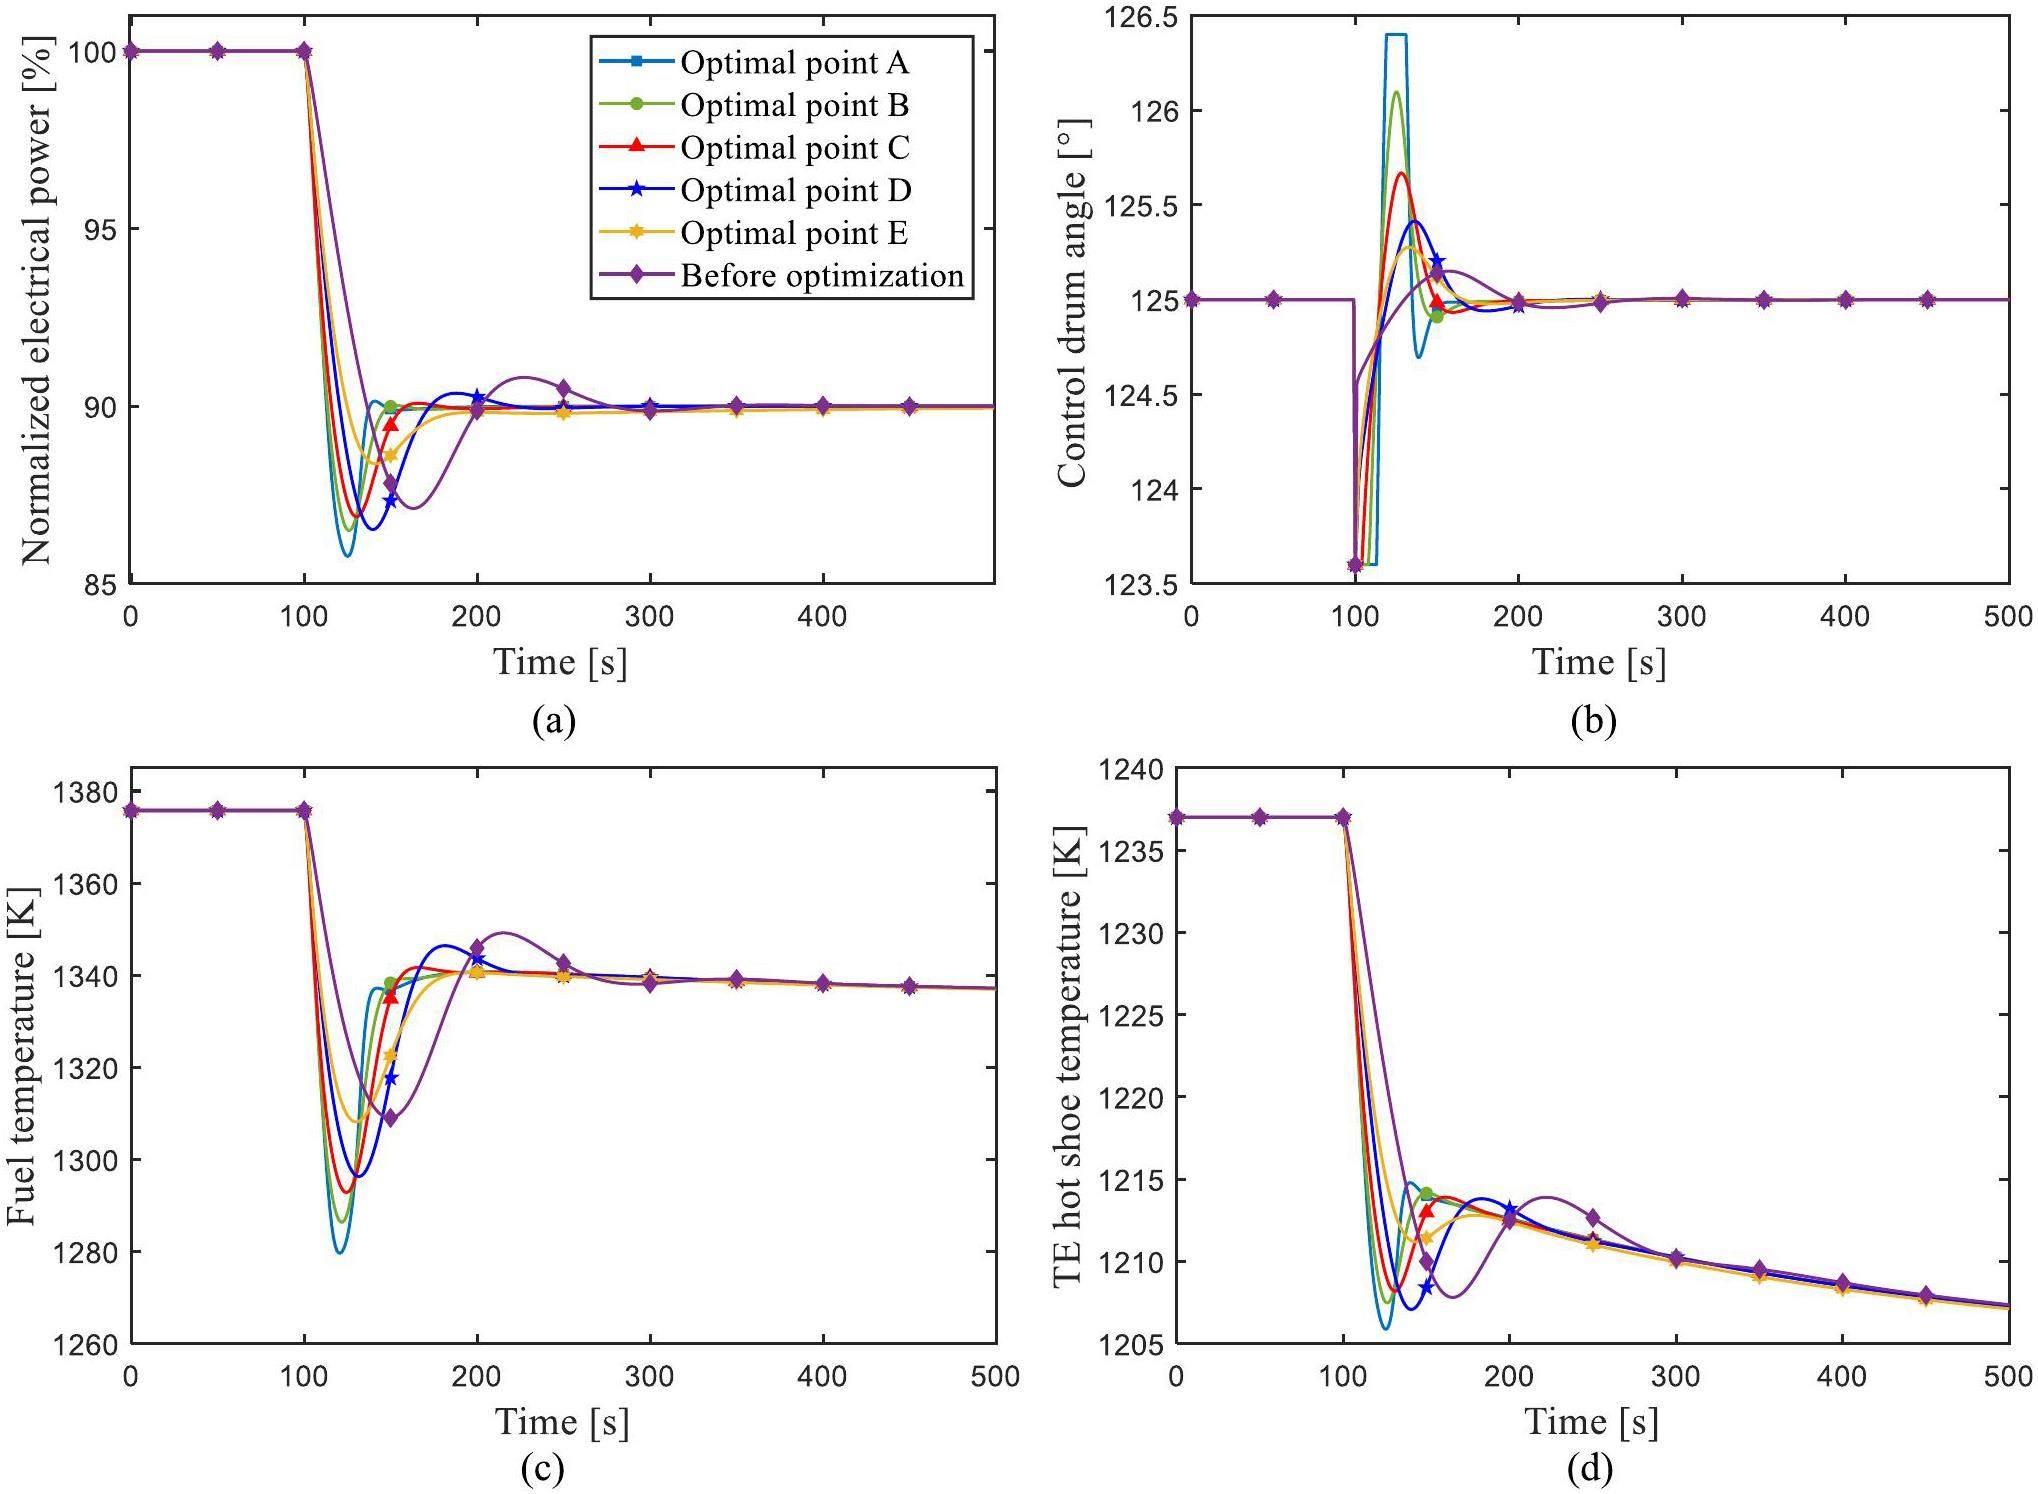
In this study, five typical points from A to E were selected for comparative study of control system performance. To evaluate the effectiveness of multi-objective optimization of space reactor control parameters, the simulation results using the optimal controller parameters were compared with those of original design controller parameters under the load change transient (100% Full power (FP) to 90% FP step reduction), as shown in Fig. 12. To balance control performance and control cost, point C was selected as the final PID controller optimization parameter value. The control overshoot and control error of optimal point C were smaller than those of optimal points D and E, and the control cost was lower than that of optimal points A and B, and the changes in fuel temperature and TE hot shoe temperature were smoother. Based on the above comparative analysis results and comprehensive consideration of the control performance and control cost, the controller parameters at point C were selected as the final controller optimal parameters.
To test the self-adaptive ability of the optimal controller to the uncertainty dynamic system, two typical transient power changes were simulated and analyzed as follows:
Case 1 (Step power change): 100% FP to 90% FP step load reduction transient;
Case 2 (Linear power change): 5% FP/min linear variable load transient.
The mean square error (MSEp) and maximum percentage deviation (MPDp) were included as evaluation indicators of control system performance. MSEp and MPDp are defined as the Eqs. (33)–(34).
Step power change
In case 1, coupling parameter uncertainty of neutronics, thermal-hydraulics, and control system were added into the simulation platform at 50 s, and then the control target power steped from 100% FP to 90% FP at 100 s, as shown in Fig. 13. The response of the system was not represented by a fixed time curve, but by a region bounded by upper and lower uncertainty boundaries, which was used to evaluate the adaptive ability of the optimized controller to the uncertain system. The simulation results revealed that the overall overshoot and control error of the optimized control system were lower than those of the control system before optimization, and the uncertainty change range of the optimized system during the electrical power adjustment process was smaller than that before optimization. The simulation results indicate that the optimized electrical power controller has better self-adaptability to adjust uncertainty dynamic system.
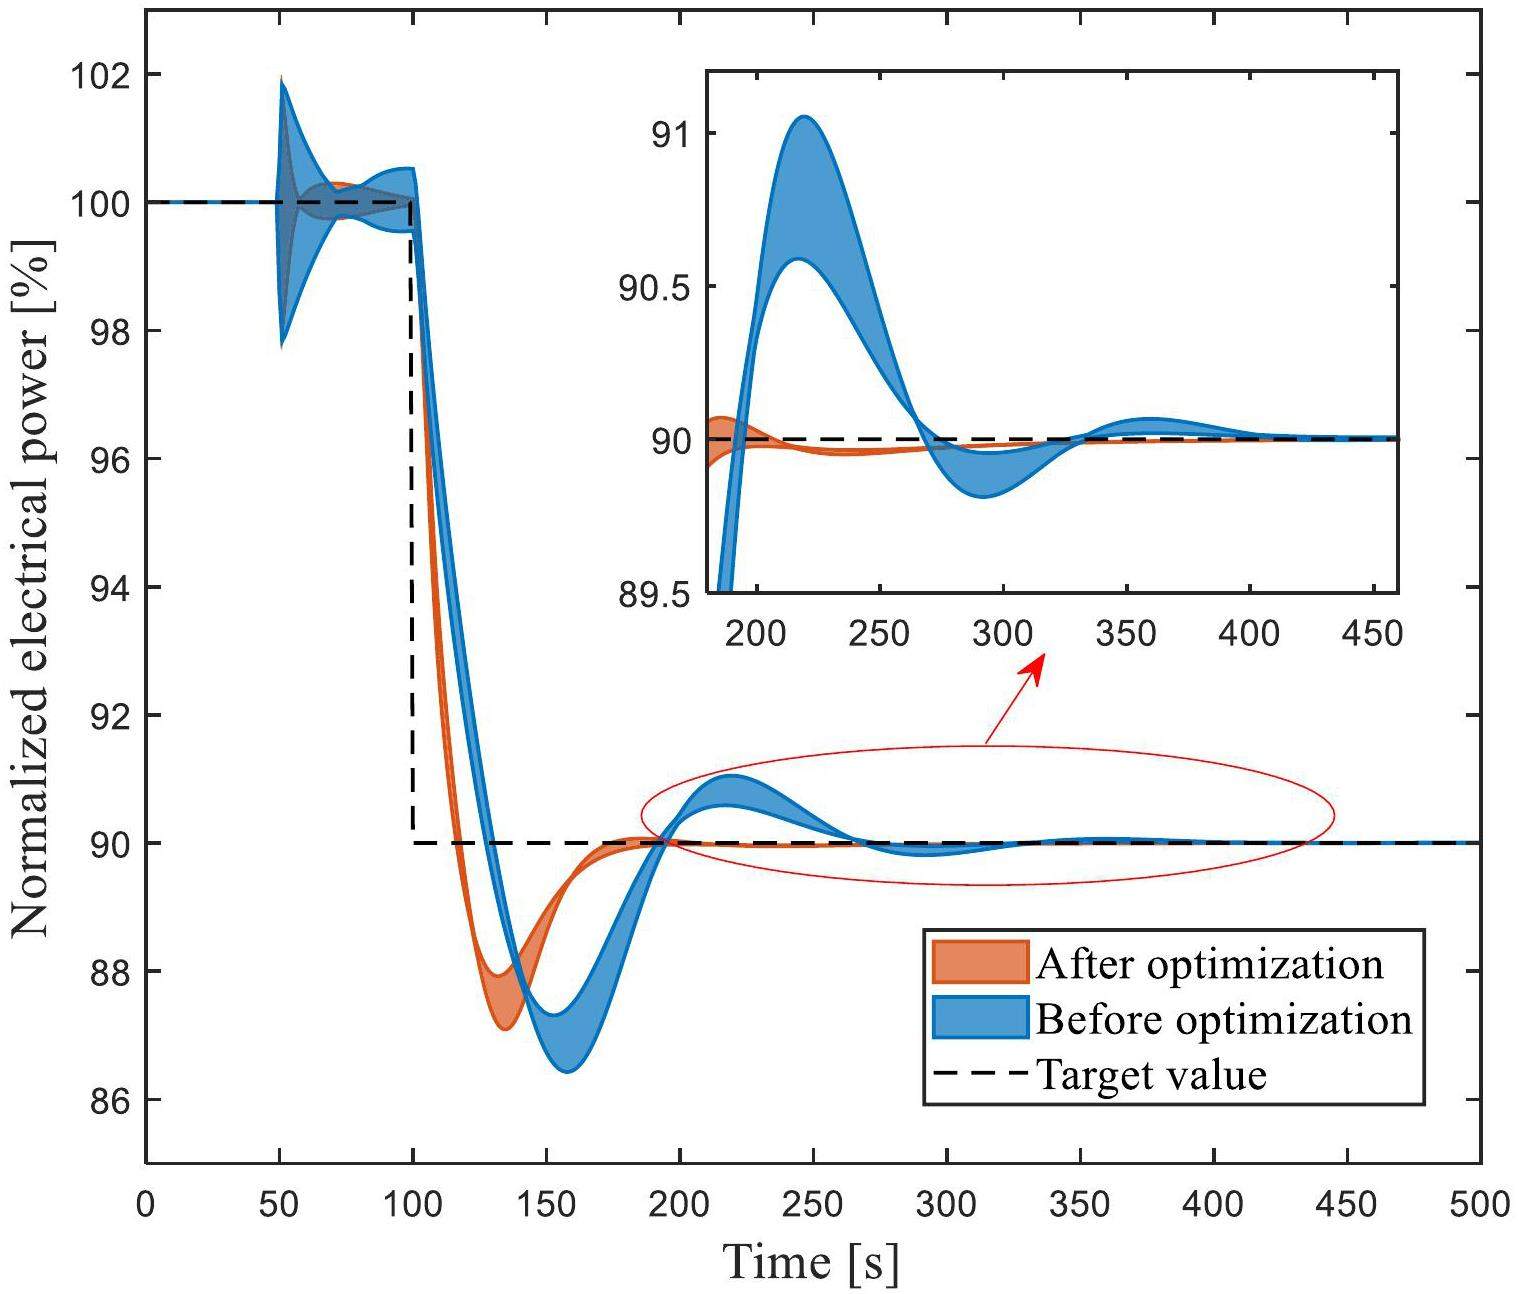
The average values of IATEp, MSEp and MPDp after optimization were all lower than those of values before optimization, as shown in Table 7. Notably, the optimized controller has lower overshoot, less oscillation, and shorter time to reach a new steady state when considering system uncertainty.
| Case 1: Step power change | Case 2: Linear power change | |||
|---|---|---|---|---|
| After optimization | Before optimization | After optimization | Before optimization | |
| IATEp | 193.75 | 436.83 | 256.59 | 2302.15 |
| MSEp | 1.27×10⁻⁴ | 2.23×10⁻⁴ | 5.75×10⁻⁷ | 1.06×10⁻⁵ |
| MPDp (%) | 2.91 | 3.57 | 2.15 | 2.18 |
| COSTc | 25.36 | 16.91 | 19.86 | 18.92 |
Linear power change
In case 2, the coupling parameter uncertainty of neutronics, thermal-hydraulics, and control system were inserted into the simulation platform at 50 s, and the target power gradually decreased from 100% FP to 70% FP with 5% FP/min decrease at 100 s, and then rebounded to 100% FP at 800 s, as shown in Fig. 14. The simulation results revealed that the overshoot and control error of the optimal controller were lower than those of values before optimization, and the uncertainty change range of the optimized control system during the electrical power adjustment process was smaller than that before optimization. The average values of IATEp, MSEp, and MPDp after optimization were far lower than those of values before optimization, and the control cost was equivalent, as presented in Table 7. Under linear power change transient, the optimal controller had lower overshoot, less oscillation, and reached the target power value faster.
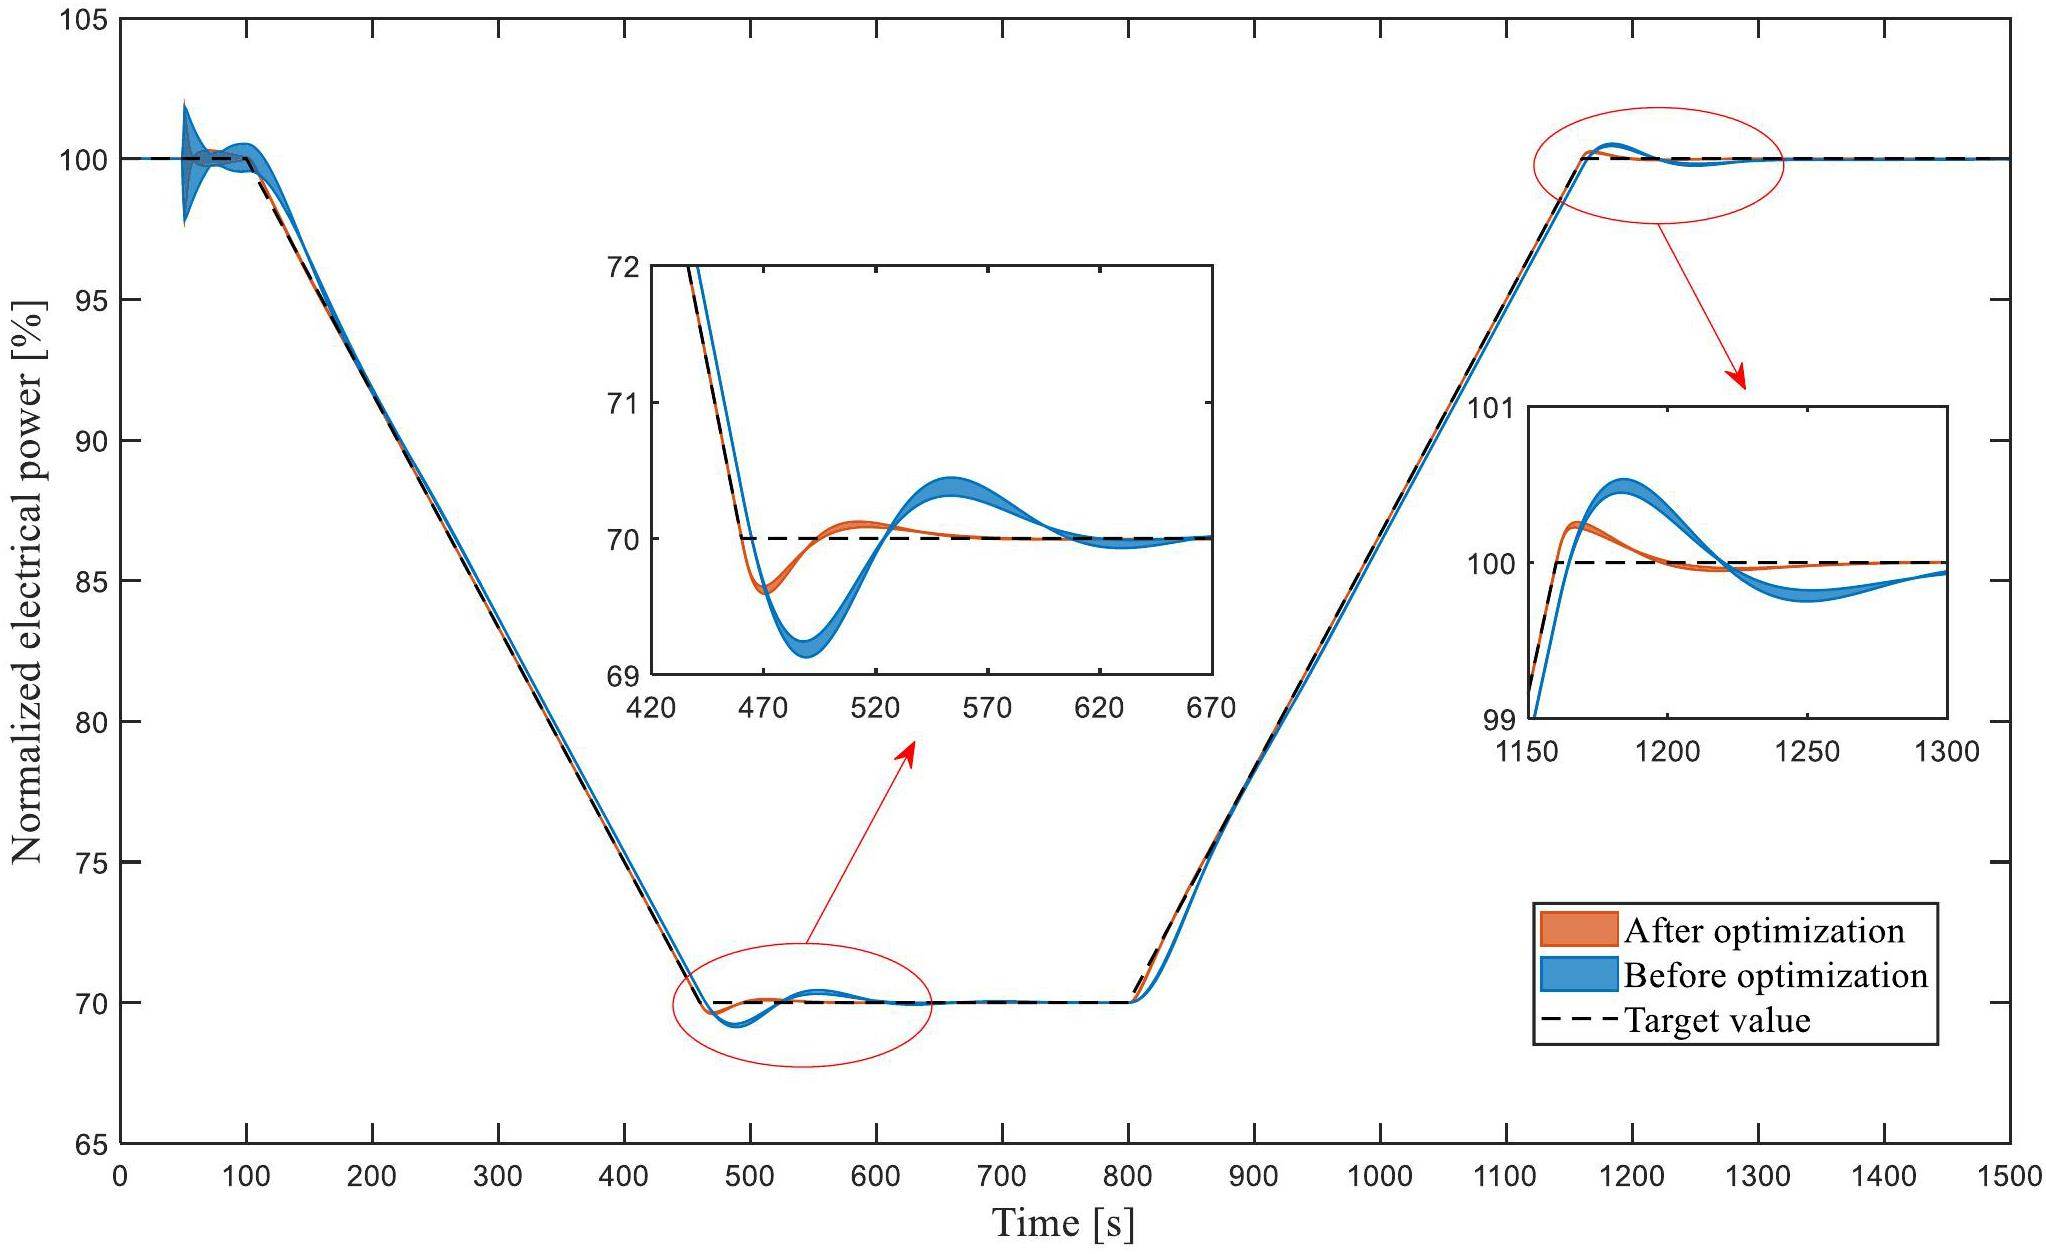
Therefore, the optimal controller has stronger adaptive capabilities for uncertain systems. By comparing the control simulation results of those two power change transients, the control system could improve response speed and control accuracy after optimization. The effectiveness and superiority of the proposed NSGA-II optimization of the electrical power control system based on uncertainty quantification analysis has been verified.
Conclusions
In this study, we successfully developed a simulation model of the space reactor system, including the reactor neutron kinetics, reactivity control, reactor core heat transfer, heat exchanger, and thermoelectric conversion models. Based on the developed transient model, an electrical power control system was designed. The GRS method was used to quantitatively calculate the uncertainty of coupling parameters of the neutronics, thermal-hydraulics, and control system for the space reactor. The Spearman correlation coefficient was applied for the sensitivity analysis of system input parameters to output parameters. To obtain optimal control performance, the NSGA-II method was employed, to optimize the controller parameters based on the uncertainty system.
(1) In the UELV transient, the RSD values of nuclear power, electrical power, fuel temperature, and TE hot shoe temperature were less than 2.01%. The uncertainty of nuclear power caused by coupling parameters has the largest change. The uncertainty of fuel temperature caused by control parameters has the smallest change, with an RSD value of only 0.02%.
(2) In the URI transient, the RSD values of nuclear power, electrical power, fuel temperature, and TE hot shoe temperature were less than 1.76%. The uncertainty variation of nuclear power caused by coupling parameters was the largest, whereas, fuel temperature uncertainty change caused by control parameters was the smallest.
(3) For the output parameter of nuclear power, the input parameter of reactor core inlet temperature had the greatest impact. The cladding-coolant heat transfer coefficient was the least sensitive to nuclear power. Effective delayed neutron fraction had the greatest impact on electrical power, while fuel-cladding heat transfer coefficient had the lowest impact. Simultaneously, effective delayed neutron fraction was most sensitive to the output parameters of fuel temperature and TE hot shoe temperature.
(4) During the transient change process, the correlation coefficient values of the input parameters to the electrical power will change at different moments, only with slight changes from main trend.
(5) For the two typical power control transients, the average values of IATEp, MSEp, and MPDp after optimization were lower than those of values before optimization, and the control cost was comparable. The simulation results also showed that the optimal controller has lower overshoot, less oscillation, and reaches the target power value faster, considering system uncertainty.
A review of nuclear electric fission space reactor technologies for achieving high-power output and operating with HALEU fuel
. Prog. Nucl. Energy. 163,Deployment history and design considerations for space reactor power systems
. Acta Astronaut. 64(9–10), 833-849 (2009). https://doi.org/10.1016/j.actaastro.2008.12.016Thermal-hydraulic analysis of the thermoelectric space reactor power system with a potassium heat pipe radiator
. Ann. Nucl. Energy. 136,KRUSTY reactor design
. Nucl. Technol. 206(sup1), S13-S30 (2020). https://doi.org/10.1080/00295450.2020.1725382Transient thermal–hydraulic analysis of the thermionic space reactor TOPAZ-II
. Ann. Nucl. Energy. 194,Neutronic design study of an integrated space nuclear reactor with Stirling engine
. Ann. Nucl. Energy. 142,Reactor reliability modeling and reliable life analysis method for multi-state space reactor systems based on DBN and interval estimation
. Prog. Nucl. Energy. 168,Reliability and loading-following studies of a heat pipe cooled, AMTEC conversion space reactor power system
. Ann. Nucl. Energy. 130, 82-92 (2019). https://doi.org/10.1016/j.anucene.2019.02.029Research on power flattening method and neutron characteristic analysis of a megawatt-class space gas-cooled fast reactor
. Ann. Nucl. Energy. 161,Preliminary control strategies of megawatt-class gas-cooled space nuclear reactor with different control rod configurations
. Prog. Nucl. Energy. 113, 135-144 (2019). https://doi.org/10.1016/j.pnucene.2019.01.013Conceptual design of a dual drum-controlled space molten salt reactor (D2-SMSR): Neutron physics and thermal hydraulics
. Nucl. Eng. Tech. 55(6), 2315-2324 (2023). https://doi.org/10.1016/j.net.2023.03.011AZTUSIA: A new application software for Uncertainty and Sensitivity analysis for nuclear reactors
. Reliab. Eng. Syst. Saf. 209,Eigenvalue sensitivity and uncertainty analysis based on a 2-D/1-D whole-core transport code KYADJ
. Ann. Nucl. Energy. 122, 185-192 (2018). https://doi.org/10.1016/j.anucene.2018.08.044SARAX: a new code for fast reactor analysis part II: verification, validation and uncertainty quantification
. Nucl. Eng. Des. 331, 41-53 (2018). https://doi.org/10.1016/j.nucengdes.2018.02.033NURESIM–A European simulation platform for nuclear reactor safety: Multi-scale and multi-physics calculations, sensitivity and uncertainty analysis
. Nucl. Eng. Des. 241(9), 3416-3426 (2011). https://doi.org/10.1016/j.nucengdes.2010.09.04GRS method for uncertainty and sensitivity evaluation of code results and applications
. Science and Technology of Nuclear Installations. (2008). https://doi.org/10.1155/2008/798901A new framework for sampling-based uncertainty quantification of the six-group reactor kinetic parameters
. Ann. Nucl. Energy. 127, 1-11 (2019). https://doi.org/10.1016/j.anucene.2018.11.043Analyzing nuclear reactor simulation data and uncertainty with the group method of data handling
. Nucl. Eng. Tech. 52(2), 287-295 (2020). https://doi.org/10.1016/j.net.2019.07.023Reactor simulations with nuclear data uncertainties
. Nucl. Eng. Des. 355,Uncertainty analysis of reactivity feedback coefficient for LFR core power control system during reactivity insertion accident
. Ann. Nucl. Energy. 160,Uncertainty and sensitivity analysis of a LBLOCA in a PWR Nuclear Power Plant: Results of the Phase V of the BEMUSE programme
. Nucl. Eng. Des. 241(10), 4206-4222 (2011). https://doi.org/10.1016/j.nucengdes.2011.08.019Uncertainty quantification of the power control system of a small PWR with coolant temperature perturbation
. Nucl. Eng. Tech. 54(6), 2048-2054 (2022). https://doi.org/10.1016/j.net.2022.01.005Uncertainty quantification of once-through steam generator for nuclear steam supply system using latin hypercube sampling method
. Nucl. Eng. Tech. 55(7), 2395-2406 (2023). https://doi.org/10.1016/j.net.2023.03.033Uncertainty and sensitivity analysis of in-vessel phenomena under severe accident mitigation strategy based on ISAA-SAUP program
. Nucl. Sci. Tech. 35(1), 11 (2024). https://doi.org/10.1007/s41365-024-01375-8Uncertainty quantification methodology for model parameters in sub-channel codes using MCMC sampling
. Nuclear Techniques. 46(12),Dynamic sensitivity and uncertainty analysis of a small lead cooled reactor
. Ann. Nucl. Energy. 144,Uncertainty analysis of rod ejection accident in VVER-1000 reactor
. Ann. Nucl. Energy. 132, 628-635 (2019). https://doi.org/10.1016/j.anucene.2019.06.061Uncertainty quantification and propagation of multiphysics simulation of the pressurized water reactor core
. Nucl. Technol. 205(12), 1618-1637 (2019). https://doi.org/10.1080/00295450.2019.1580533Robust optimization of control command for aerospace vehicles with aerodynamic uncertainty
. Chin. J. Aeronaut. 35(12), 226-241 (2022). https://doi.org/10.1016/j.cja.2022.01.011A cascade control strategy for a space nuclear reactor system
. Ann. Nucl. Energy. 28(2), 93-112 (2001). https://doi.org/10.1016/S0306-4549(00)00036-0Sliding mode control of the space nuclear reactor system
. IEEE Trans. Aerosp. Electron. Syst. 34(2), 579-589 (1998). https://doi.org/10.1109/7.670338Design of a model predictive power controller for an SP-100 space reactor
. Nucl. Sci. Eng. 154(3), 353-366 (2006). https://doi.org/10.13182/NSE06-A2638Core power control of a space nuclear reactor based on a nonlinear model and fuzzy-PID controller
. Prog. Nucl. Energy. 132,Modelling research on the control scheme and control characteristic of a small gas-cooled reactor
. Prog. Nucl. Energy. 147,Off-design performance and control characteristics of space reactor closed Brayton cycle system
. Ann. Nucl. Energy. 128, 318-329 (2019). https://doi.org/10.1016/j.anucene.2019.01.022Research for axial power distribution control of a space nuclear reactor based on nonlinear model
. Ann. Nucl. Energy. 168,State-space model construction and dynamic analysis for a space thermionic nuclear reactor
. Prog. Nucl. Energy. 163,Control strategy study and cascade control system design for space thermionic nuclear reactor
. Nucl. Eng. Des. 414,A fast and elitist multiobjective genetic algorithm: NSGA-II
. IEEE Trans. Evol. Comput. 6(2), 182-197 (2002). https://doi.org/10.1109/4235.996017Controller design and optimization of reactor power control system for ASPWR
. Prog. Nucl. Energy. 100, 233-244 (2017). https://doi.org/10.1016/j.pnucene.2017.06.006SP100 space reactor design
. Prog. Nucl. Energy. 42(3), 323-359 (2003). https://doi.org/10.1016/S0149-1970(03)90003-5SNPSAM-space nuclear power system analysis model
. in Symposium on space nuclear power systems. Jan 13-16, New Mexico, USA (1986).A new uncertainty-based control scheme of the small modular dual fluid reactor and its optimization
. Energies. 14(20), 6708 (2021). https://doi.org/10.3390/en14206708The authors declare that they have no competing interests.


