I. INTRODUCTION
As an alternative to a liquid scintillation counting system[1, 2] for measuring tritium concentrations in water, a new type of water monitoring system based on a solid scintillation material[3, 4] was previously developed. This system does not use a liquid scintillation cocktail[5] and generates no radioactive organic liquid waste. Moreover, continuous real-time measurements are possible, in contrast to a liquid scintillation counting system, for which batch measurements are unavoidable.
In a previous study[6], a prototype system was fabricated using a flow-cell detector containing a granular CaF2(Eu) solid scintillator with particle sizes of 50 μm. Performance tests were carried out over periods of 10 000 s, and a clear linear relation was found between the count rate and the tritium concentration. The detection limit for tritium in water was determined to be as low as 10 Bq/mL. However, a measurement time of 10 000 s is too long from the viewpoint of radiation management.
In the present study, the effect of background radiation reduction using lead shielding on decreasing the detection limit and the required measurement time was investigated.
II. WATER MONITORING SYSTEM
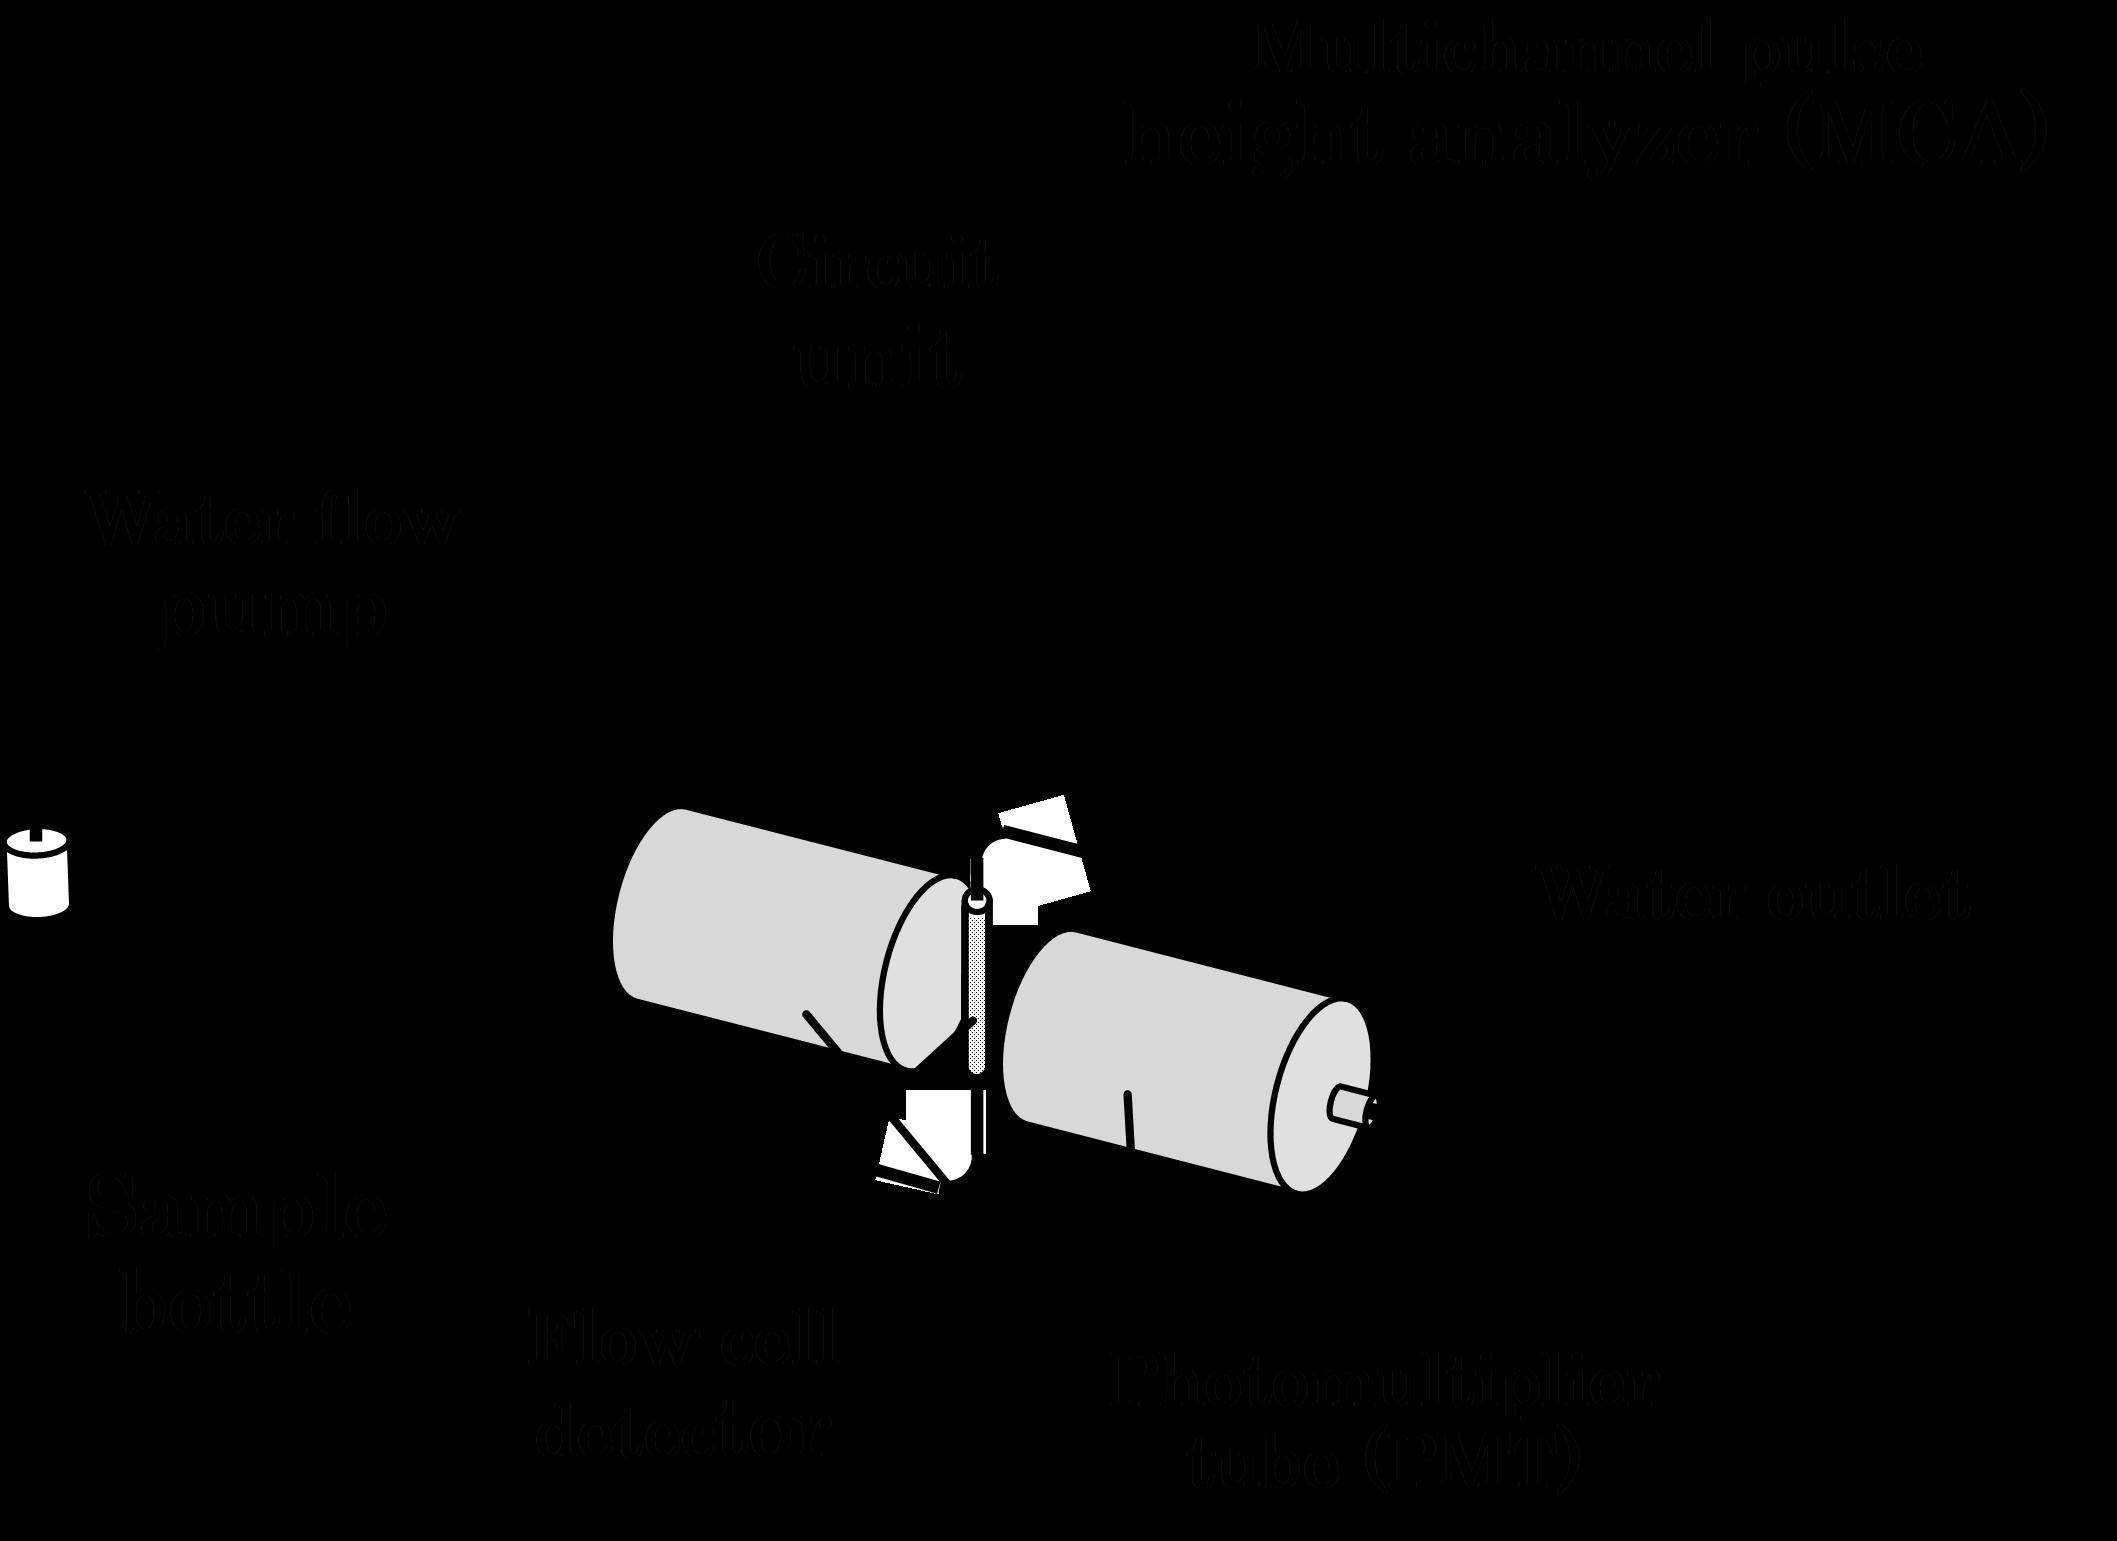
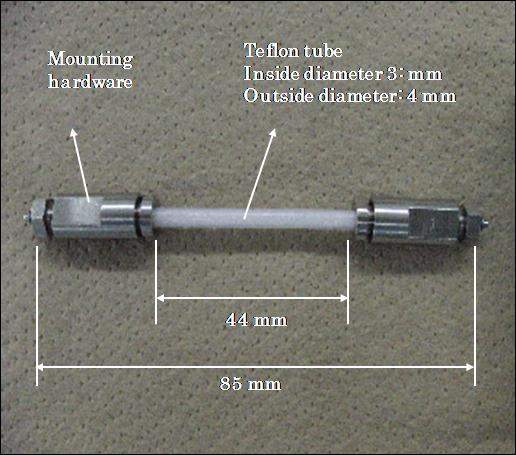
The proposed water monitoring system is shown schematically in Fig.1. It is composed of a flow-cell detector, a pair of photomultiplier tubes (PMTs), a high-voltage power supply and a coincidence counting module[7, 8], a water flow pump, a multichannel pulse height analyzer[9, 10] and a sample bottle. The high-voltage power supply and the coincidence counting module are not actually shown in Fig. 1 because they are installed in the circuit unit. The sample bottle was used to simulate an effluent water tank at a radiation facility and was filled with tritium water. The water flow pump was used to send a continuous flow of water into the flow-cell detector, which was placed between the two PMTs used for coincidence counting. Fig. 2 shows a photograph of the flow-cell detector. The main part of the detector is a 44-mm-long Teflon PFA (Perfluoroalkoxy) tube with inside and outside diameters of 3 mm and 4 mm, respectively, and an overall length of 85 mm. The solid scintillator material was 0.9 g of granular CaF2(Eu), which was stuffed into the tube to provide a clearance volume of about 0.18 mL, which corresponded to the volume of the water sample in the tube at any given time. Radiation detectors are usually shielded in order to reduce background counts due to external sources including cosmic rays. However, in the previous study no such shielding was used because the system was only a prototype designed to test whether continuous tritium measurements were possible or not. Therefore, in the present study, the effect of lead shielding on the measurement sensitivity was evaluated.


III. EXPERIMENTAL
To determine the effect of shielding, measurements were carried out on both tritium water and tritium-free water with and without the use of shielding. The tritium-free water was used to evaluate background radiation levels.
A. Measurements using tritium water
Seven water samples with tritium concentrations of about 1, 5, 10, 30, 50, 70, and 100 Bq/mL were prepared by diluting commercially available tritium water (9.932×10² and 1.007×10⁴ Bq/mL) with distilled water. The tritium concentrations in the samples were determined using a liquid scintillation counting system (Aloka LSC-5100).
For measurements involving tritium water, all equipment except for the multichannel pulse height analyzer (Ohyo Koken Kogyo Co., Ltd. MCA-600) was set up in a draft chamber in a radiation handling room and the tritium water was drained using water pipes. All devices, pipes, signal wires and supply cables were covered with translucent sheeting to avoid tritium contamination. The MCA-600 was set up just beside the draft chamber and was connected to the devices in the chamber using a signal cable. The tritium water sample flowed continuously through the cell at a fixed rate of 1 ml/min. The water pressure was about 1 MPa. Counts were accumulated for either 600 or 10 000 sec. After each measurement, the cell was cleaned by pumping tritium-free water through it, and the absence of tritium contamination was then certified by background measurements using the same accumulation time.
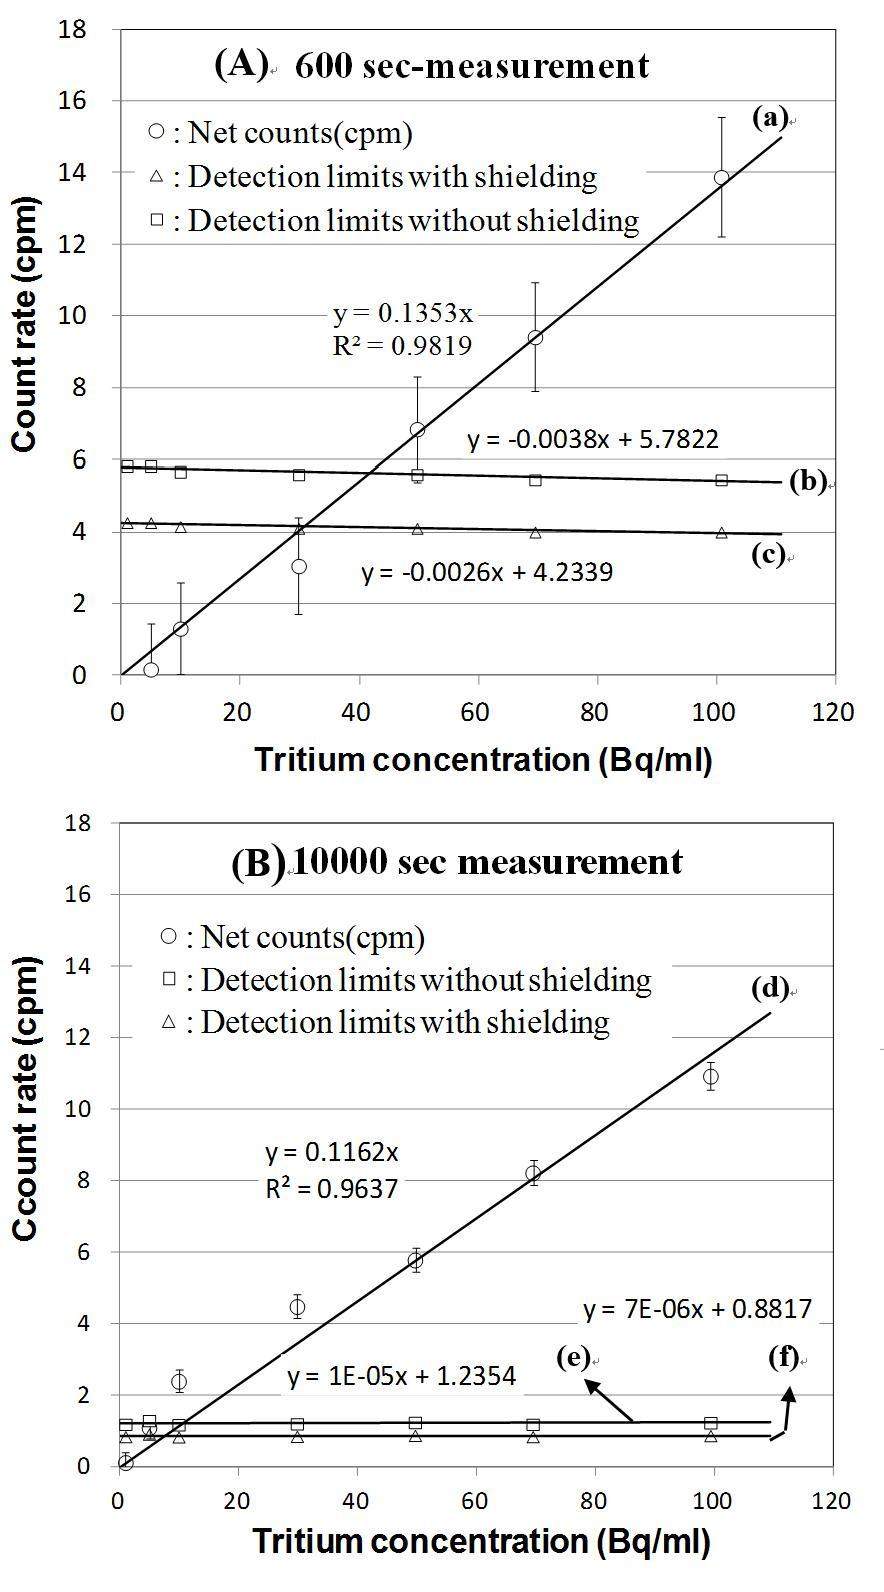
Figures 3(A) and 3(B) show the measured count rate as a function of tritium concentration for measurement times of 600 and 10 000 s, respectively.

The straight lines labeled (a) and (d) are linear regression fits to the data, and the corresponding R2 values are also shown. The high R2 values indicate that a good linear relation was obtained. Thus, from the slopes of the linear regression lines, the measured count rate can be directly converted into tritium concentration. Lines (b) and (e) represent the detection limit (DL) without shielding in terms of the count rate, which was calculated using Eq, [11].
DL: Detection limit (count rate in cpm)
ts: Sample measurement time (min)
tb: Background measurement time (min)
nb: Background count
k = 3 (JIS Z 4513-1977, certainty: 99.7%)
For measurement times of 600 and 10 000 s, the calculated detection limit was about 5.8 cpm and 1.2 cpm, respectively, corresponding to tritium concentrations of 42.7 Bq/mL and 10.6 Bq/mL. From Fig. 3, it can be seen that measurements were actually obtained below these limits, these results must be considered unreliable.
B. Measurements using tritium-free water
Since there was not enough clearance to enclose only the flow cell and PMTs in lead shielding, it was necessary to place lead blocks around the entire measurement system. This brought the overall weight to more than 900 kg, making it impossible to install it in the draft chamber. For this reason, it was set up on a concrete floor outside the radiation handling room. Since tritium water could not be used in this case, the effect of shielding was evaluated using background radiation only.
Considering a cubic volume around the water monitoring system, five different shielding configurations were considered: front and back sides, left and right sides, bottom side, top side and full shielding. The form of shielding used was lead blocks with dimensions of 5 cm × 20 cm × 10 cm. For each shielding configuration, measurements were carried out for 10 000 s and the count reduction due to the shielding was calculated using the following equation.
Cbdec: Count reduction
CWS: Count with shielding
CWOS: Count without shielding
The calculated results are shown in Table 1. For full shielding, the count reduction was highest at 53.8%. The least effective shielding configuration was bottom-side shielding. Even though the flow cell detector was installed vertically in the measuring device, and its projected area on the front, back, left and right sides was larger than that on the top and bottom sides, top-side shielding was the second most effective method. This result may be useful when designing detector shielding in future studies. Assuming that the background count nb is reduced by a factor of 2 using full shielding, the detection limit was again calculated using Eq. 1. The results are plotted as lines (c) and (f) in Fig.3. It can be seen that for both measurement times, there is a clear reduction in the detection limit. For a measurement time of 600 s, the detection limit in terms of count rate decreases from 5.8 to 4.2 cpm, corresponding to a decrease from 42.7 to 31.3 Bq/mL (35%). For a measurement time of 10 000 s, the detection limit in terms of count rate decreases from 1.2 to 0.88 cpm, corresponding to a decrease from 10.6 to 7.6 Bq/mL (37.5%). Thus, 5-cm-thick lead shielding reduces the detection limit for tritium by at least 35%.
| Shielding applied plane faces(Pb-5 cm) | Decrease rate of BKG counts (%) |
|---|---|
| Front and Back | 9.0 |
| Light and Left | 9.6 |
| Bottom | 6.1 |
| Top | 12.1 |
| Full | 53.8 |
IV. CONCLUSION
A prototype water monitoring system using a CaF2(Eu) solid scintillator was previously developed for real-time detection of tritium. In order to reduce the detection limit and the required measurement time, the effect of background reduction using 5-cm-thick lead shielding was investigated. Five different shielding configurations were evaluated. Following full shielding, the most effective configuration was found to be top-side shielding. Full shielding reduced the background count by 53.8%. The results indicated that using such shielding, a reduction of at least 35% in the detection limit could be obtained. This corresponded to a decrease from 42.7 to 31.3 Bq/mL for a measurement time of 600 s, and 10.6 to 7.6 Bq/mL for a measurement time of 10 000 s.


