Introduction
Its high strength-to-weight ratio and relatively low activation rate make aluminum one of the most attractive materials for many structural applications, such as fusion reactors, accelerator subcritical systems, and Generation IV reactors [1, 2]. The cross-section of aluminum is of great significance not only for its general applicability in testing nuclear models but also for the estimation of displacement damage in A1-metal alloys and the radioactivity of the long-lived ground state 26Al (T1/2=7.17×105 a) that produced 1808.65 keV gamma ray [3]. In addition, a high threshold (13.5 MeV) and a dramatic increase in the 27Al(n,2n)26Al reaction cross-section with neutron energy in the 14 MeV region plays an essential role in the monitoring of ion temperature in a D-T fusion plasma, as pointed out by Smither and Wallner et al. [4, 5].
However, owing to the long half-life of 26Al(Ma) and the small cross-section (mb) of the 27Al(n,2n)26Al reaction near the threshold, it is challenging to quantify the cross-section of the 27Al(n,2n)26Al reaction using gamma spectrometry. As the most sensitive measurement technology for 26Al to date [6], accelerator mass spectrometers (AMS) have significantly shortened the irradiation and measurement time of the 27Al(n,2n)26Al reaction channel and effectively improved the accuracy of the data. In particular, accelerator mass spectrometers have been widely used to measure the cross sections and half-lives of nuclear reactions associated with long-lived nuclides [7-11]. Nevertheless, cross-sectional measurements of the 27Al(n,2n)26Al reaction are insufficient, and the available data differ significantly, as illustrated in Fig. 1, because of the limitations of single-energy neutron sources and high-precision accelerator mass spectrometers.
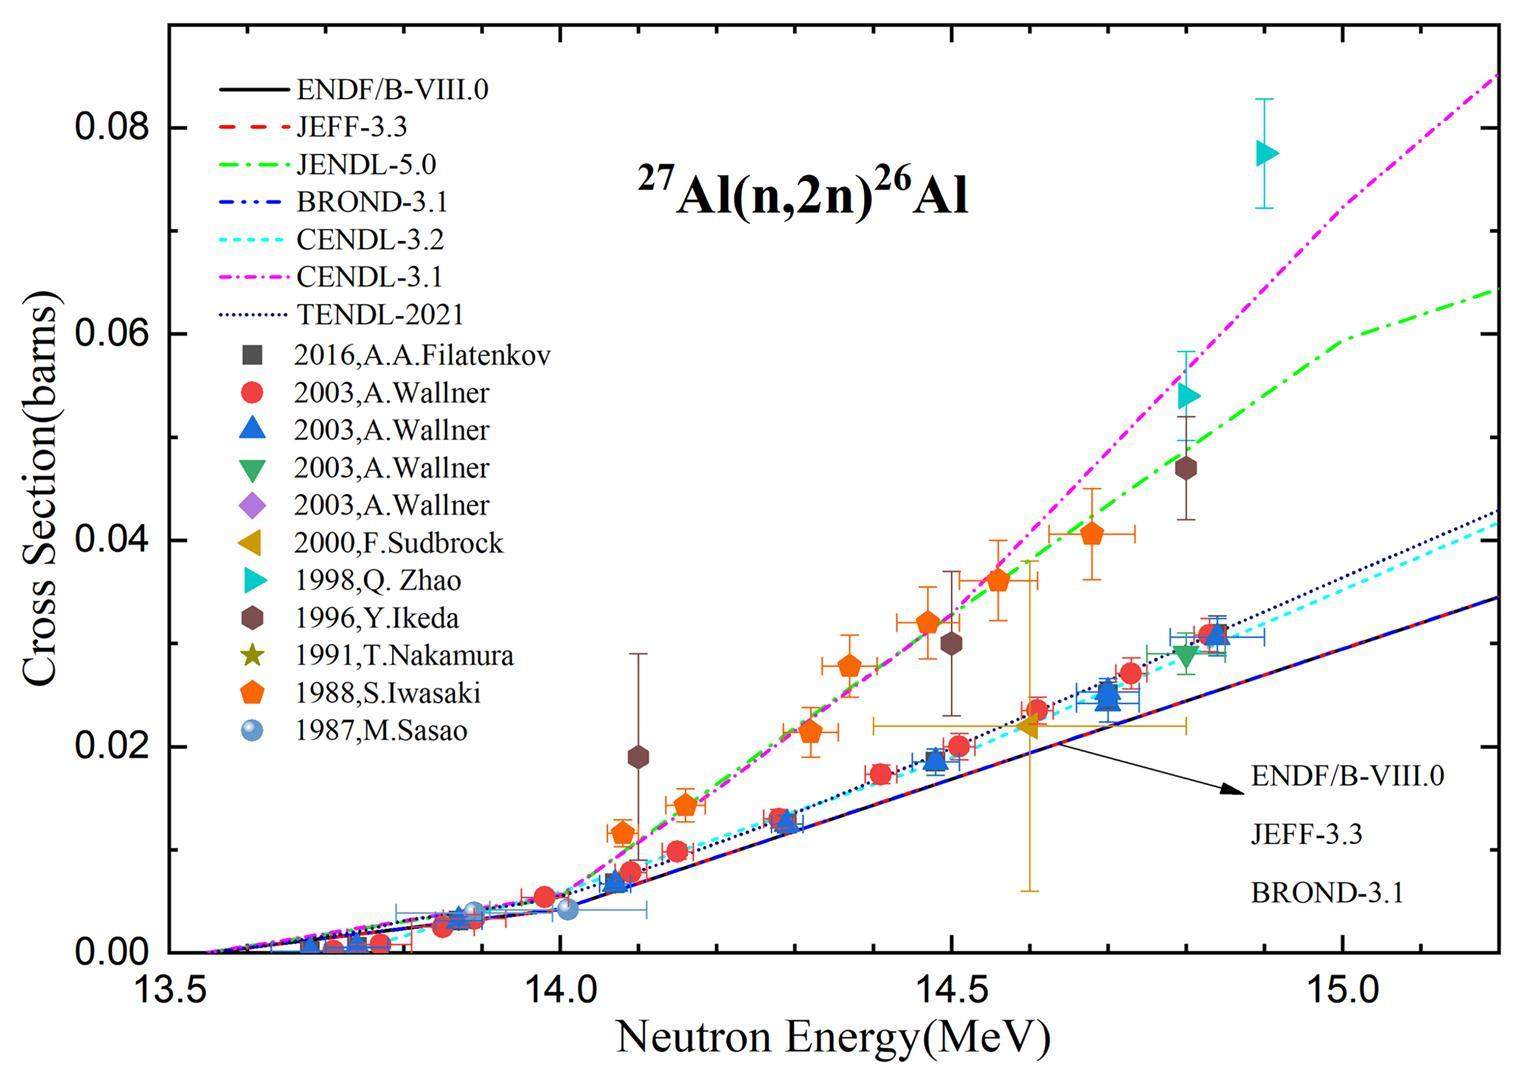
The following is a brief overview of the previous 27Al(n,2n)26Al reaction measurement procedure. With the emergence of accelerator mass spectrometry technology, the first measurement of the 27Al(n,2n)26Al cross-section was reported by Smither et al. [4] in 1984; however, these data were not included in the experimental nuclear reaction data (EXFOR). Using a well-shielded germanium detector, Sasao detected 1.809 MeV γ rays following the β decay of 26Al to calculate the 27Al(n,2n)26Al reaction cross-section in 1987 [12]. Although the uncertainty of the neutron energy was measured by the ratio of the 90Zr(n,2n)89 m+gZr cross-section to the 93Nb(n,2n)92 mNb near 14 MeV, the cross-section error details were not given. In 1988, Iwasaki et al. conducted irradiation for several months using a DT generator. The measurements were performed after approximately one year of cooling. In 1991, 15–34 MeV neutrons were produced by bombarding a 1 mm-thick beryllium target with a 3–5 microamp proton beam. Nakamura et al. [13] provided only high-energy cross-section data using the AMS. In 1996, Al samples were irradiated for four days, and γ-ray measurements lasted for more than 1.7 years using a Ge detector with high detection efficiency. The uncertainty of the neutron energy is not given in the original literature, whereas the cross-section uncertainty is in the range of 10% to 50%. In 1998, two samples were irradiated with a D-T neutron beam for approximately 20 d. Qiang et al. obtained the first 27Al(n,2n)26Al cross-section at two neutron energy points using a 6 MV AMS [14] in China, and the data were the maximum cross-section in the 14 MeV neutron energy region. In 2000, Sudbrock et al. reported four different reaction cross-section measurements at 14.6 MeV neutron energy via AMS [1]. Although the error of the 27Al(n,2n)26Al reaction in Sudbrock’s work is more than 70%, the cross-section also falls within the range of values predicted from the systematics of the (n,2n) reaction cross sections at 14.6 MeV. In 2003, Wallner et al. [5] provided a comprehensive study on the measurement of the 27Al(n,2n)26Al reaction cross-section. At 14.8 MeV, the cross-section values of the 27Al(n,2n)26Al reaction are 30% and 40% lower than Y. Ikeda’s and Q. Zhao’s, respectively. In 2016, A.A. Filatenkov gave results consistent with Wallner’s study.
Although the 27Al(n,2n)26Al reaction was carefully measured and evaluated, as shown in Fig. 1, there are still non-negligible discrepancies between the values recommended by the different evaluated nuclear data libraries. The 14 MeV neutron energy region has a 50% difference between the evaluated values [15-18]. The evaluated values of CENDL-3.2 were significantly different from those of CENDL-3.1. Considering the insufficient experimental data, further investigation is required for the evaluated database based on various theoretical models. In conclusion, there are two distribution trends in the existing experimental and evaluation data. Therefore, it is essential to clarify the divergence between the two distribution trends for application.
In the present work, the cross sections for the 27Al(n,2n)26Al reaction in the 14 MeV neutron energy region are determined by utilizing the AMS technique with careful consideration of the experimental background to meet the requirements of nuclear physics and nuclear engineering. After comparing the (n,2n) cross sections of 27Al obtained in the present measurement with the existing data and evaluation values, the new experimental results determined a new excitation function more accurately.
Experimental procedure
Neutron source
In the neutron energy range from 13.5 to 15.0 MeV, irradiations were performed at the K-400 neutron generator of the China Academy of Engineering Physics (CAEP). The neutron yield of the K-400 neutron generator is approximately (3–5)× 1010 n/s. The neutrons were produced by a T(d,n)4He reaction with a D+ beam current of 250 μA. The thickness of the solid tritium-titanium (T-Ti) target used in the generator was 2.5 mg/cm2, and the energy of the incident D+ beam was 300 keV. An Au-Si surface barrier detector was installed at 135 with respect to the D+ beam and at a distance of 100 cm from the T-Ti target for the detection of accompanying particles. The neutron flux was recorded and kept every ten seconds to obtain the neutron flux fluctuation over the entire irradiation period.
Samples irradiation and neutron energy
High purity aluminum (0.5 mm, 99.999% purity) foil was sandwiched between natural zirconium (0.1 mm, 99.5% purity) and niobium (0.1 mm, 99.95% purity) foils. The first set of foils was tailored to form a round disk with a diameter of 20 mm. Four sandwich samples were placed approximately 5.0 cm away from the T-Ti target relative to the deuteron beam’s incident angles of 0, 30, 60 and 100. The dimensions of the second set of foils were 0.5 cm in width and about 4 cm in length, which were in arc shape and placed about 3.0 cm away from the T-Ti target and about 60 to 135 relative to the deuterium ion incident direction. The schematic diagram of experimental geometry is shown in Fig. 2. The second set of foils was cut into 8 squares with a side length of 0.5 cm after the irradiation. The precise weight of each foil was determined with an analytic balance (±0.01 mg) after irradiation.
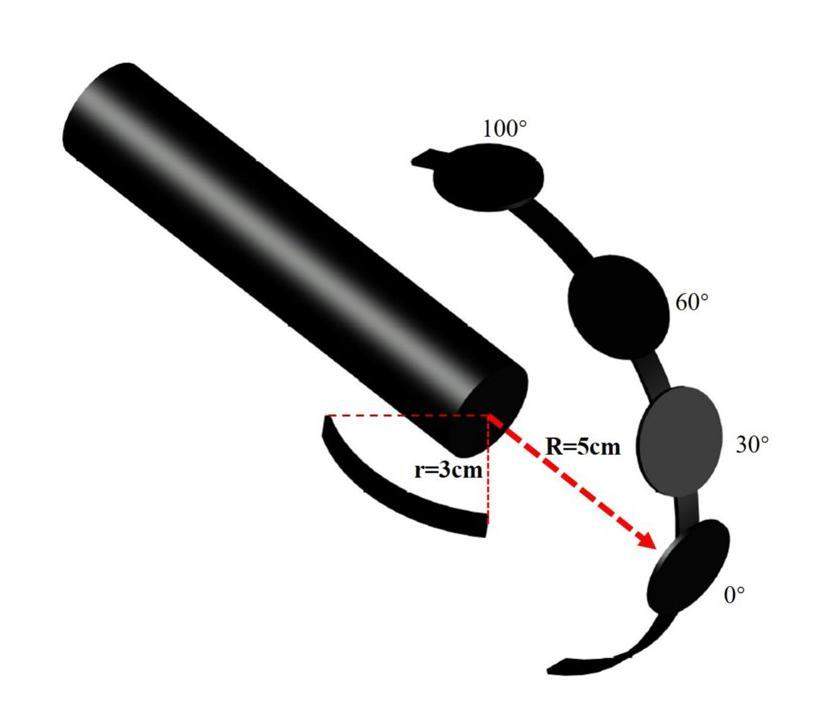
Two sets of aluminum samples placed at different locations from the tritium titanium target were irradiated for 20 h. It is essential to accurately determine the neutron energy for cross-sectional measurements, particularly those near the threshold. The neutron energies were measured using the Zr-Nb method [19, 20]. As a cross-check, the neutron energies of the first set of foils were calculated using an improved theoretical method, which was used to determine the mean D-T neutron energies in a large solid angle sample [21, 22]. There are two sets of parameters for the Zb-Nb method, and the neutron energies were calculated using these two sets of parameters. The mean value of the two results was used to determine the final neutron energy, as described in Sect. 5. The uncertainties in the incident neutron energies given above are the quadratic roots of the summed square of the uncertainties caused by the results of the activity measurements for Zr and Nb foils [23]. The entire available energy range starts from the threshold of the (n,2n) reaction to approximately 14.90 MeV. It is reasonable to suppose that the scattered neutrons from the target construction and the surrounding environment are insignificant because of the high threshold of the 27Al(n,2n)26Al reaction. In addition, the cross-section of 93Nb(n,2n)92 mNb was used as a standard to monitor the integral neutron flux for all samples. The relevant nuclear parameters for 93Nb(n,2n)92 mNb and 90Zr(n,2n)89 m+gZr are listed in Table 1.
| Reaction | Abundance of target Isotope η (%) | Q Value (MeV) | Half-life of product T1/2 | γ-ray energy (keV) | γ-ray intensity |
|---|---|---|---|---|---|
| 93Nb(n,2n)92 mNb | 100 | -8.831 | (10.15±0.02) d | 934.44 | 99.15±0.04 |
| 90Zr(n,2n)89 m+gZr | 51.45 | -11.965 | (78.41±0.12) h | 909.15 | 99.05±0.03 |
| 27Al(n,2n)26Al | 100 | -12.275 | (7.14±0.24)×105 a | 1808.65 | 99.76±0.04 |
Measurement of 92 mNb and 89 m+gZr activity
After irradiation, there was a cooling period. Then, the activities of those Nb and Zr samples were determined using an HPGe γ-ray detector(as shown in Fig. 3). Before Nb and Zr samples were measured, a series of standard point sources (22Na, 60Co,133Ba, 137Cs, and 152Eu) of known activity were used to determine the absolute full-energy peak efficiency of a lead-shielded high-purity germanium detector (ORTEC, USA). The radioactivity of the reaction product was determined via the well-calibrated HPGe detector with a relative efficiency of 68% and an energy resolution of 1.82 keV FWHM at 1.33 MeV. The distance between the sample and the detector was 5.0 cm. Efficiency calibration was determined using point-like standard gamma-ray sources. The detection efficiencies for the point source placed at a distance of 5.0 cm from the detector were determined using Eq. (1)
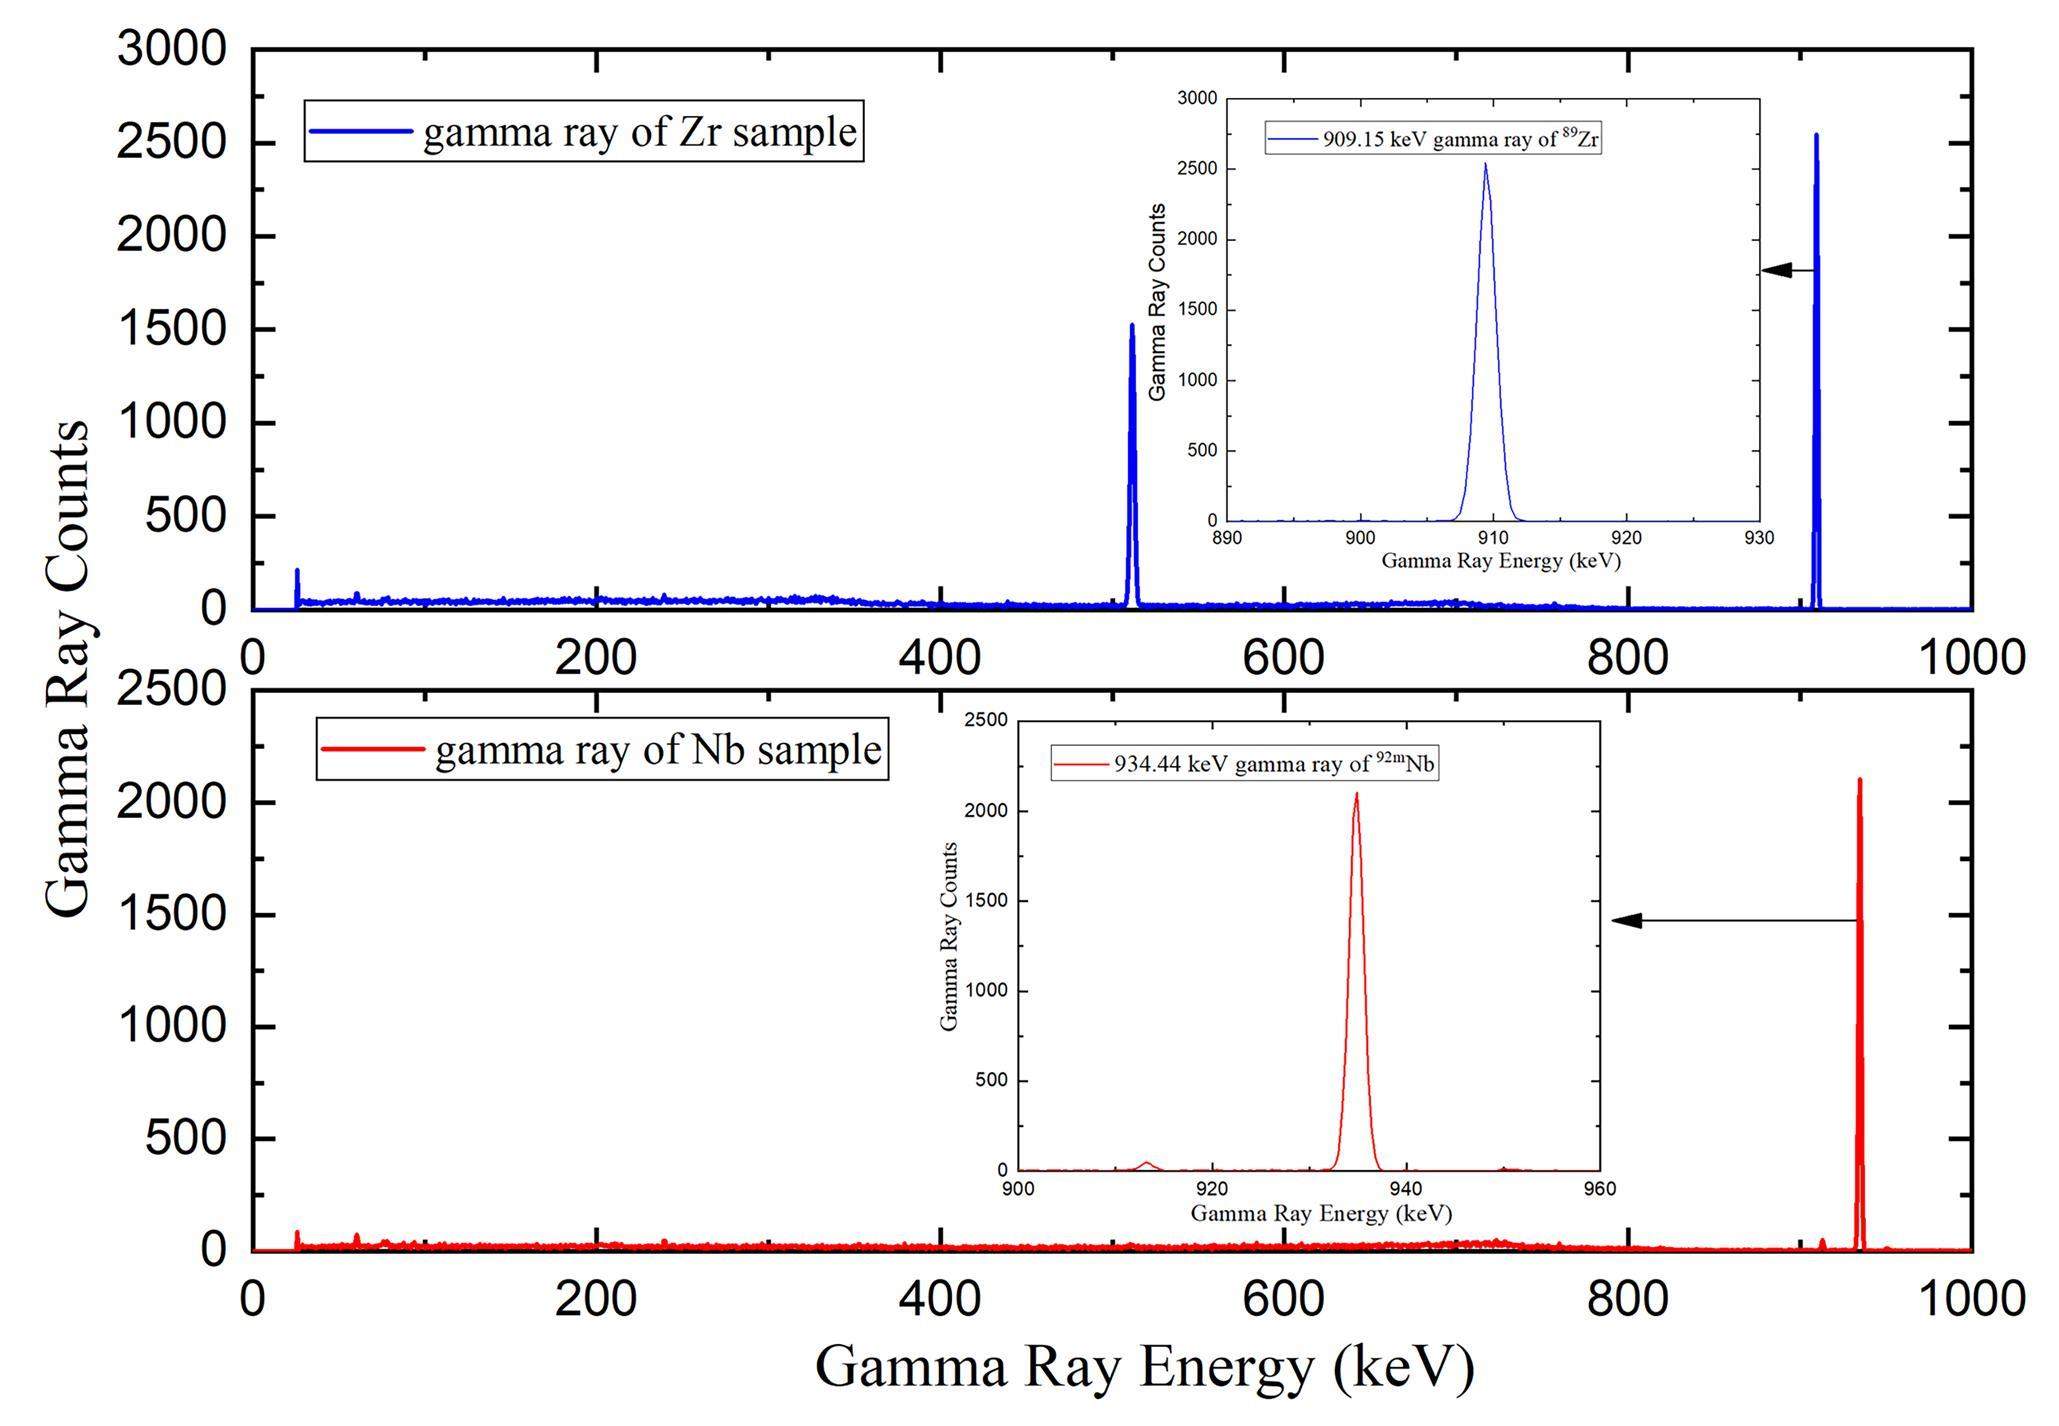
The efficiency values obtained for the characteristic γ-ray energies of the point source are described using an exponential function [24] expressed in Eq. (2). The detector efficiency for the characteristic γ-ray energies of 92 mNb and 89m+gZr was then obtained using Eq. (2). The detector efficiency uncertainties of 92mNb and 89m+gZr were obtained by evaluating the uncertainties of the standard sources.
26Al measurement at GYIG 1 MV AMS
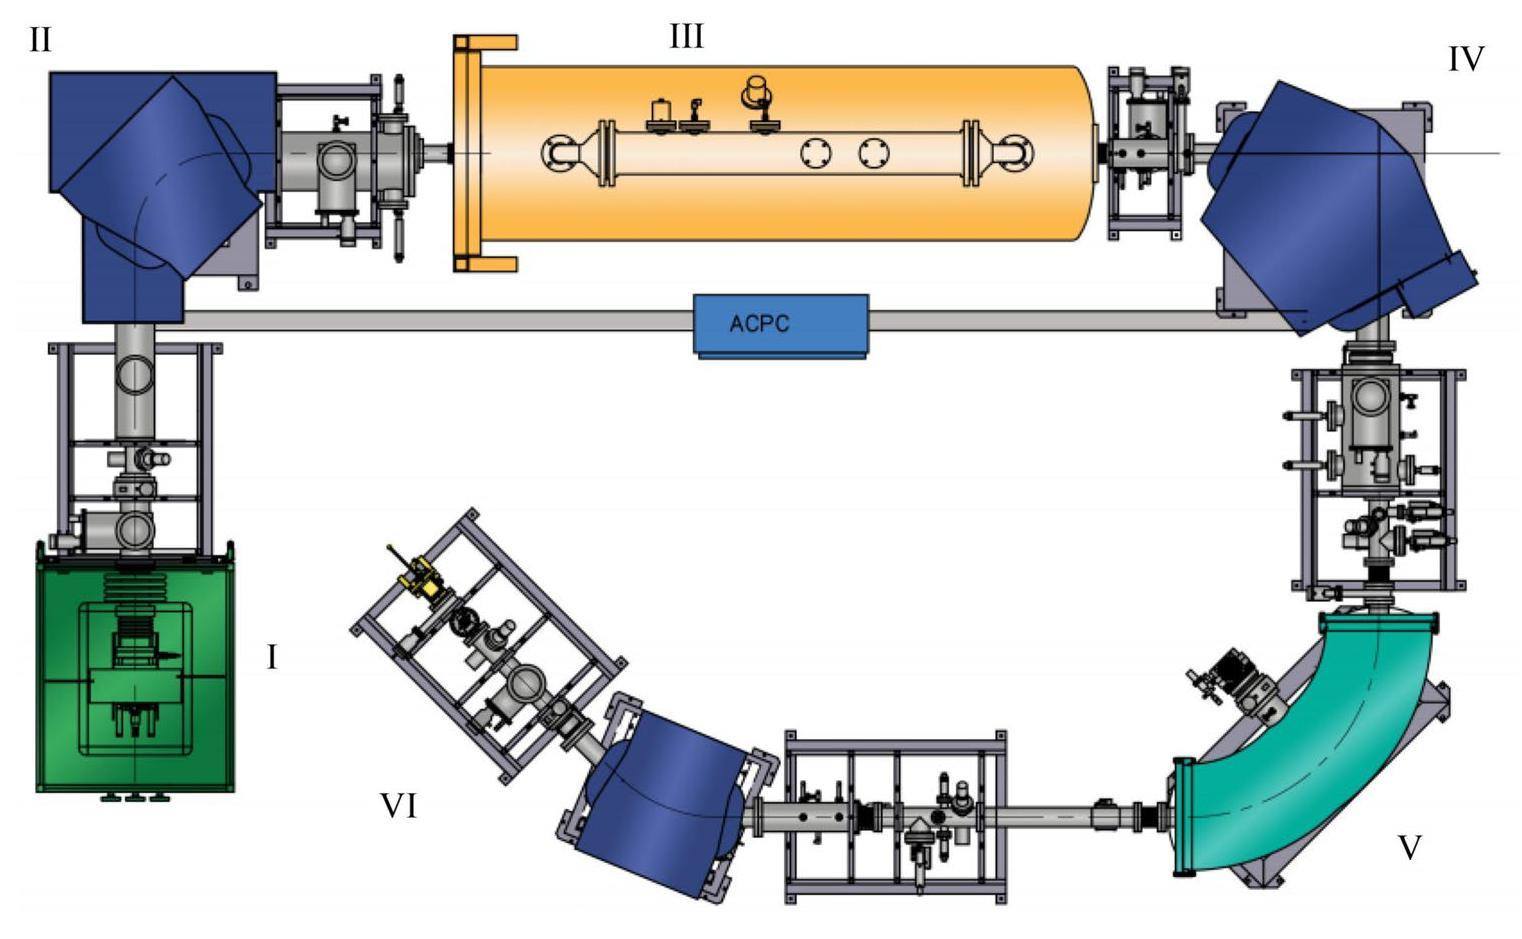
Because 26Al has a half-life of millions of years, it is difficult to measure 26Al with high-purity germanium; therefore, an ultrasensitive AMS was needed to measure 26Al in the present work. As a dedicated accelerator mass spectrometer, the GYIG 1 MV AMS instrument has been installed at the Institute of Geochemistry, Chinese Academy of Sciences since 2022 and was designed for multinuclide measurements such as 10Be, 14C, 26Al, and 41Ca. After the installation was completed, the relevant acceptance and commissioning works were also completed. The present study was performed using a 1 MV AMS. A schematic of the GYIG AMS facility (model 3SDH-1 Pelletron) is shown in Fig. 4 [25], which mainly includes a cesium sputter negative ion source, a low-energy injection system (electrostatic analyzer and LE magnet), a tandem accelerator, a high-energy analysis system (HE analyzing magnet and electrostatic analyzer), and an energy-sensitive detector [26, 27].
Al2O3 was chosen as the proper sputter material. After neutron activation, approximately 0.08 g of aluminum foil was weighed and dissolved in 5 ml of hydrochloric acid (4.5 M) to ensure a uniform mixture of the irradiated sample material. The solutions were diluted with deionized water to 20 mL, respectively. The pH of the solution was adjusted by ammonium hydroxide to 9. A saturated ammonium oxalate solution was added to precipitate aluminum as aluminum hydroxide (Al(OH)3). The Al(OH)3 precipitate was separated by centrifugation at 10000 rpm for 5 min, washed once with saturated ammonium oxalate solution, and rinsed twice with deionized water. The aluminum hydroxide precipitate was transferred to a ceramic crucible. The sample was dried at 60 °C and then heated to 900 °C in a muffle furnace to obtain aluminum oxide powder. After mixing with Ag powder (Mass: Mass=1:1), the prepared samples were pressed into a copper holder, which acted as the cathode in the cesium sputtering negative-ion source, capable of holding 40 cathodes of solid samples [28, 29].
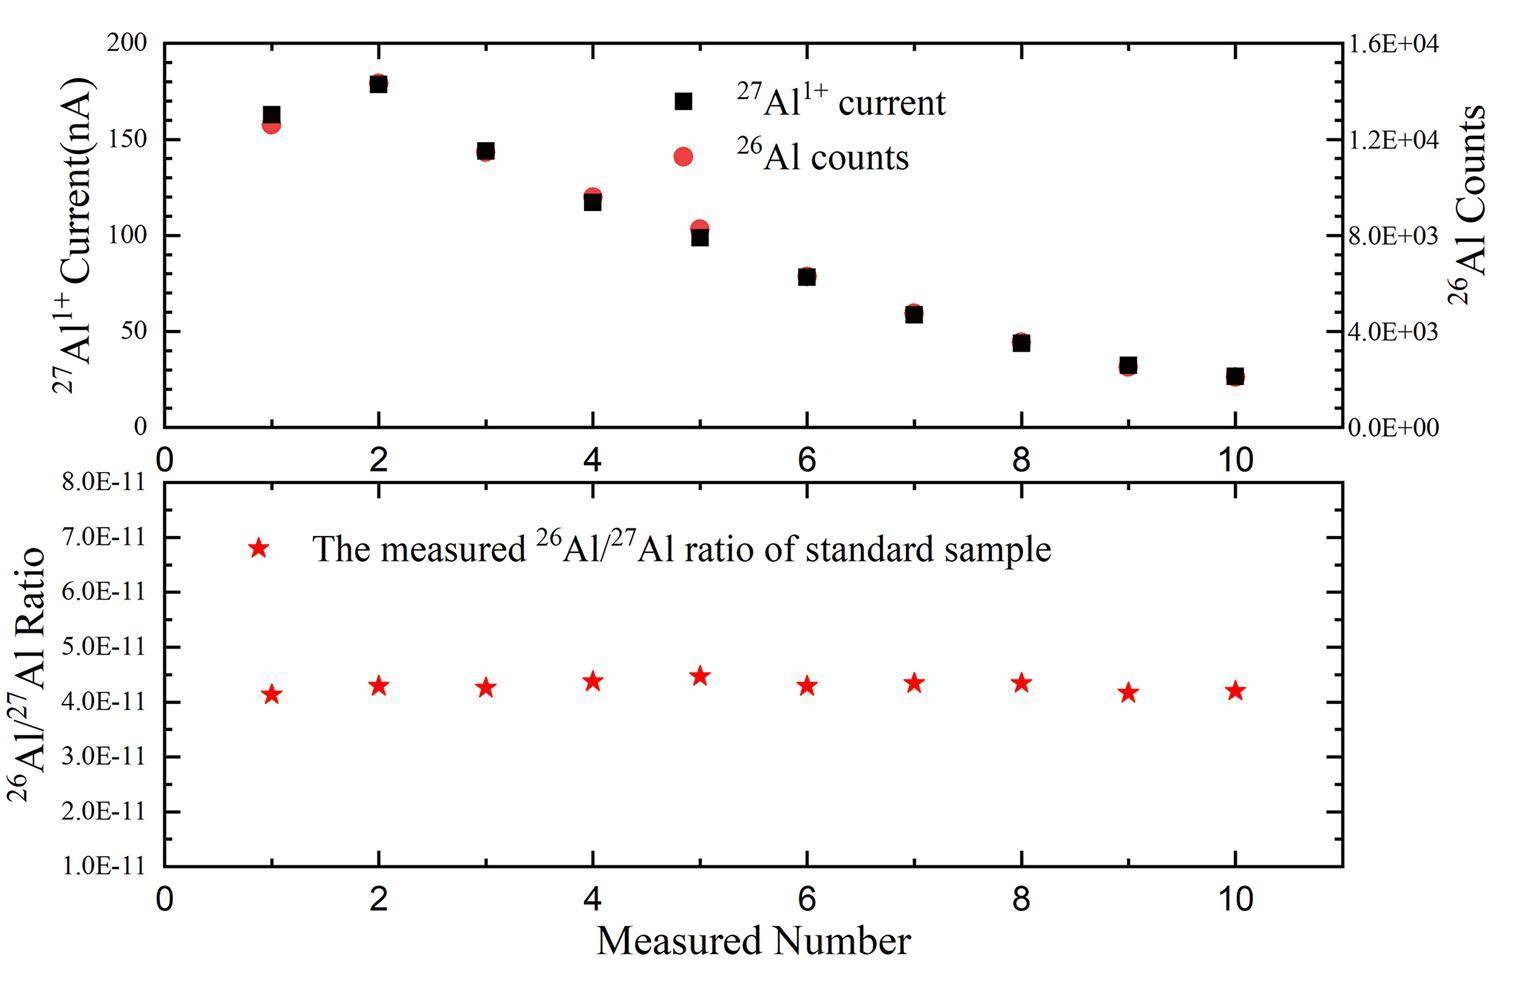
Before the measurement of 26Al, the pilot 27Al- beam was injected into the accelerator after being selected by the injection magnet, and the current of 27Al- was 0.1–1 μA. Because the electron affinity of aluminum is relatively low, the intensity of the 27Al- current from the cesium sputtering negative ion source is insufficient compared to C- and BeO- in this machine. Fortunately, Mg- ions are unstable; thus, isobaric interference is insignificant in the 26Al measurement. The accelerator terminal voltage was set to 0.41 MV, and negative ions were accelerated in the first part of the accelerator. After passing through argon gas at a pressure of 27 Torr, the negative ions were stripped into positive ions with different charge states via collisions and Coulomb breakups and then accelerated in the second part of the accelerator. 27Al1+ particles were chosen by high-energy analysis system. The beam transmission was approximately 30%, which is the ratio of the 27Al current measured in the Faraday cups before and after passing through the high-energy magnet. After the 27Al1+ ions reached the Faraday cup before reaching the detector, all parameters were adjusted to fit the 26Al beam transport. Then, the sequential injection of 27Al and 26Al is achieved with a magnet bias supply coupled to the ‘bouncer magnet.’ The current of the 27Al1+ ion was integrated at the offline Faraday cup, whereas the radioisotope 26Al was measured using an ionization chamber, which provides high resolution in the energy measurement [30]. Under the influence of the sample preparation level, mixing uniformity with the conductive medium, and sample bombardment degree in the ion source, the multiple measurement current value of 27Al1+ in a high-energy Faraday cup can fluctuate between tens and hundreds of nA, and the 26Al count follows the same proportion. Consequently, the 26Al/27Al ratio measured between different rounds exhibited little deviation(as shown in Fig. 5). Because AMS is a relative measurement, the standard sample, processing the blank sample, and unknown sample should be measured sequentially. Meanwhile, the raw ratio results were subtracted from the processing blank value and normalized to the standard sample nominal value.
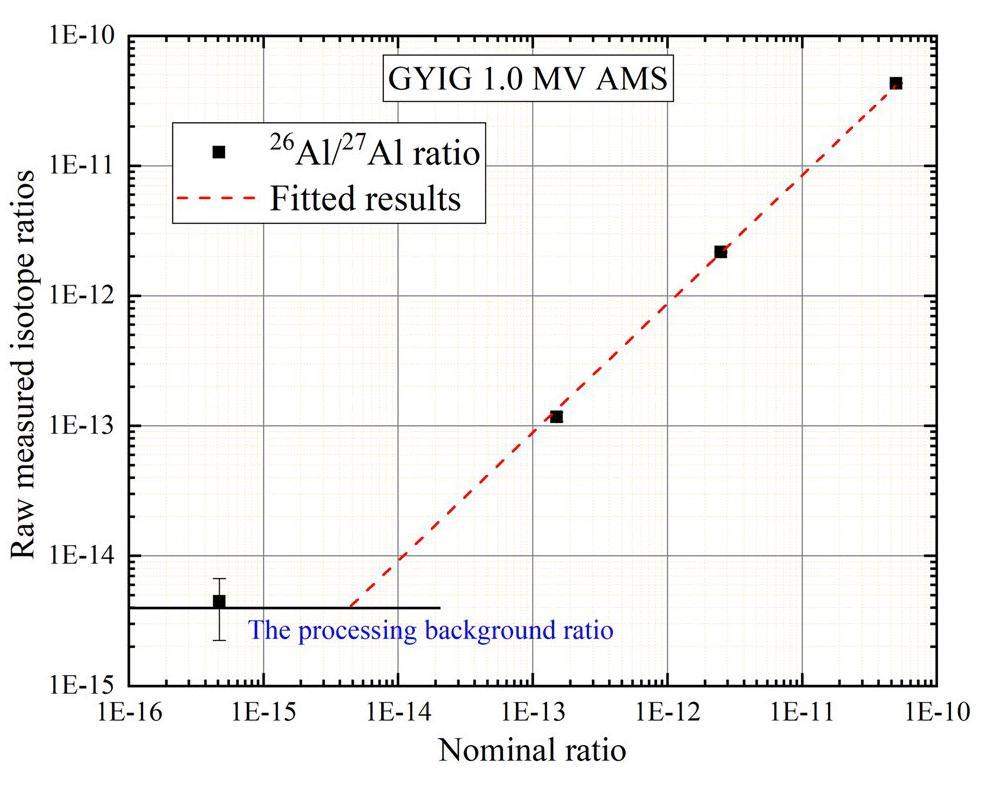
To validate the performance of the newly installed instrument, a series of standard samples with different gradients and blank samples were used. The ratio of the blank samples was less than 4×10-15. The ratios of the Al standard (5.00×10⁻¹¹) were reproduced to be better than 1% (as shown in Fig. 6). To measure the (n,2n) cross-section, the raw ratios(before normalization) of 26Al/27Al are between 6×10-15 and 10-13, which are much larger than the machine background of 26Al/27Al at the GYIG 1 MV AMS. To verify the measurement results of the GYIG 1 MV AMS, four samples and one blank sample were sent to the Xi’an Accelerator Mass Spectrometry Center. The measurement standard for 26Al/27Al is 1.065×10⁻¹¹ in Xi’an and the background is 4.71×10⁻¹¹ [30]. The values of the four irradiated samples were between 1.77×10⁻¹¹ and 2.09×10⁻¹¹, which is in good agreement with the results of GYIG 1 MV AMS.
Data analysis
The experimental cross-section
| Measured ratio | Neutron energy (MeV) | Neutron fluence (n/cm2) | The ratio of 26Al/27Al | Cross section (mb) |
|---|---|---|---|---|
| 1.85±0.05 | 14.91±0.18* | 5.62×10¹² | [(2.09±0.10)×10-13]a | 37.20±2.80 |
| 1.75±0.05 | 14.80±0.16* | 3.50×10¹² | [(1.07±0.07)×10-13]a | 30.60±2.72 |
| 1.60±0.05 | 14.51±0.15* | 3.77×10¹² | [(7.18±0.59)×10-14]a | 19.00±1.92 |
| 1.54±0.05 | 14.37±0.09 | 1.22×10¹³ | [(1.69±0.14)×10-13]b | 13.79±1.42 |
| 1.40±0.05 | 14.17±0.09 | 1.44×10¹³ | [(1.46±0.13)×10-13]b | 10.13±1.10 |
| 1.35±0.05 | 14.10±0.09 | 1.39×10¹³ | [(1.01±0.16)×10-13]b | 7.27±1.20 |
| 1.31±0.04 | 13.99±0.09* | 3.46×10¹² | [(1.77±0.32)×10-14]a | 5.11±0.97 |
| 1.29±0.04 | 13.95±0.09 | 1.46×10¹³ | [(4.52±0.89)×10-14]b | 3.10±0.63 |
| 1.23±0.04 | 13.86±0.08 | 7.10×10¹² | [(1.60±0.38)×10-14]b | 2.26±0.55 |
| 1.11±0.04 | 13.70±0.07 | 9.68×10¹² | [(7.72±2.24)×10-15]b | 0.80±0.24 |
| 1.09±0.04 | 13.68±0.07 | 1.25×10¹³ | [(4.47±1.83)×10-15]b | 0.36±0.15 |
| 1.03±0.04 | 13.61±0.06 | 1.42×10¹³ | [(4.09±2.05)×10-15]b | 0.29±0.15 |
Neutron fluence
The neutron fluence of the aluminum sample during irradiation was calculated using Eq. (4) [23].
Uncertainty analysis
The total uncertainty of the 27Al(n,2n)26Al reaction consists of the monitoring reaction and the AMS contributions. Individual contributions to the total uncertainty are listed in Table 2. The uncertainty in the AMS measurements includes the statistical uncertainty (4.9%-50.2%), reproducibility of the measurement (1.0% for the standard sample), and systematic contribution from the measurement relative to reference materials (1.0%). As the most commonly used standard cross-section, the uncertainty of 93Nb(n,2n)92mNb is approximately 1.5% [5]. The uncertainty (3.0%) of the HPGe efficiency calibration was derived from the accuracy of the calibration sources and calibration procedure. The total uncertainty was estimated using the square root of the quadratic sum of the above sources, and the overall uncertainties ranged from 7% to 50.2%.
| Source of uncertainty | Uncertainty (%) |
|---|---|
| Counting statistics of 26Al | 4.9-50.0 |
| Reproducibility of standard sample | ∼1.0 |
| Counting statistics of 92 mNb | 1.0 |
| Half-life of 92 mNb | 0.2 |
| Sample mass | 0.1 |
| Neutron flux fluctuation factor [19, 32] | 3.0 |
| Cross section of 93Nb(n,2n)92 mNb [5] | ~1.5 |
| Standard sample (26Al/27Al) | 1.0 |
| Total correction factor (F) | 1.0 |
| Branching ratio | 0.5 |
| Detection efficiency | 3.0 |
| Total | 6.9-50.2 |
Theoretical calculations
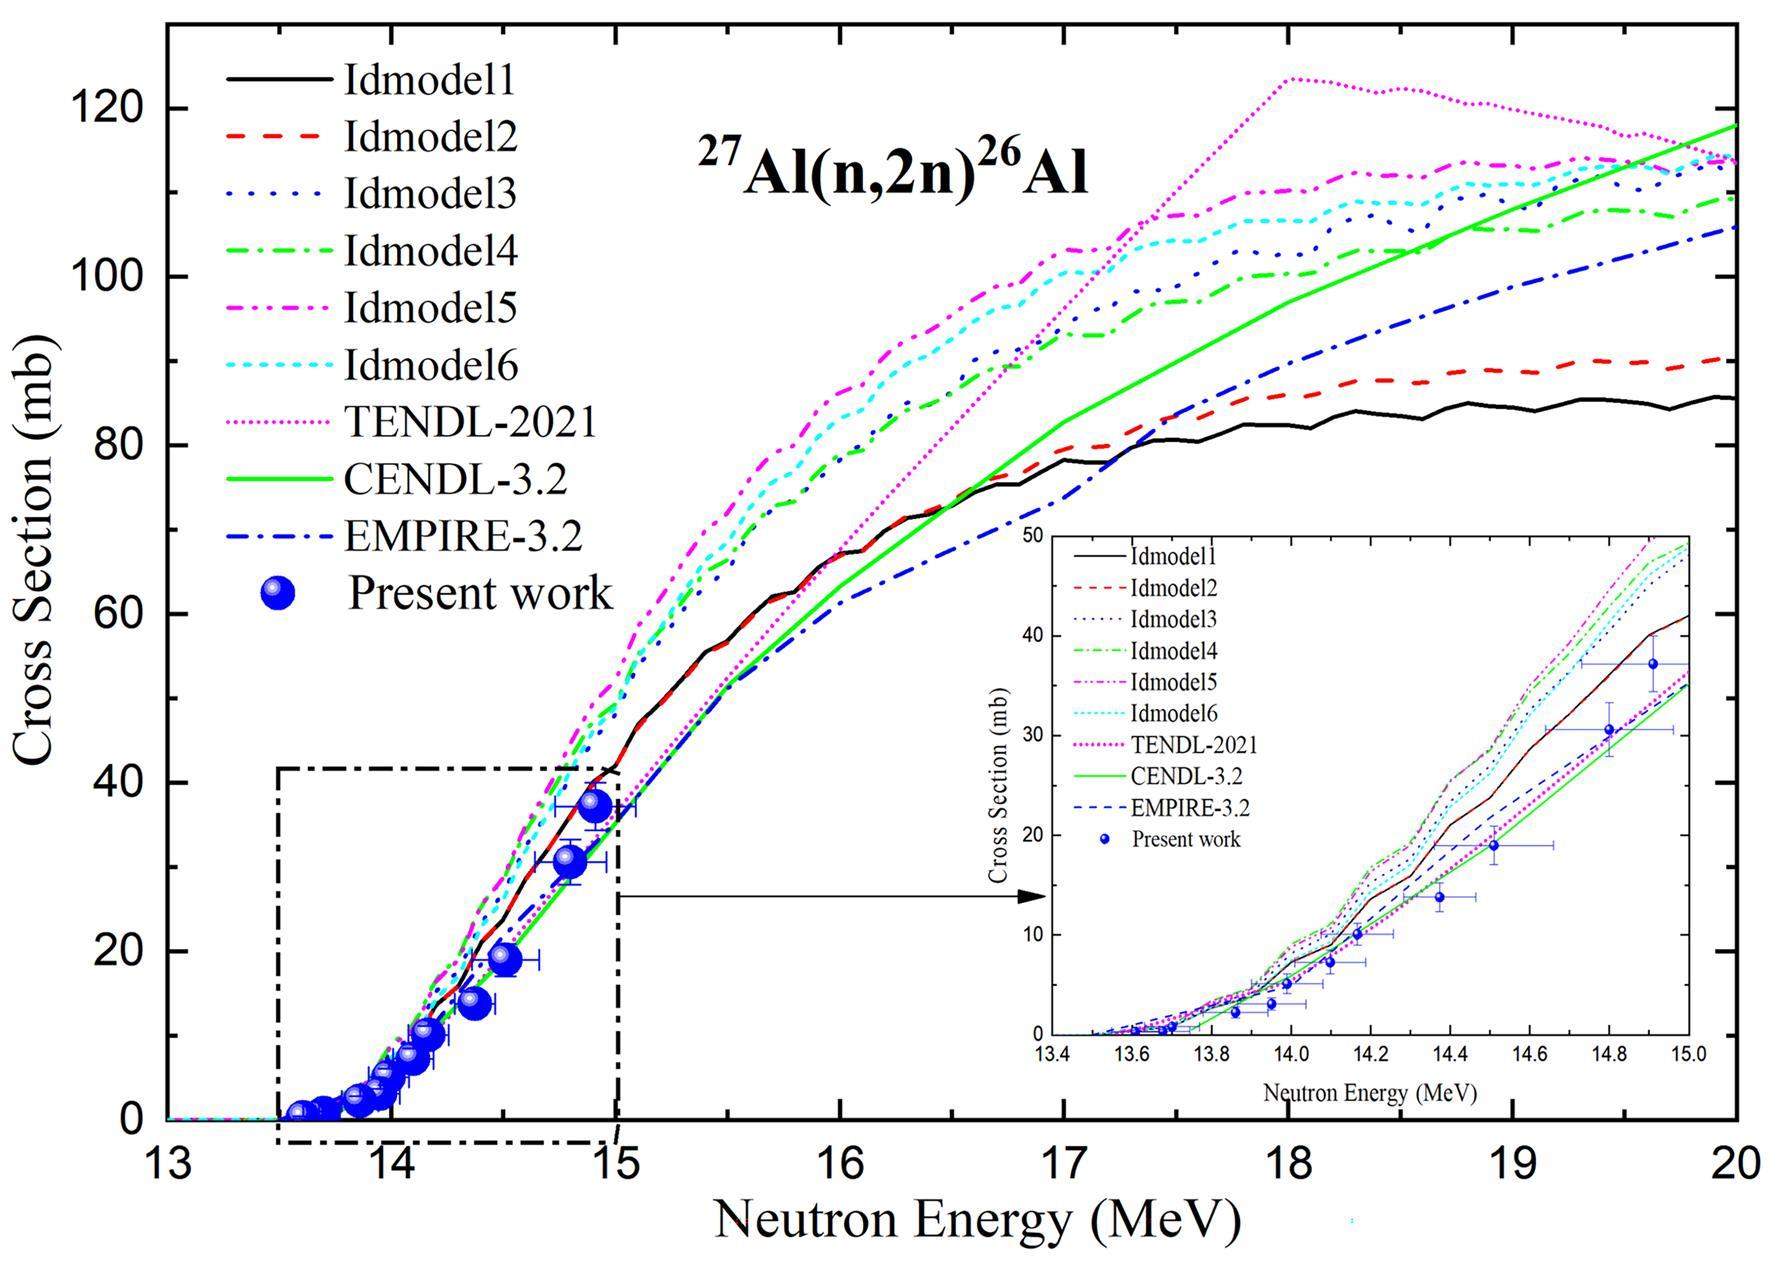
To obtain accurate and trustworthy nuclear data, theory, and experiments must be mutually verified [34-36]. Based on this, theoretical calculations for the 27Al(n,2n)26Al reaction were performed using the statistical nuclear reaction model codes EMPIRE-3.2.3 and TALYS-1.95 [37]. Many studies have focused on introducing these two codes, both at home and abroad [31-36], which will not be repeated in this study. Here, a brief introduction of the basic principles is provided. Computational nuclear reaction mechanisms vary depending on the energy of the incident particle [35]. These algorithms include several nuclear models that use distinct sets of optical model parameters and level densities to determine the contributions of the direct reaction (DI), pre-equilibrium emission (PE), and compound nucleus (CN). To perform theoretical calculations, the best possible input parameters must be used, which are considered to replicate the most satisfactory outcomes compared to the currently obtained data and all previous experimental data [38, 39]. In this study, cross-sections for the 27Al(n,2n)26Al reaction were calculated using the default parameters with an optical model (EMPIRE-3.2.3) and different level density models (TALYS-1.95). The calculated outcomes and evaluated databases are shown in Fig. 4.
Results and discussion
The results of the neutron energy and cross sections of the 27Al(n,2n)26Al reaction in the 14 MeV region are summarized in Table 3 and Fig. 7. In Fig. 7, the cross sections of the 27Al(n,2n)26Al reaction are compared with the available literature data in the EXFOR database. The measurements of 13–15 MeV neutron energies showed discrepancies between the data from different groups. Figure 7 shows a good agreement with the data of Wallner et al.[5] and Filatenkov et al., obtained within the experimental uncertainties. In addition, the experimental results of Zhao et al. [14] are inconsistent with the results of this study. Below the neutron energy of 14.0 MeV, the data of Sasao et al. [12] are consistent with the present data. The data of Iwasaki et al. are two times higher than the present work, between 14.0 MeV and 15.0 MeV. Compared to gamma spectrometry, the AMS technique offers a more competent method for the measurement of cross-sections of reactions with long-half-life product nuclides. Because of the short irradiation time, the statistical uncertainty of 26Al became the primary source of the uncertainty source term in the experiment. If sufficient irradiation time is provided, the statistical uncertainty is greatly reduced. Without considering the AMS statistical uncertainty, the accuracy of this experiment was significantly improved. Therefore, the present results clarify the divergence of the two trends among previous experimental data, and a conclusion can be drawn as follows: the results that have a consistent trend with the present data are more accurate.
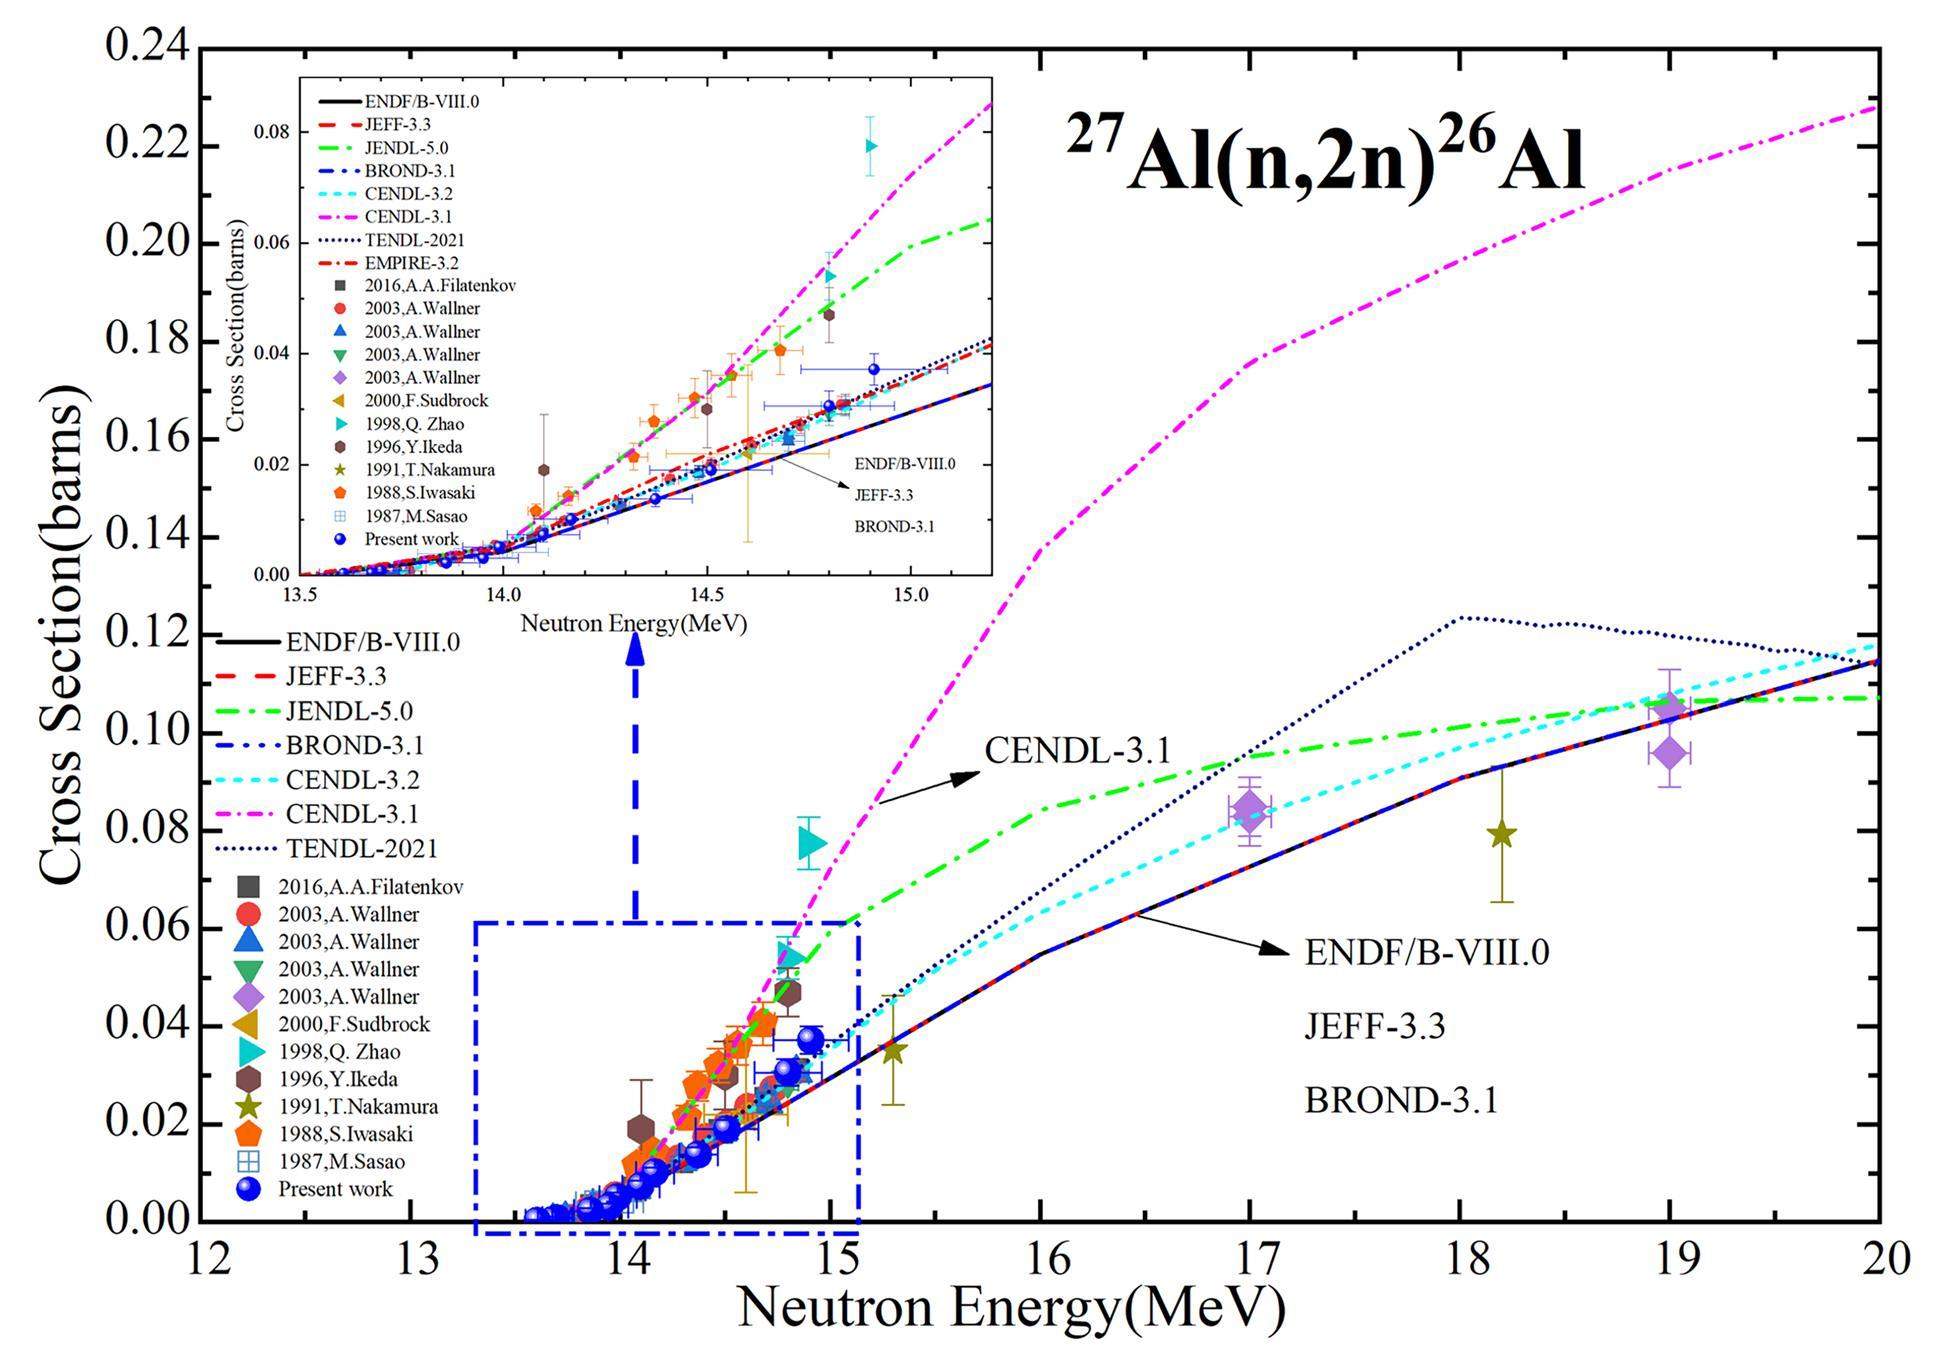
The evaluation values compiled by BROND-3.1, JEFF-3.3, ENDF/B-VIII.0, CENDL-3.2, and JENDL-5.0, are also shown in Fig. 7. The measured 27Al(n,2n)26Al reaction cross section falls within the range of values calculated by different models at 14 MeV neutron energy range. Our values were almost in agreement with those of CENDL-3.2. The near-threshold region above 13.5 MeV is based on different statistical model calculations and thus differs from evaluation to evaluation. The datasets of TENDL-2021 are identical and use the recent nuclear model code TALYS-1.95, where the parameters have been adjusted to reproduce the existing experimental data; however, because there is not enough experimental data to support the evaluated cross-section in the 15-20 MeV neutron energy region, there is still a divergence among the energy-dependent neutron cross-sections from the evaluated cross-section libraries JEFF-3.3, CENDL-3.2, ENDF/B-VIII.0, and JENDL-5.0. Therefore, further experimental studies are required.
In addition, the excitation function of the 27Al(n,2n)26Al reaction was calculated theoretically using TALYS-1.95 code and EMPIRE-3.2.3, with default parameters. In Fig. 8, the shapes of the excitation curves calculated using TALYS-1.95 (ldmodels 1-6) and EMPIRE-3.2.3 exhibit a trend similar to the present data set, which increases with increasing neutron energy around 14 MeV. However, the results calculated using ldmodel 1-6 in TALYS-1.95 significantly overestimated the excitation function. The excitation functions calculated by the level density model ldmodel 1-2 in TALYS-1.95, are in good agreement with the experimental data compared to the level density model ldmodel 3-6. From the threshold to 15.5 MeV, EMPIRE-3.2.3 is consistent with the results reported by TENDL-2021 within the uncertainties. Therefore, more high-precision experimental data are still needed to provide parameters and an experimental basis for theoretical model calculations, especially for energy above 15.5 MeV. The present results contribute to improving the knowledge of cross-sections and optimizing the input parameters of the model, which is essential to support nuclear technology development.
Conclusion
In order to improve the accuracy of 27Al(n,2n)26Al reaction cross section, neutron activation, and accelerator mass spectrometry techniques were combined to determine the 27Al(n,2n)26Al reaction cross section. The experiment was performed using a T(d,n)4He fusion reaction-based neutron generator at CAEP. Ultrasensitive 26Al analysis of the activated samples was performed using a newly installed GYIG 1MV tandem accelerator mass spectrometer. Through systematic measurement and analysis, 12 cross-sections were obtained in the 13-15 MeV neutron energy regions. A detailed analysis was performed to estimate the measured cross-sectional uncertainties. The uncertainties in the measured cross sections were in the range of 7–50%. The newly obtained cross-sections clarify the divergence among the existing experimental data, which have two different growth trends. Compared to the evaluated nuclear data, the present work is in good agreement with TENDL-2021 and CENDL-3.2. In addition, the measured cross sections were reproduced using the theoretical nuclear reaction model code EMPIRE-3.2, below 15 MeV neutron energy. The present experimental results are important for the verification of nuclear reaction codes, assessment of long-lived activity of 26Al, and ion temperature diagnosis of D-T plasma in fusion reactors.
Cross sections for the formation of long-lived radionuclides 10Be,26Al and 36Cl in 14.6 MeV neutron induced reactions determined via accelerator mass spectrometry (AMS)
. Radiochim. acta 88, 829-832 (2000). https://doi.org/10.1524/ract.2000.88.12.829Measurement and simulation of the leakage neutron spectra from Fe spheres bombarded with 14 MeV neutrons
. Nucl. Sci. Tech. 34, 182 (2023). https://doi.org/10.1007/s41365-023-01329-6Measurement of the 27Al(n,2n)26Al reaction cross section for fusion reactor applications
. J. Nucl. Mater. 123, 1071-1077(1984). https://doi.org/10.1016/0022-3115(84)90221-6New method for measuring ion temperatures in hot D-T plasma
. Rev. Sci. Instrum. 56, 1078-1080 (1985). https://doi.org/10.1063/1.1138228Precise measurement of the 27Al(n,2n)26gAl excitation function near threshold and its relevance for fusion-plasma technology
. Eur. Phys. J. A 17, 285-296 (2003). https://doi.org/10.1140/epja/i2002-10152-3Investigation of target materials for low energy accelerator mass spectrometry of 26Al
. Nucl. Instru. Meth. B 515, 14-19 (2022). https://doi.org/10.1016/j.nimb.2022.01.006Determination of cross sections of 60Ni(n,2n)59Ni induced by 14 MeV neutrons with accelerator mass spectrometry
. Nucl. Instru. Meth. B 361, 517-520 (2015). https://doi.org/10.1016/j.nimb.2015.01.060Cross-section measurement for the 93Nb(n,2n)92gNb reaction at the neutron energy of 14.6 MeV by the AMS method 26Al
. Nucl. Instru. Meth. B 42, 074002 (2018). https://doi.org/10.1088/1674-1137/42/7/074002Measurement of the 13C(n, γ) thermal cross section via neutron irradiation and AMS
. Eur. Phys. J. A 55, 1-7 (2019). https://doi.org/10.1140/epja/i2019-12893-0Development and Application of Ultrasensitive Accelerator Mass Spectrometry
. J. Chin. Mass Spectro. Soc. 40, 401-415 (2019). https://doi.org/10.7538/zpxb.2019.0089 (In Chinese)Absolute determination of 79Se/80Se with AMS
. Nucl. Instru. Meth. B 268, 764-768 (2009). https://doi.org/10.1016/j.nimb.2009.10.025The cross-section of 27Al(n,2n)26g,sAl near 14 MeV
. Phys. Rev. C 35, 2327 (1987). https://doi.org/10.1103/PhysRevC.35.2327Measurement of the long-lived 26Al production cross section in the 27Al (n,2n) reaction
. Phys. Rev. C 43, 4 (1991). https://doi.org/10.1103/PhysRevC.43.1831Measurement of the 27Al (n,2n)26Al cross section using accelerator mass spectrometry
. Chin. Phys. Lett. 15, 8(1998). https://doi.org/10.1088/0256-307X/15/1/004ENDF/B-VIII. 0: 8th major release of the nuclear reaction data library with CIELO-project cross sections, new standards, and thermal scattering data
. Nucl. Data Sheets 148, 1-142 (2018). https://doi.org/10.1016/j.nds.2018.02.001Japanese evaluated nuclear data library version 5: JENDL-5
. J. Nucl. Sci.Technol. 60, 1-60 (2023). https://doi.org/10.1080/00223131.2022.2141903CENDL-3.2: The new version of Chinese general purpose evaluated nuclear data library
. EPJ Web of Conferences 239: 09001 (2020). https://doi.org/10.1051/epjconf/202023909001The joint evaluated fission and fusion nuclear data library, JEFF-3.3
. Eur. Phys. J. A 56, 181 (2020). https://doi.org/10.1140/epja/s10050-020-00141-9Improvement of accuracy of Zr/Nb activation-rate ratio method for D-T neutron source energy determination
. J. Nucl. Sci. Technol. 24, 1076-1079 (1987). https://doi.org/10.1080/18811248.1987.9733544A method for determining fast neutron energies in a large sample
. Nucl. Instru. Meth. B 298, 61-65 (2013). https://doi.org/10.1016/j.nimb.2013.01.029Measurement of 54Fe (n,2n)53Fe reaction cross-sections at 14 MeV neutron energies using activation method and its relevance for fusion-plasma temperature diagnosis
. Nucl. Instrum. Meth. B 525, 18-24 (2022). https://doi.org/10.1016/j.nimb.2022.06.003An improved theoretical method for determining the mean D-T neutron energies in large solid angle sample
. J. Nucl. Sci. Technol. 60, 251-257 (2023). https://doi.org/10.1080/00223131.2022.2093799determined the cross sections for the 238U (n,3n)236U reaction induced by 14-MeV neutrons using accelerator mass spectrometry
. Phys. Rev. C 87, 14612 (2013). https://doi.org/10.1103/PhysRevC.87.014612Spline techniques for fitting efficiency curves in gamma-ray spectrometry
. Nucl. Instrum. Meth. A 286, 398 (1990). https://doi.org/10.1016/0168-9002(90)90886-BA new national 1 MV AMS laboratory at TÜBİTAK MRC in Turkey
. Nucl. Instrum. Meth. B 509, 48-54 (2021). https://doi.org/10.1016/j.nimb.2021.08.013Applications of accelerator mass spectrometry
. Int. J. Mass Spectro. 349-350, 203-218 (2013). https://doi.org/10.1016/j.ijms.2013.05.023The activation method for cross section measurements in nuclear astrophysics
. Eur. Phys. J. A 55, 41 (2019). https://doi.org/10.1140/epja/i2019-12708-4A New capability for 41Ca analysis using CaF3− at the Xi’an-AMS
. Nucl. Instru. Meth. B 438, 162-165 (2018). https://doi.org/10.1016/j.nimb.2018.05.009Preliminary progress report on 10Be and 26Al sample preparation at the IHEG and CAGS AMS laboratories
. Nucl. Instrum. Meth. B 535, 38-42 (2023). https://doi.org/10.1016/j.nimb.2022.11.020New results on Xi’an-AMS and sample preparation systems at Xi’an-AMS center
. Nucl. Instr. Meth. B 262,135(2007). https://doi.org/10.1016/j.nimb.2007.04.221Determination of neutron capture cross sections of 232Th at 14.1 MeV and 14.8 MeV using the neutron activation method
. Chin. Phys. C 41, 044002 (2017). https://doi.org/10.1088/1674-1137/41/4/044002Cross section measurements of (n, α) (n, n’α) and (n, p) reactions for 65Cu at 14 MeV neutrons
. Radiat. Phys. Chem. 197, 110192 (2022). https://doi.org/10.1016/j.radphyschem.2022.110192Activation cross sections for 13.6 MeV neutron induced reactions on natural tin
. Appl. Radiat. Isotopes 184, 110209 (2022). https://doi.org/10.1016/j.apradiso.2022.110209Measurement of the half-life of 95mTc and the 96Tc(n, x)95mTc reaction cross-section induced by D–T neutron with covariance analysis
. Eur. Phys. J. A 58, 222 (2022). https://doi.org/10.1140/epja/s10050-022-00879-4Measurement of 134Xe(n,2n)133m,gXe reaction cross-sections in 14-MeV region with detailed uncertainty quantification
. Nucl. Sci. Tech. 34, 4 (2023). https://doi.org/10.1007/s41365-022-01158-zLocal and global nucleon optical models from 1 keV to 200 MeV
. Nucl. Phys. 713,231(2003). https://doi.org/10.1016/S0375-9474(02)01321-0RIPL–reference input parameter library for calculation of nuclear reactions and nuclear data evaluations
. Nucl. Data Sheets 110, 3107-3214(2009). https://doi.org/10.1016/j.nds.2009.10.004Systematic study of (n,p) reaction cross sections from the reaction threshold to 20 MeV
. Phys. Rev. C 85, 024624 (2012).https://doi.org/10.1103/PhysRevC.85.024624The authors declare that they have no competing interests.

