Introduction
Collective effects limit the highest beam current (both single and multiple bunches) in circular accelerators and essentially limit the facility’s performance. Among the numerous types of collective effects, transverse mode-coupling instability (TMCI), a type of transverse single-bunch instability, is particularly dangerous and can lead to severe particle losses. Therefore, studies on TMCI to understand the mechanism, compute the threshold, and mitigate the instability have been conducted analytically, via simulations, and experimentally on several machines.
TMCI was first observed in PETRA and was studied by Kohaupt in 1980 [1]. The well-known “two-particle model” was proposed by Kohaupt [1] and was described in detail in [2]. The highly simplified “two-particle model” provides a clear physical picture of TMCI, using two macroparticles with opposite synchrotron oscillation phases to represent a single bunch. After obtaining the total transformation for a full synchrotron oscillation period, the stability of the two-particle system can be analyzed by computing the eigenvalues of the transfer matrix.
Additionally, a method was proposed in [3-5] to analyze the so-called strong coherent beam–beam instability in the head–tail σ mode. By applying this method, the stability of each colliding bunch can be analyzed by computing the eigenvalues of the one-turn transfer matrix MWM0, where the matrix M0 is the transfer matrix of one revolution representing the synchro-betatron motion, and MW denotes the momentum kick generated by the beam-beam cross-wake force. Subsequently, the method was extended to include the effects of longitudinal impedance in a study on the beam–beam effect [6].
The aforementioned methods essentially analyze bunch stability in the time domain. Moreover, the stability analyses of TMCI can also be performed in the frequency domain. The complex frequencies of the transverse coherent modes can be obtained by solving the Vlasov equation. By performing mode analyses in the frequency domain, the mechanism of TMCI can be explained by the coupling of the different transverse coherent modes driven by a transverse short-range wakefield (i.e., transverse broadband impedance). When TMCI occurs, the analysis predicts violent bunch oscillation, leading to a significant particle loss during particle tracking.
Multiparticle tracking is another powerful method for studying TMCI. Several tracking codes, such as elegant [7] and its parallel version Pelegant [8], PyHEADTAIL [9], mbtrack [10] and its GPU-accelerated version mbtrack-cuda [11], have been developed and widely used in studies on collective instabilities, including TMCI. Compared to the aforementioned analytical methods, multiparticle tracking is more flexible and handle more complicated situations. However, because multiparticle tracking simulates the particle motion in a beamline, many macroparticles are required to guarantee that the interaction among the particles, as well as that between the beam and environment, assimilates the real case. Furthermore, many turns are required in tracking simulations to confirm the stability of the beam.
The transverse impedance is the fundamental cause of TMCI. In previous studies, only transverse impedance was included in the study of TMCI. For example, in the classic “two-particle model” and many Vlasov solvers (such as MOSES [12], NHTVS [13], DELPHI [14], and GALACTIC [15]), linear longitudinal motion was assumed. The synchrotron oscillation frequencies were assumed to be constant within the bunch. However, this assumption is not fully self-consistent because it omits the effects of the nonlinear longitudinal motion. Nonlinear longitudinal motion can be driven by the longitudinal impedance or nonlinear RF potential, e.g., harmonic cavities [16], which are widely used in the 4th generation synchrotron light sources [17, 18]. These factors were not considered in previous models. Harmonic cavities can lengthen the bunch and induce synchrotron-tune spread, improving beam lifetime [19-21]. In recent years, some studies have attempted to include harmonic-cavity-induced nonlinear longitudinal motion [22, 16]. However, systematic studies of the influence of longitudinal impedance on TMCI are lacking.
In recent studies on the FCC-ee [23], tracking simulations observed a lower TMCI threshold when longitudinal and transverse impedances were simultaneously included. Here, we studied TMCI with and without considering longitudinal impedance using the Circular Electron Positron Collider (CEPC) storage ring lattice [24] in “Z-mode", which has the lowest beam energy (and therefore the weakest synchrotron radiation damping effect) among all the proposed operational modes of the CEPC collider ring. The primary lattice parameters used in these studies are listed in Table 1.
| Parameters | Values |
|---|---|
| Circumference (km) | 99.635 |
| Energy, E0 (GeV) | 45.5 |
| Natural emittance (nm) | 0.27 |
| Betatron tune, νx/νy | 317.10/317.22 |
| Damping partition numbers, Jx/Jy/JE | 1.0/1.0/2.0 |
| Radiation damping time, τx/τy/ |
0.81/0.81/0.40 |
| Radiation loss per turn, (MeV) | 37.36 |
| Equilibrium energy spread (%) | 0.038 |
| Momentum compaction factor, ηp | 1.43e-5 |
| Main RF frequency, fRF (MHz) | 652.391 |
| Harmonic number of main RF | 216,820 |
| Bucket height, δmax (%) | 1.7 |
| Peak RF voltage, VRF (MV) | 116.66 |
| RMS Bunch length at “zero current" (mm) | 2.53 |
| Beam pipe radius (mm) | 28 |
The remainder of this paper is organized as follows. In Sect. 2, the study of TMCI in the CEPC collider ring in “Z-Mode” is presented. Tracking simulations are performed under the conditions with and without the inclusion of the longitudinal impedance. In Sect. 3, the theory of TMCI is briefly reviewed, and the possible influences of the longitudinal impedance on the TMCI threshold are discussed. Systematic analyses of the influence of the longitudinal impedance are presented in Sect. 4 based on both analytical analyses and tracking results. Conclusions and a discussion are presented in Sect. 5.
Simulations of TMCI in the CEPC collider ring in “Z-Mode”
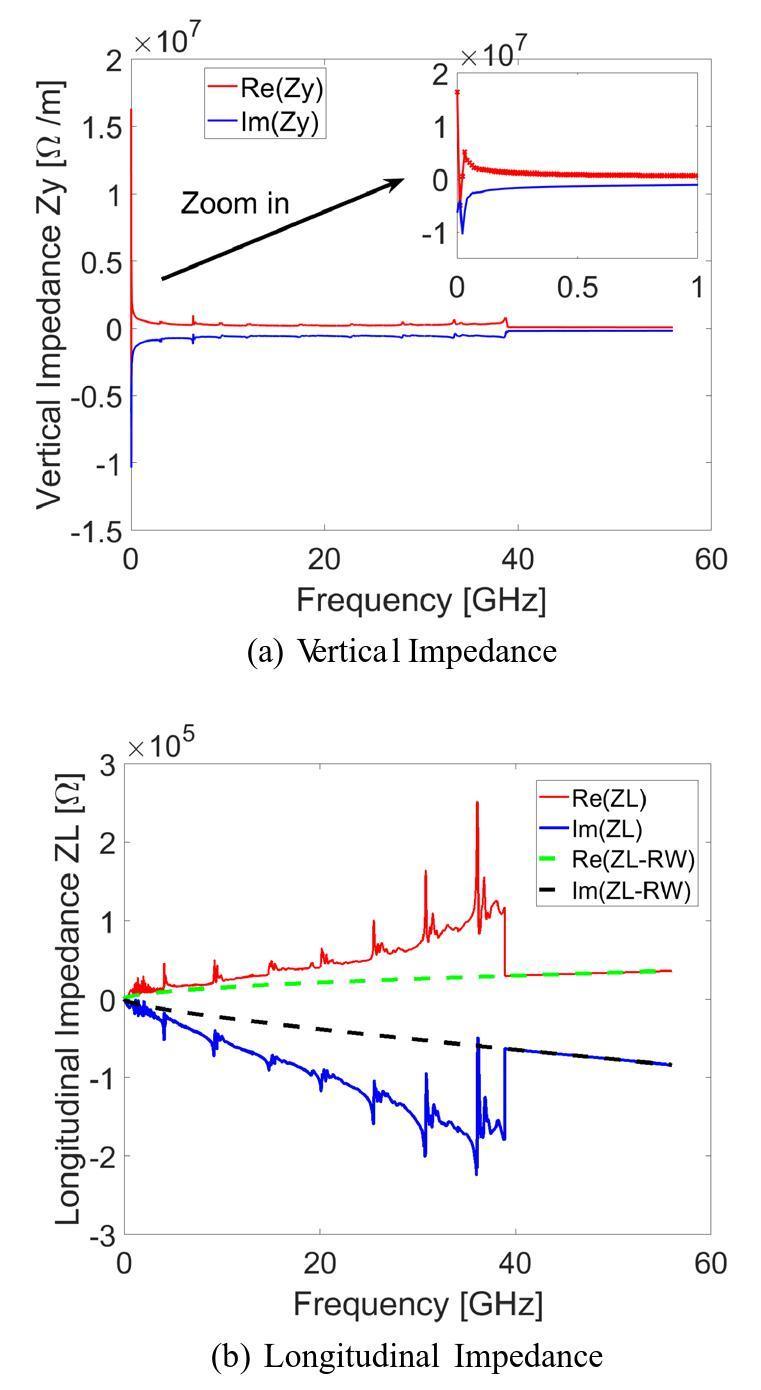
Before studying TMCI in the CEPC collider ring, obtaining a reasonable impedance model of the entire ring was necessary. During the CEPC technical design process, an impedance model [25] was gradually established owing to the development of vacuum components. Analytical formulae [26] were mainly used to compute the resistive-wall (RW) impedance, and simulations were performed for the detailed computations of the geometric impedance of complicated vacuum components. The impedance of the CEPC collider ring in the vertical direction is illustrated in Fig. 1 (a), where the red and blue curves represent the real and imaginary parts of vertical impedance, respectively. To show the transverse impedance data in a relatively low-frequency range, we zoomed in on the frequency range from 0 to 1 GHz in the same figure. At present, only the transverse dipolar impedance is considered. The quadrupolar impedance has been ignored until now. The longitudinal impedances are shown in Fig. 1 (b), where the solid and dashed curves indicate the total longitudinal impedance and the longitudinal RW impedance, respectively. Limited by computing resources, the maximum frequencies of both the vertical and longitudinal geometric impedance of the vacuum components were set to approximately 40 GHz. However, the RW impedance was cut off at a higher frequency (approximately 56 GHz). In principle, RW impedance data can reach higher frequencies. However, truncating the RW impedance at higher frequencies does not provide a new physical picture. The limitation of the impedance model accuracy of the CEPC collider ring was the geometric impedance at that moment. More detailed computation of geometric impedance is an important ongoing task.
In addition to impedance information, RF parameters are necessary to study TMCI. As listed in Table 1, the RF frequency was selected as 652.391 MHz. The planned bucket height was 1.7%. The corresponding peak RF voltage and synchrotron tune were approximately 116.66 MV and
Systematic multiparticle simulations were performed using the elegant [7] code (and its parallel version Pelegant [8]) to study TMCI of the CEPC collider ring. To guarantee convergence of the simulations, 1,000,000 macroparticles were used to represent a single bunch, making the simulations very time-consuming. The total number of turns in the tracking simulation was chosen as 50,000 turns, corresponding to approximately 20 times the transverse radiation damping time. To speed up the simulations, tracking through the individual components of one revolution of the ring was simplified to using a “one-turn map". The impedance of the entire ring was treated as a lumped component. To eliminate interference in TMCI threshold charge, neither synchrotron radiation damping, nor quantum excitation were included in the simulations presented in this section.
Simulations were performed under three different conditions to study the influence of longitudinal impedance on the threshold of TMCI. The first condition includes the vertical impedance (as shown in Fig. 1 (a)) without considering the longitudinal impedance, which is a widely used assumption in many previous TMCI analyses. The synchrotron motion was determined under this condition using the main RF parameters listed in Table 1, which can be assumed linear at small amplitudes. The second condition considers the total longitudinal impedance of the CEPC collider ring, as indicated by the solid curves in Fig. 1 (b), along with the vertical impedance. The third condition includes the longitudinal RW impedance (indicated by the dashed curves in Fig. 1 (b)) instead of the total longitudinal impedance. The original purpose of studying this situation was to supplement the first and second conditions, because the longitudinal effective impedance of the third condition was between the first and second conditions. The tracking results corresponding to the three scenarios are shown in Fig. 2 for left, middle, and right columns, respectively.
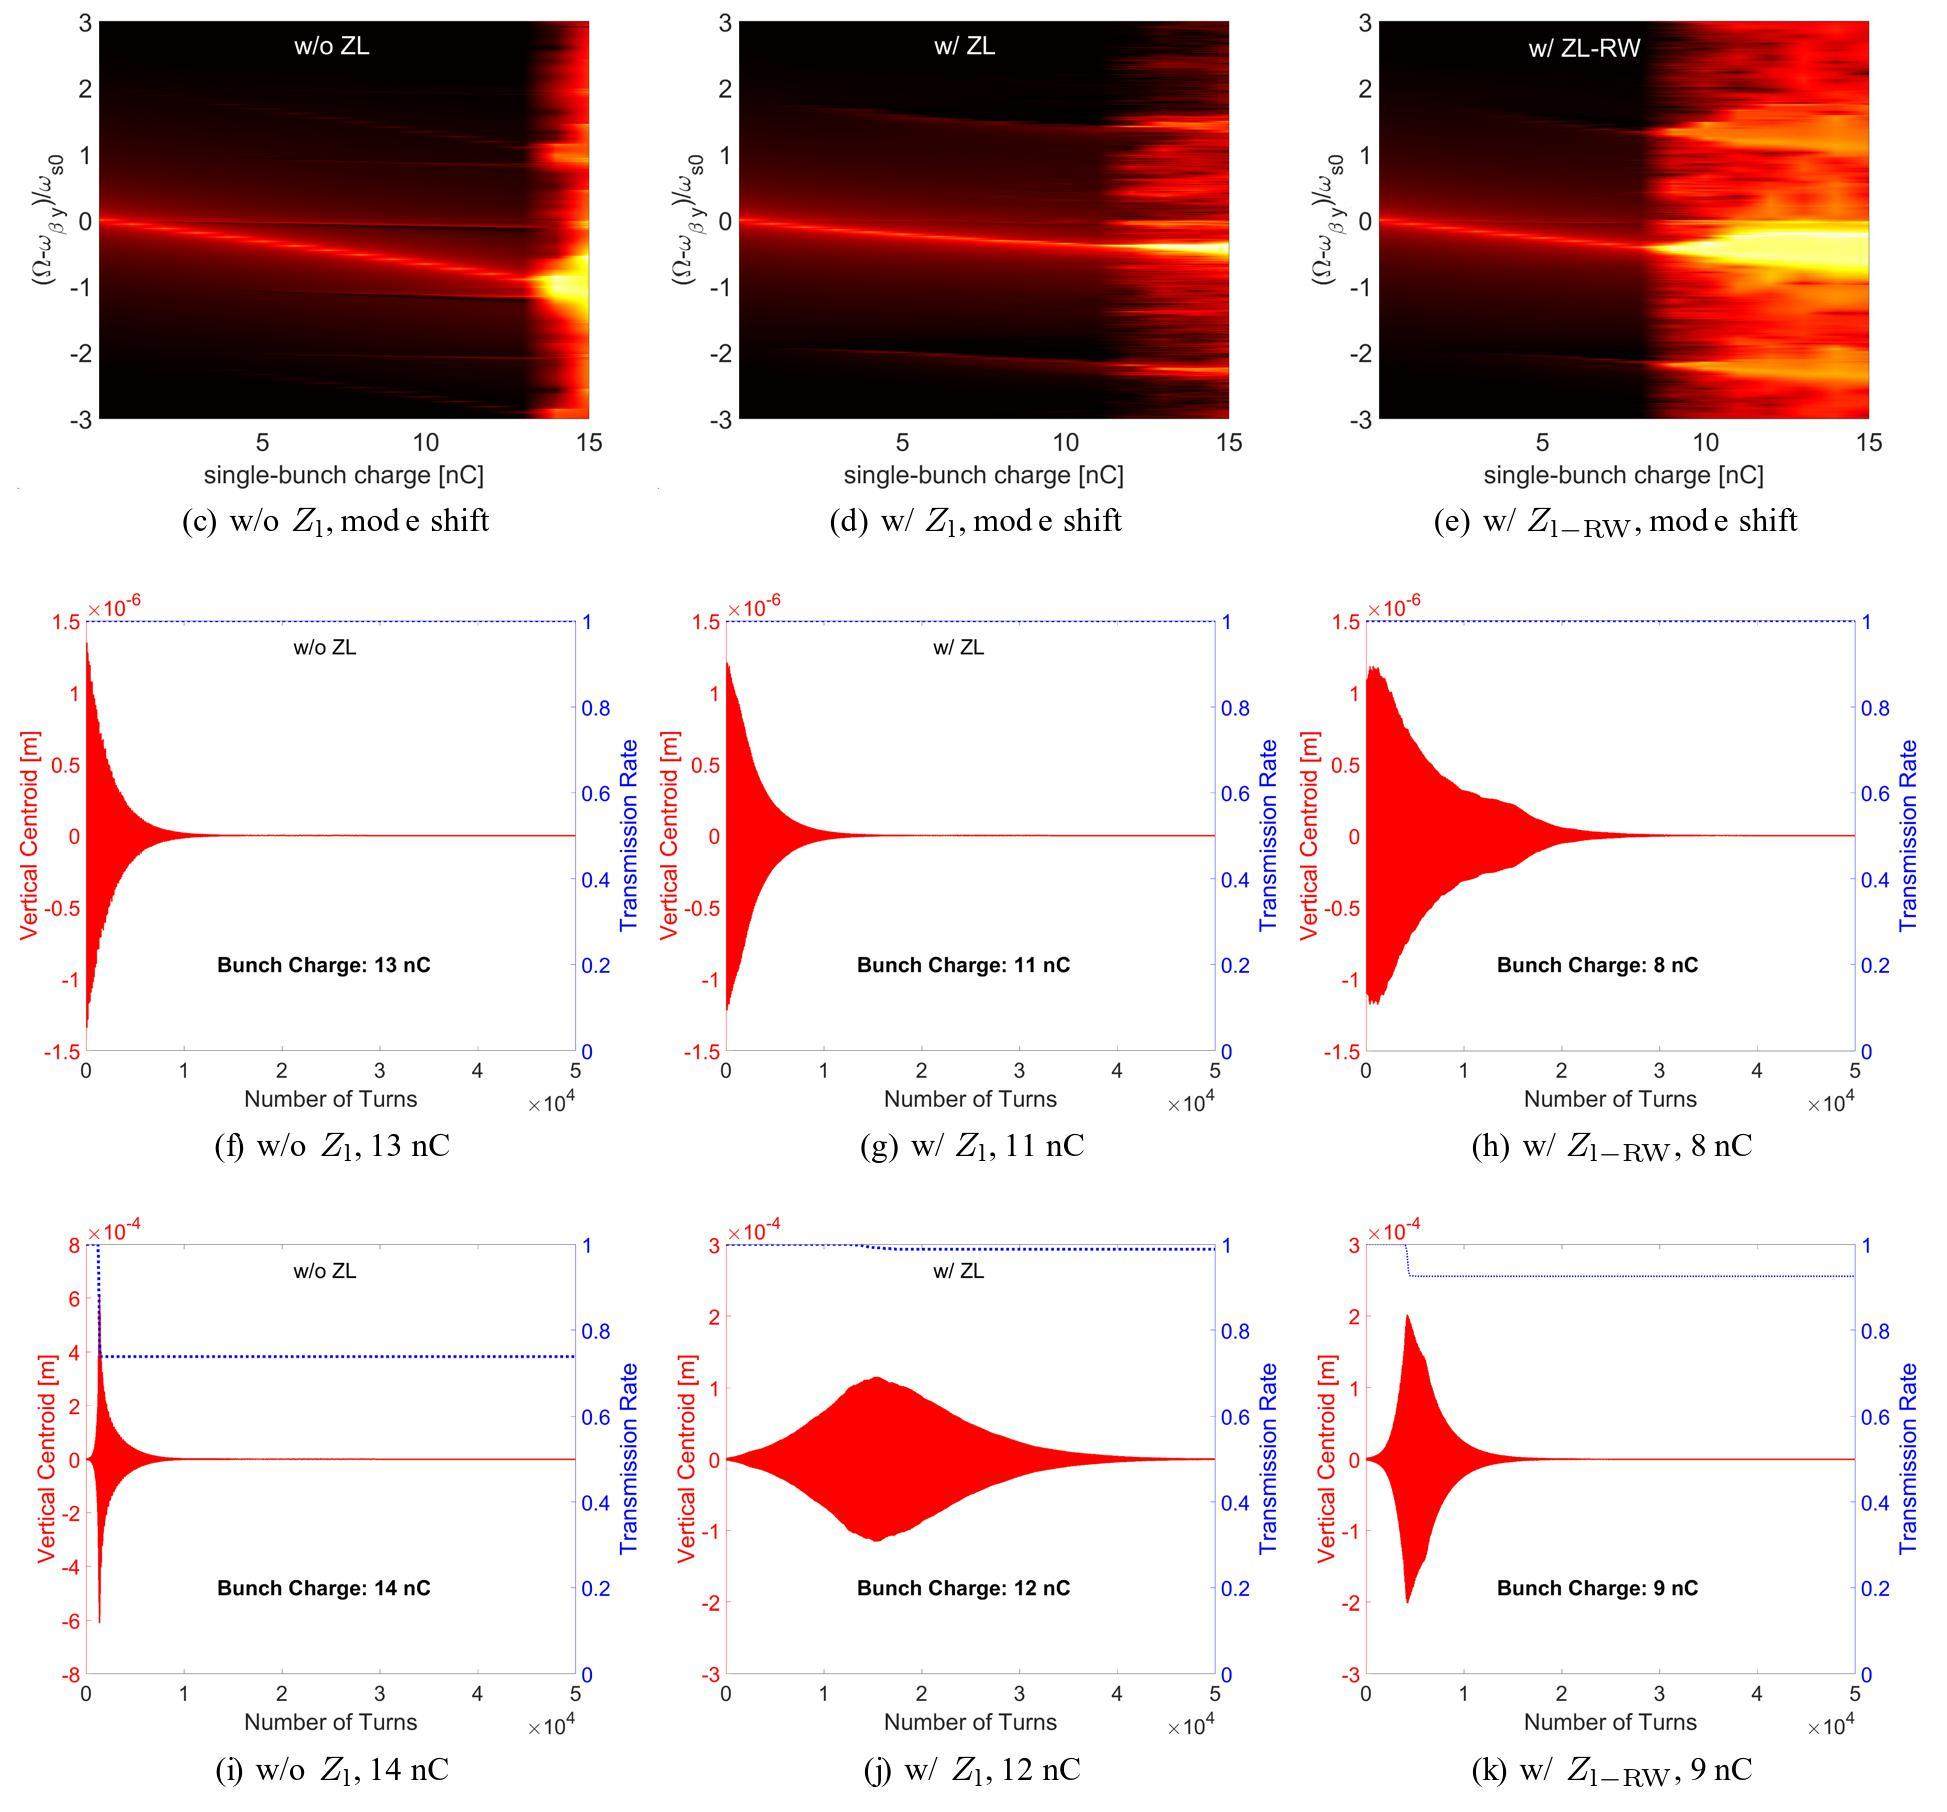
Figure 2 (a), (b), and (c) show the frequency shifts of the transverse coherent modes under the three aforementioned conditions. The plots in the two lower rows show the vertical centroid oscillations (in red) and transmission rates (in blue, indicating the ratio of survival to total macroparticles) of single bunches with different charges, which could be used to indicate the TMCI threshold. Taking Fig. 2 (d) as an example, where the single-bunch charge was set to 13 nC, no growth of the bunch centroid was observed, and the transmission rate remained at 100% in the tracking. Therefore, Fig. 2 (d) indicates that 13 nC/bunch is below the TMCI threshold. However, in Fig. 2 (g), one could see the growth of the bunch centroid, which is a clear sign of TMCI. Furthermore, remarkable particle loss was observed. Therefore, Fig. 2 (g) indicates that 14 nC/bunch is above the TMCI threshold. The TMCI threshold charge was between 13 and 14 nC/bunch under the first condition. Similarly, we can obtain the TMCI threshold charges corresponding to the second and third conditions in the ranges of 11 nC/bunch to 12 nC/bunch and 8 nC/bunch to 9 nC/bunch, respectively.
This can be observed by comparing the plots in the left column with the plots in the middle column (or the plots in the right column) in Fig. 2. The threshold charge of TMCI in the CEPC collider ring was higher when longitudinal impedance was not considered. Reduction in TMCI threshold current when considering longitudinal impedance in CEPC collider ring was similar to the phenomenon reported for the FCC-ee [23]. Because the only difference was the inclusion of longitudinal impedance in the simulations, it was straightforward to guess that the effects of longitudinal impedance, such as potential well distortion, longitudinal motion characteristics, and microwave instability, must be carefully checked.
Another interesting phenomenon can be observed in Fig. 2. The TMCI threshold current was even lower with only the longitudinal RW impedance (between 8 nC and 9 nC) compared with the result obtained using the total longitudinal impedance (between 11 nC and 12 nC). However, the longitudinal RW impedance was significantly weaker than the total longitudinal impedance for the CEPC collider ring.
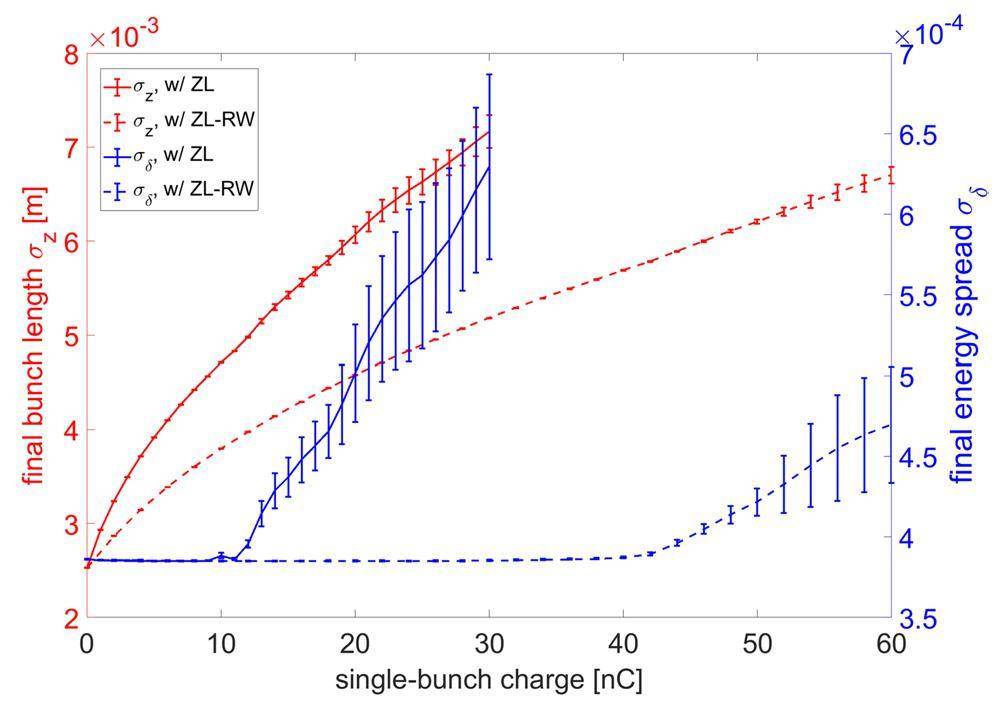
To better understand the physical reasons for the phenomena, we believe that it is important to examine the longitudinal dynamics of the bunch in detail. Therefore, we performed multiparticle tracking simulations using only the longitudinal impedance. Again, we used 1,000,000 macroparticles in a single bunch for tracking. The total number of turns in the tracking simulation was 50,000, which corresponds to approximately 40 damping cycles in the longitudinal direction. The obtained “final” (the word “final” indicated that the equilibrium state was reached) bunch length and energy spread, corresponding to different single-bunch charges, are shown in Fig. 3. As an increase in the energy spread can indicate microwave instability, we can observe that the threshold charges were approximately 10 nC per bunch and 40 nC/bunch, respectively, when the total longitudinal impedance and longitudinal RW impedance were considered. Interestingly, the microwave instability (MWI) threshold was lower than the TMCI threshold when using the total longitudinal impedance in the tracking simulations. However, when using longitudinal RW impedance in the simulations, the obtained TMCI threshold was lower than the MWI threshold. This difference allowed us to check whether MWI affects transverse stability. Furthermore, this phenomenon is means that it would be more suitable to use the longitudinal RW impedance in analytic analyses of TMCI. Otherwise, the unstable longitudinal motion is difficult to treat analytically.
TMCI theory
The basic methods to determine the TMCI threshold using the “two-particle model” and by solving the Vlasov equation are briefly discussed in the Introduction section. In this section, we review the two methods in more detail.
The ingeniousness of the “two-particle model” is to divide one full synchrotron period into two halves to ensure that the “leading particle" and the “trailing particle" will not exchange positions in each half of the synchrotron period. Therefore, in the first half of the synchrotron period, the equation for the betatron motion of the leading particle (marked as No. 1) describes the free betatron oscillations. Meanwhile, the transverse kick generated by the wakefield of the leading particle is included in the equation for the betatron motion of the trailing particle (marked as No. 2). In the second half of the synchrotron period, the positions of these two particles exchange, indicating that particle No. 2 becomes the leading particle. Therefore, the equations of the betatron motion can be written similarly as in the first half-synchrotron periods. After obtaining the total transformation for the full synchrotron oscillation period, the stability of the two-particle system can be analyzed by computing the eigenvalues of the transfer matrix. The stability criterion obtained from the “two-particle model” is expressed as follows [2]
It can be seen from Eq. (1) that the TMCI threshold predicted by the “two-particle model” is proportional to the betatron frequency, synchrotron frequency, and beam energy and the circumference of the ring and is inversely proportional to the strength of the transverse wakefield. The TMCI study of the CEPC collider ring determined the betatron frequency, beam energy, circumference, and transverse wakefields, implying that more attention should be paid to the synchrotron frequency.
Analyzing the TMCI threshold by solving the Vlasov equation essentially computes the complex frequencies of the transverse coherent modes. The starting point is the bunch distribution ϕ in 4-D phase space (either in the polar coordinate space
Using the “air-bag model" to represent the longitudinal bunch distribution
Analyses with longitudinal impedance
Development of the analytic method
As mentioned above, a method to analyze the stability of colliding bunches is to compute the eigenvalues of the matrix product of the synchro-betatron transfer matrix M0 and the matrix MW, which represents the momentum kick induced by the beam–beam cross-wake force. This method was developed in [3, 4]. The method was then extended to include the longitudinal impedance in a study on the beam–beam effect [6]. In the following text, we mainly follow the procedure proposed in [6] to develop an analytical method for analyzing TMCI considering longitudinal impedance.
TMCI in the horizontal and vertical directions is usually studied separately. In the following section, the vertical direction is considered as an example. Vertically normalized coordinates (Y,Py) instead of the vertical phase–space coordinates (y,py) were used in the following computations. The normalized coordinates (Y,Py) can be expressed as
The vertical coordinates of the particles (Y,Py) are functions of the longitudinal phase-space coordinates. To proceed with our analysis, we use the longitudinal action-angle variables
Furthermore, one must consider that the transverse wakefield generated by the leading particles acts on trailing particles as they move along the accelerator. As mentioned previously, the vertical impedance of the entire ring was lumped into one location, providing a vertical momentum kick to the particles at each revolution. This vertical momentum kick can be expressed as [2]
After synchro-betatron transformation of Eq. (11) and the momentum kick of Eq. (14) induced by wakefield, we attempt to determine the stability of the circulating bunches. The objective was to obtain the eigenvalues of the transformations. To achieve this, we first truncated the infinite summation l of Eq. (9) at
Finally, the total one-turn transfer matrix is
To perform the analysis of TMCI using the aforementioned method, according to Eq. (17) and Eq. (18), the synchrotron tune νs(J) and particle longitudinal phase–space distribution
We can then substitute the equilibrium longitudinal bunch distribution
The same process can be applied to the study without considering longitudinal impedance except for solving the Haïssinski equation.
Study of the TMCI both analytically and by simulations
Using the analytical method, the TMCI can be studied with and without consideration of the longitudinal impedance. To benchmark the analytical method, a TMCI study was conducted under conditions without a longitudinal impedance. The mode angular frequency Ω and the growth rate are given by
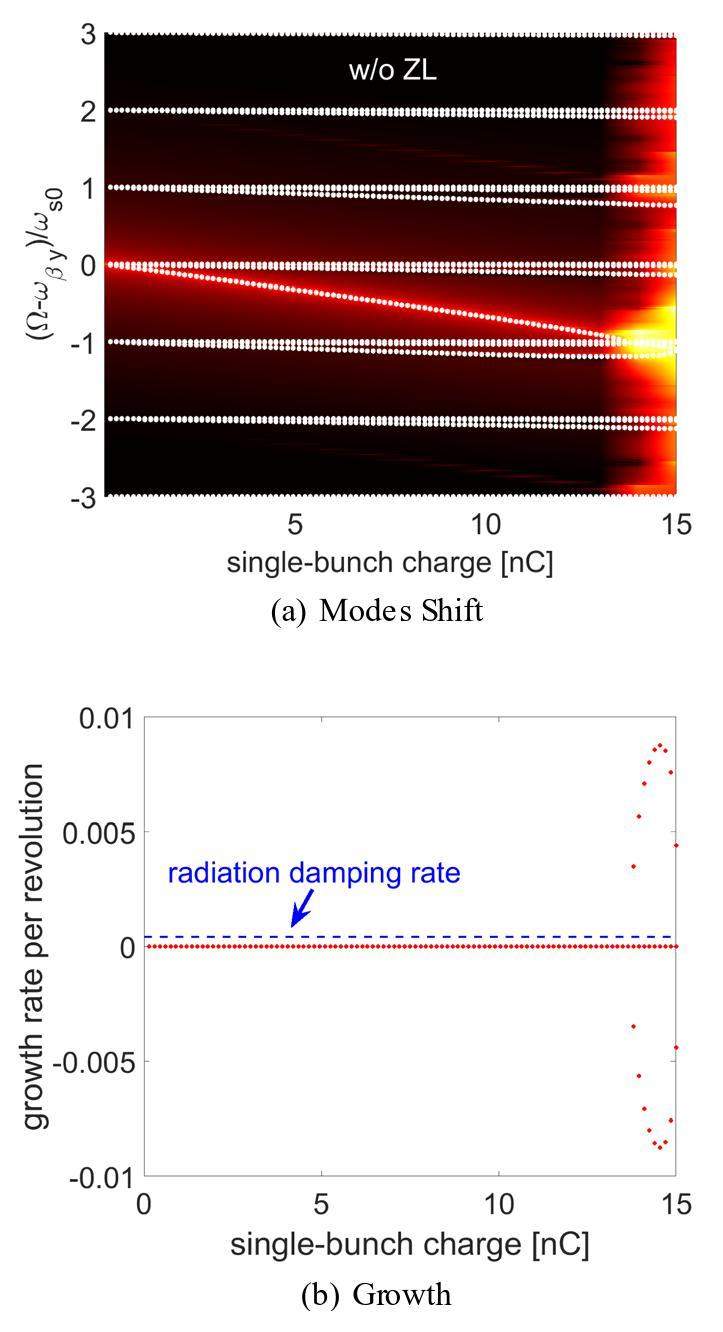
Furthermore, the growth rates of TMCI are indicated by the red dots in Fig. 4 (b). We observed that the growth rate remained at zero when the single-bunch charge was below approximately 13 nC and became nonzero when the single-bunch charge was above 14 nC. This is consistent with the mode-coupling analyses presented in Fig. 4 (a). Furthermore, the blue dashed lines in Fig. 4 (b) indicates the synchrotron radiation damping. The growth rate was compared to that of the synchrotron radiation damping rate, we determined whether the bunch was stable.
In Fig. 4 (a), excellent agreement between the analytical analysis and multiparticle tracking simulations without considering the longitudinal impedance is shown. In the next step, we do not assume linear synchrotron motion in the longitudinal direction. Instead, the longitudinal impedance was included in the TMCI study. The longitudinal equilibrium distribution was obtained by considering the longitudinal impedance.
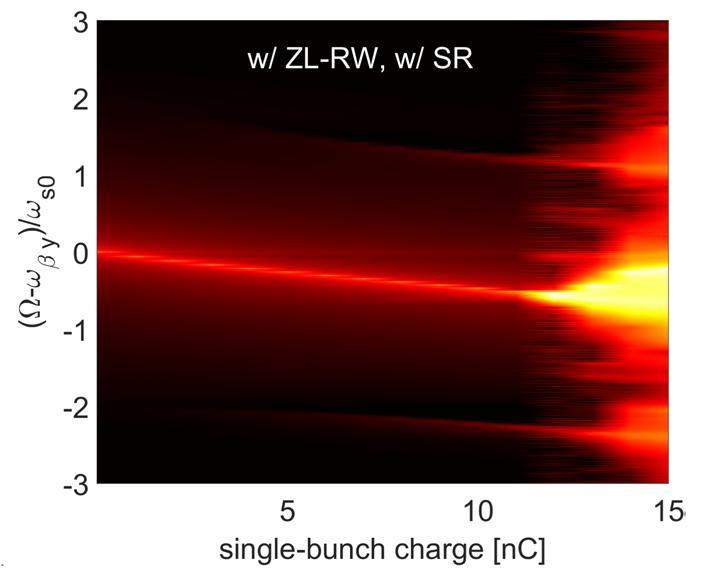
However, as presented in Sect. 2 or, more precisely, in Fig. 2 (b) and Fig. 3, when the longitudinal impedance of CEPC (the red and blue curves in Fig. 1 (b)), the MWI threshold charge was lower than the TMCI threshold. Since no equilibrium Haïssinski solution exists above the MWI threshold, the corresponding longitudinal bunch distribution change turn after turn, making the analytic analysis of TMCI impossible. Figure 2 (c) and Fig. 3 show that MWI threshold charge is much higher than the TMCI threshold charge when using the longitudinal RW impedance (green and black dashed curves in Fig. 1 (b)), indicating that the equilibrium longitudinal distribution always exists when studying TMCI considering longitudinal RW impedance. Therefore, we use the longitudinal RW impedance (green and black dashed curves in Fig. 1 (b)) in the TMCI studies. The computational results are presented in Fig. 5.
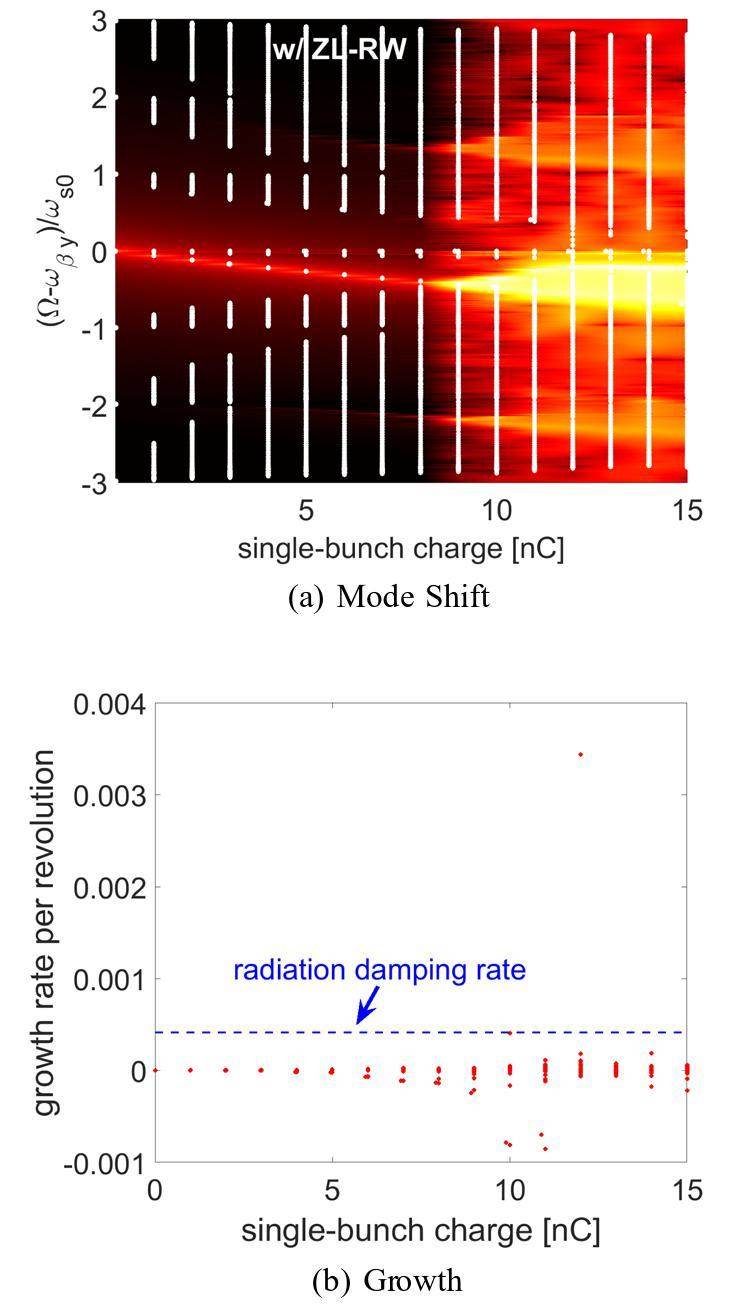
Figure 5 (a) shows excellent agreement between the analytical and tracking results when the longitudinal RW impedance is included. Furthermore, the threshold charge predicted by the tracking simulations corresponds to the position where l=0 and l=-1 modes are coupled, as predicted by the analytical analyses. It is interesting to note the following analytical results predicted that the spread of each azimuthal mode (corresponding to the indices of the vertical axis
Influences of the real and imaginary parts of the longitudinal impedance
The studies showed that longitudinal impedance leads to a reduction in the TMCI threshold. Furthermore, it was confirmed that both the developed analytical method and multiparticle tracking can be used to investigate this phenomenon. In this study, we conducted systematic investigations into the underlying physics.
The first question we aimed to understand is how the real and imaginary parts of the longitudinal impedance affect the TMCI. It would be of great significance to know the answer because this may guide more precise optimization of the longitudinal impedance.
The studies were first conducted using multiparticle tracking by including either the real part of the total longitudinal impedance (red solid curve in Fig. 1 (b)) or the imaginary part of the total longitudinal impedance (solid blue curve in Fig. 1 (b)). The total number of turns in the tracking process is 50,000. Synchrotron radiation effects were not considered in this study. The mode frequency shifts corresponding to these two conditions are shown in Fig. 7.
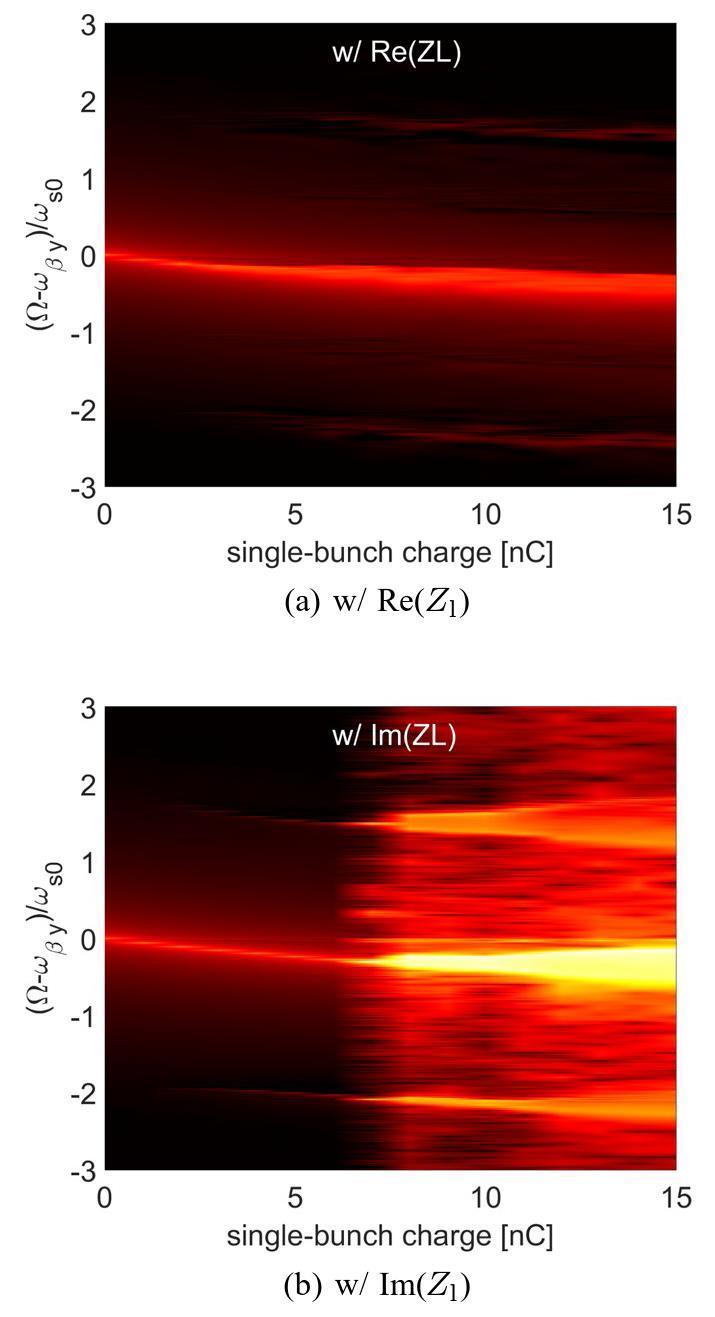
Compared with the results obtained for the entire longitudinal impedance (shown in Fig. 2 (b)), the TMCI threshold charge increases when only the real part of the longitudinal impedance is included. However, the TMCI threshold decreased significantly when only the imaginary part of the longitudinal impedance was included in tracking. We first performed tracking simulations in the longitudinal direction to determine the reason. The same settings were used as those described above. The obtained “final” bunch lengths and energy spreads are shown in Fig. 8 (a) and (b).
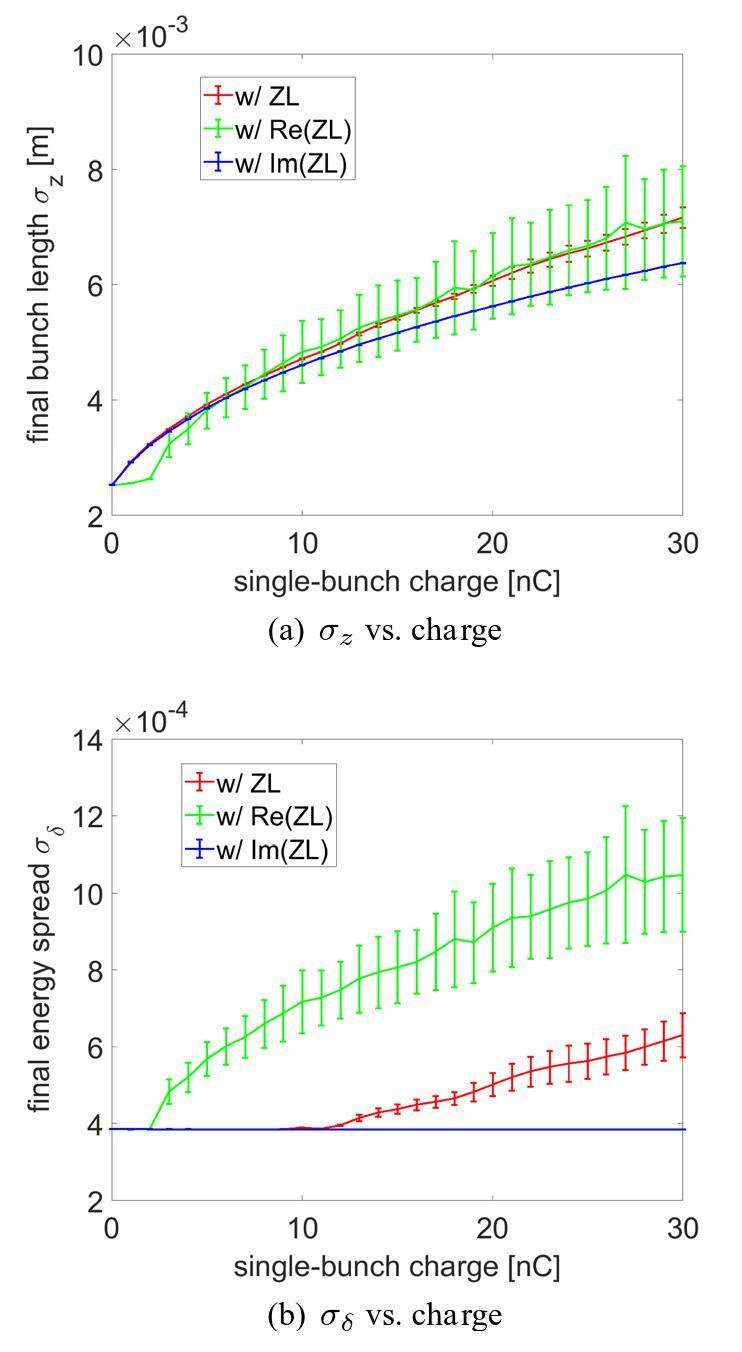
It can be seen in Fig. 8, the purely imaginary longitudinal impedance causes bunch lengthening as the single-bunch charge increases, without driving MWI. Moreover, the simulations demonstrated that the purely real longitudinal impedance was responsible for the MWI, significantly reducing the MWI threshold. No significant increase in bunch length was observed below the threshold current with only the real longitudinal impedance. However, the bunch lengthened as MWI occurred. In general, as shown in Fig. 8 (a), the bunch lengths under the three different conditions were not significantly different for a relatively large range of bunch charges, for instance, from 5 to 15 nC/bunch. The charge densities corresponding to the same single-bunch charge should not differ significantly under these three conditions. More detailed information needs to be obtained by carefully analyzing the bunch distributions and the corresponding incoherent synchrotron tune at different single-bunch charges when the total longitudinal impedance Zl, purely real longitudinal impedance Re(Zl), and purely imaginary longitudinal impedance Im(Zl) are used. The results are shown in Fig. 9.
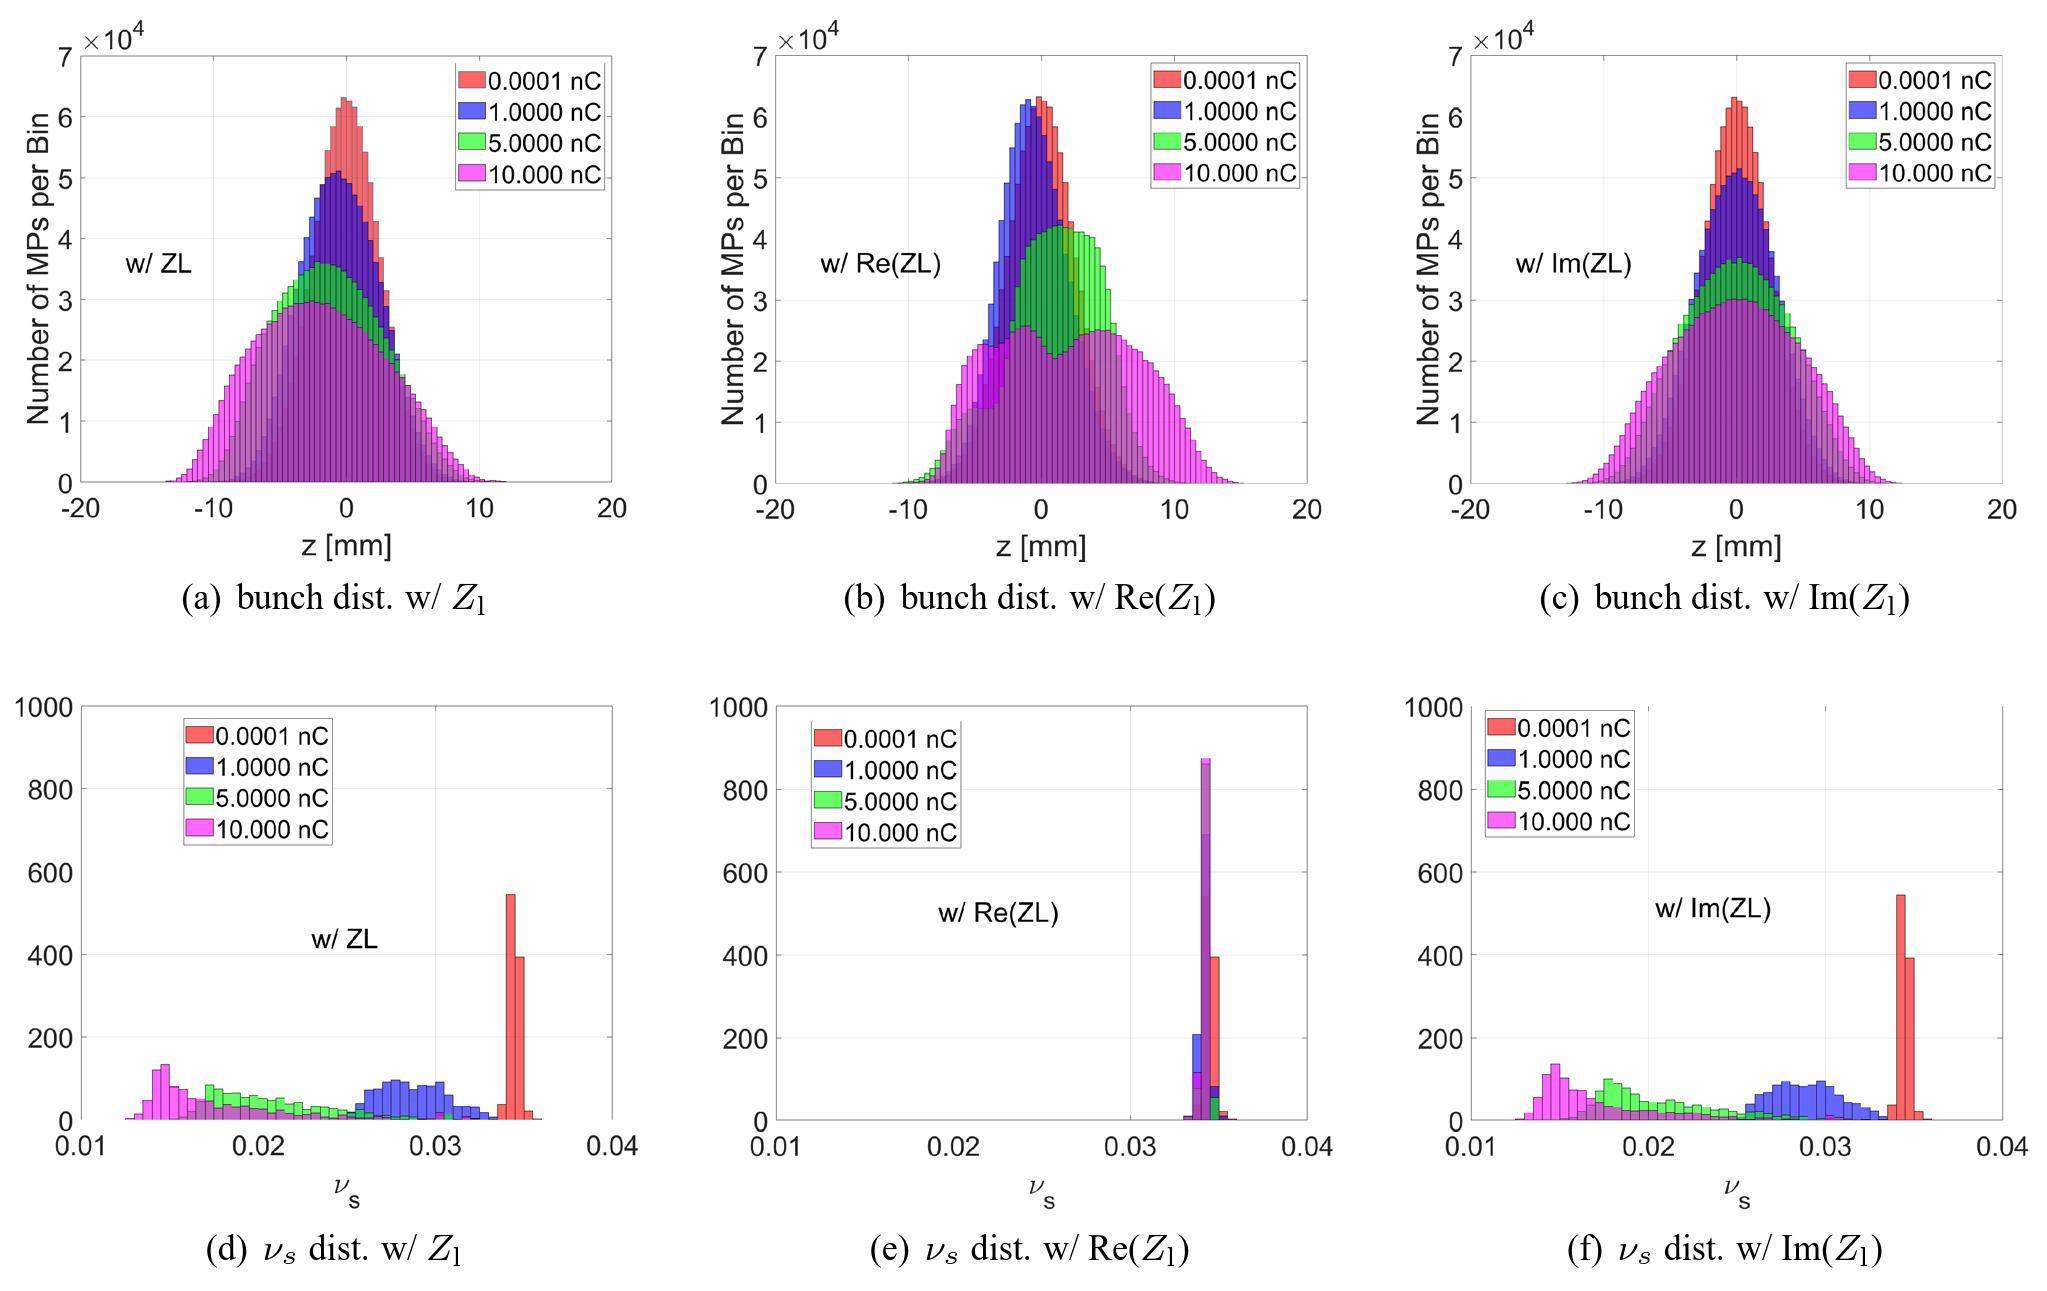
Figure 9 clearly shows that the real part of the longitudinal impedance causes a shift in the longitudinal centroid positions and head–tail asymmetry, which indicates that particles lost energy, and potential well distortion occurred because of the real longitudinal impedance, but no incoherent synchrotron-tune shift, indicating that the spread of the synchrotron-tune was not enlarged. Interestingly, the bunch length remained unchanged below the MWI threshold, as shown in Fig. 8 (a) and Fig. 9 (b). The bunch length were longer when MWI occurred. A more interesting phenomenon is observed when comparing the results shown in Fig. 2 (a) and Fig. 7 (a), indicating a higher TMCI threshold when considering only the real part of the longitudinal impedance. The theory described in Sect. 3 cannot directly explain this phenomenon.
However, the imaginary part of the longitudinal impedance causes bunch lengthening without a centroid shift or driving the MWI. Incoherent tune shifts, and enlargement of the synchrotron-tune spread can also be observed. This phenomenon indicates that the imaginary part of the longitudinal impedance does not lead to energy loss. Meanwhile, Fig. 9 (f) indicates that the purely imaginary longitudinal impedance causes a significant reduction in the incoherent synchrotron tune and significantly increases the spread of synchrotron tune.
We concluded that the imaginary part of the longitudinal impedance was the main reason for the reduction in the TMCI threshold, and the real part of the longitudinal impedance helped to raise the TMCI threshold.
The analytical method was used to check further the influence of the synchrotron tune conditions on the TMCI threshold. Here, we carried out analytic computations using four different synchrotron-tune situations: the real synchrotron-tune distribution νs(J), unchanged constant synchrotron tune νs0, average values of the incoherent synchrotron tune
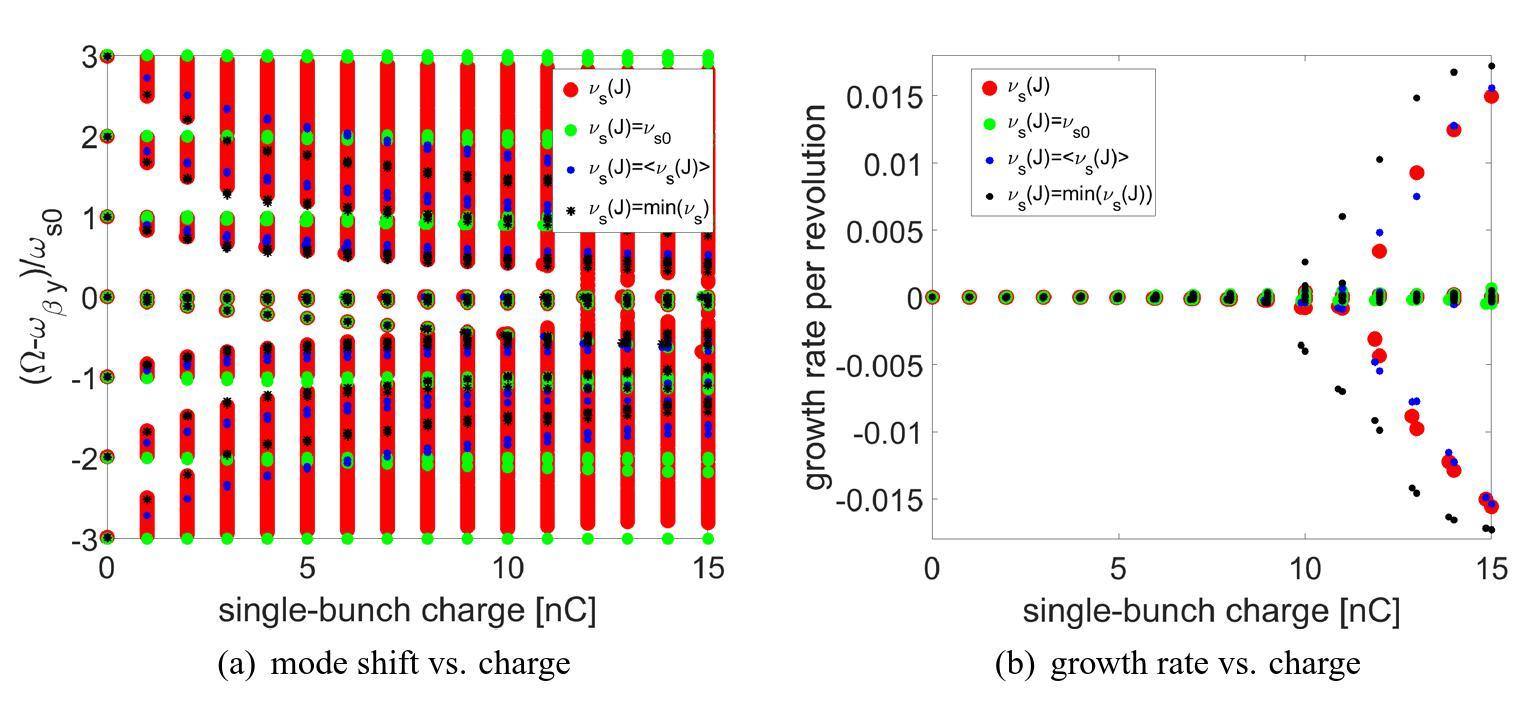
Figure 10 (a) shows that the downward shift of l=0 mode is identical regardless of the synchrotron-tune values used. This phenomenon indicates that the frequency of l=0 mode does not depend on the value of synchrotron tune. However, this can also be observed in Fig. 10 (a), the frequencies of all other modes (except l=0 mode) are different when different values of the synchrotron tune are used in the computation. By comparing the green, blue, and black dots shown in Fig. 10 (a), we can see that the coupling between the l=0 and l=-1 modes occurs at lower single-bunch charges if the synchrotron tune decreases, indicating that the reduction in the synchrotron tune is responsible for the lower threshold. The same conclusion was drawn by comparing the growth rates under different conditions, as shown in Fig. 10 (b). Furthermore, it can be observed from the red dots in Fig. 10 (a), the mode-shift trends are different when a synchrotron-tune spread exists. The frequency spread of each mode becomes larger as the bunch charge increases, which suggests that different “modes” couple at lower charges (e.g., lower than 5 nC). The growth rates are shown in Fig. 10 (b), no significant growth is observed when the bunch charge is lower than approximately 10 nC. This phenomenon is related to the effects of the synchrotron-tune spread on the TMCI threshold, which is left for future study.
Conclusions and Discussions
TMCI is an important single-bunch instability in circular accelerators. Various studies on TMCI have been conducted through analytical methods, simulations, and experiments. Widely used analytical methods to study TMCI involve solving the linearized Vlasov equation. However, previous Vlasov solvers usually do not consider longitudinal impedance, which is not fully self-consistent.
Recently, studies on TMCI in FCC-ee reported a lower TMCI threshold current when longitudinal impedance was included in multiparticle tracking simulations. The lower synchrotron tune caused by the longitudinal impedance was identified as the main reason for the lower TMCI threshold. We conducted similar studies for the CEPC collider ring, and observed a similar phenomenon. To explore the physical picture in detail, we developed an analytical method that includes longitudinal impedance in TMCI computations (inspired by previous work on the beam–beam effect with longitudinal impedance). The key is that we did not assume a linear longitudinal motion. Instead, the distorted-phase space trajectories and corresponding distributions of the synchrotron tune were used as the input information for the code. The Haïssinski solution was used as the equilibrium distribution. However, it should be noted that the equilibrium Haïssinski solution does not always exist. When MWI occurs, the physics indicates that no equilibrium Haïssinski solution exists; therefore, it is not suitable to address situations above the threshold current of the MWI. Multiparticle tracking is suitable in such complicated situations.
In this paper, we present studies of TMCI with longitudinal impedance performed using both the analytic method and multiparticle tracking simulations. The reduction in the incoherent synchrotron tune caused by the imaginary part of the longitudinal impedance was the main reason for the reduction in the TMCI threshold current after considering the longitudinal impedance. However, the real part of the longitudinal impedance increases the TMCI threshold. This conclusion provides clear guidance for the optimization of longitudinal impedance.
Simplified presentation of head tail turbulence
, Technical Report DESY-M-80-19 (1980).Coherent beam-beam instability in collisions with a large crossing angle
. Phys. Rev. Lett. 119, 134801 (2017). https://doi.org/10.1103/PhysRevLett.119.134801Cross-wake force and correlated head-tail instability in beam-beam collisions with a large crossing angle
. Phys. Rev. Accel. Beams 21, 031002 (2018). https://doi.org/10.1103/PhysRevAccelBeams.21.031002Combined phenomenon of transverse impedance and beam-beam interaction with large Piwinski angle
. Phys. Rev. Accel. Beams 26, 064401 (2023). https://doi.org/10.1103/PhysRevAccelBeams.26.064401Coupling effects of beam-beam interaction and longitudinal impedance
. Phys. Rev. Accel. Beams 25, 011001 (2022). https://doi.org/10.1103/PhysRevAccelBeams.25.011001Pelegant: A parallel accelerator simulation code for electron generation and tracking
. in: Proc. 12th Advanced Accelerator Concepts Workshop, in:Simultaneous computation of intrabunch and interbunch collective beam motions in storage rings
. Nucl. Instrum. Meth. Phys. Res. A 806, 221-230 (2016). https://doi.org/10.1016/j.nima.2015.10.029Calculation of longitudinal collective instabilities with mbtrack-cuda
. Nucl. Instrum. Meth. Phys. Res. A 922, 345-351 (2019). https://doi.org/10.1016/j.nima.2019.01.041Nested head-tail Vlasov solver
. Phys. Rev. ST Accel. Beams 17, 021007 (2014). https://doi.org/10.1103/PhysRevSTAB.17.021007Vlasov solvers and macroparticle simulations
. CERN Yellow Reports: Conference Proceedings, 1, CERN-2018-003-CP (2018). https://doi.org/10.23732/CYRCP-2018-001.77Longitudinal and transverse mode coupling instability: Vlasov solvers and tracking codes
. Phys. Rev. Accel. Beams 23, 071001 (2020). https://doi.org/10.1103/PhysRevAccelBeams.23.071001Influences of harmonic cavities on single-bunch instabilities in electron storage rings
. Nucl. Sci. Tech. 32, 89 (2021). https://doi.org/10.1007/s41365-021-00926-7The HEPS project
. J. Synch. Radiat. 25, 1611-1618 (2018). https://doi.org/10.1107/S1600577518012110Equilibrium electron beam parameters of the high energy photon source
. Radiat. Detect. Technol. Methods 7, 279-287 (2023). https://doi.org/10.1007/s41605-022-00374-wLifetime increase using passive harmonic cavities in synchrotron light sources
. Phys. Rev. ST Accel. Beams 4, 030701, (2001). https://doi.org/10.1103/PhysRevSTAB.4.030701Design of a higher harmonic cavity for the SSRF storage ring
. Chin. Phys. C 25, 275 (2008). https://doi.org/10.1088/1674-1137/32/4/007Improving Touschek lifetime and synchrotron frequency spread by passive harmonic cavity in the storage ring of SSRF
. Nucl. Sci. Tech. 28, 108 (2017). https://doi.org/10.1007/s41365-017-0259-yHarmonic cavities and the transverse mode-coupling instability driven by a resistive wall
. Phys. Rev. Accel. Beams 21, 024402 (2018). https://doi.org/10.1103/PhysRevAccelBeams.21.024402Impedance modeling and collective effects in the future circular e+ e- collider with 4 IPs
. EPJ Techniques and Instrumentation 9, 10 (2022). https://doi.org/10.1140/epjti/s40485-022-00084-zLattice design of the CEPC collider ring for a high luminosity scheme
. in Proceedings of the 12th International Particle Accelerator Conference,Impedance driven collective effects in CEPC
. J. Instrum. 19, P02016 (2024). https://doi.org/10.1088/1748-0221/19/02/P02016Resistive-wall impedance of two-layer tube
. Phys. Rev. ST Accel. Beams 10, 111003 (2007). https://doi.org/10.1103/PhysRevSTAB.10.111003a mechanism of longitudinal single bunch instability in storage rings
. Part. Accel. 51, 43 (1995).Numerical solution of the Haïssinski equation for the equilibrium state of a stored electron beam
. Phys. Rev. Accel. Beams 21, 124401 (2018). https://doi.org/10.1103/PhysRevAccelBeams.21.124401Equilibrium of an arbitrary bunch train in presence of a passive harmonic cavity: Solution through coupled haïssinski equations
. Phys. Rev. Accel. Beams 23, 064403 (2020). https://doi.org/10.1103/PhysRevAccelBeams.23.064403Numerical solution of the coupled haïssinski equations for the equilibrium state of an arbitrary bunch train in an electron storage ring
. Nucl. Instrum. Meth. Phys. Res. A 1006, 165434 (2021). https://doi.org/10.1016/j.nima.2021.165434Beam dynamics in high energy particle accelerators
. World Scientific (2014). https://doi.org/10.1142/p899The authors declare that they have no competing interests.


