Introduction
Beam diagnostics are critical for understanding the characteristics of electron beams in accelerator facilities [1, 2]. Considering the development of free-electron lasers (FELs) and ultrafast electron diffraction (UED) facilities for example, the demand for highly precise beam diagnostics is continuously increasing[3-8], especially for the ultrafast exploration in pump-probe experiments. Moreover, noninvasive devices are favorable options that can provide real-time measurements and feedback, even bunch-by-bunch. Beam monitoring based on the TM010 mode is a nondestructive method that has been utilized in many facilities owing to its many advantages, such as compactness, simple structure, and high sensitivity [9-11]. Because the TM010 mode excited by the passing beam is related to many beam parameters, including the bunch charge, arrival time, bunch energy, and length[12, 13], this method has significant potential for measuring the four aforementioned parameters with a high resolution.
Regarding a cylindrical cavity, the amplitude of the TM010 mode is proportional to the bunch charge. A resonant cavity can be employed for the bunch charge and arrival time measurements by precisely detecting the monopole mode, which is known as the cavity beam arrival time monitor (BAM) or the reference cavity of the cavity beam position monitor (CBPM)[14, 15]. This approach can achieve a high resolution and has been applied in many facilities [16-18]. The best resolution of the cavity BAM was reported ([16]) to be 13 fs at 250 pC, which was obtained at the Linac Coherent Light Source (LCLS) using a 2806 MHz cavity.
The bunch length is a key parameter of the beam longitudinal features. Many methods have been proposed to obtain the beam length [19-23]; however, only a few are nondestructive. Considering the development of FELs and UEDs, a noninvasive bunch-length monitor for short bunches is currently required, such as for those shorter than 1 ps. The TM010 mode can be used for measuring the bunch length owing to the influence of the bunch length on the amplitude of the TM010 mode [13, 24]. Compared to other techniques, this method has the potential for a high-resolution for measuring short bunches. It usually requires two TM010 modes with different frequencies to measure the amplitudes of the beam longitudinal spectrum at two frequencies. For this technique, the beam energy, transverse offset, and longitudinal distribution all have an impact on the amplitude of the TM010 mode, which may cause significant inaccuracies [25]. The errors caused by these factors will be carefully analyzed in this article.
The beam loss factor is also related to the beam energy [26, 27], indicating that the monopole mode may be used to measure the beam energy. Compared to techniques such as those using dipole magnets [28], measuring the bunch energy based on the TM010 mode is compact and noninvasive. This technique demands two cavities with the same frequencies of the TM010 modes to normalize the bunch length and charge; longer cavities can achieve a higher resolution. However, considering a limitation of this method, it can only be used for energy measurements of low-energy electron beams; therefore, it is particularly suitable for UEDs [5] and ultrafast electron microscopes (UEMs) [29].
Because the TM010 mode is related to multiple parameters, the coupling effect must be limited when measuring a certain parameter. For the bunch length or energy measurements, the two cavities should be specifically designed to normalize the other parameters. A set of three cavities with different structures and frequencies of 1.902 GHz and 11.424 GHz is proposed for the diagnostics of the four beam parameters in this study. This design is expected to provide noninvasive measurements and save considerable space in accelerators compared to other beam diagnostic devices.
The relationship between each beam parameter and the TM010 mode is theoretically analyzed in Sect. 2. Section 3 presents the simulation results of the different parameters and evaluation experiments. A design of three cavities for the diagnostics of the four beam parameters is presented in Sect. 4.
Theoretical basis of the TM010 mode
When a relativistic electron beam moves along a cavity, the electromagnetic field of a series of eigenmodes is excited. Applying this theory, the voltage of a particular resonant mode excited in the cavity (Vexc) is represented as follows:
In principle, the loss factors of bunches passing through a cavity at a nonrelativistic velocity are lower than those at an ultrarelativistic velocity. The energy loss in the cavity should vanish when the velocity approaches 0. The influence of the bunch length must also be considered if the bunch length is not negligible with respect to the frequency of the TM010 mode. Assuming a Gaussian bunch with an rms length
Regarding the measurement of the bunch charge, cavities with a low resonant frequency and short cavity length are preferred to reduce the influence of the bunch length and energy jitter, especially under conditions of a long bunch length or low energy.
Vout in Eq.(4) is proportional to
For measuring the bunch energy, the charge must be normalized; furthermore, the exponential term in Eq. (4),
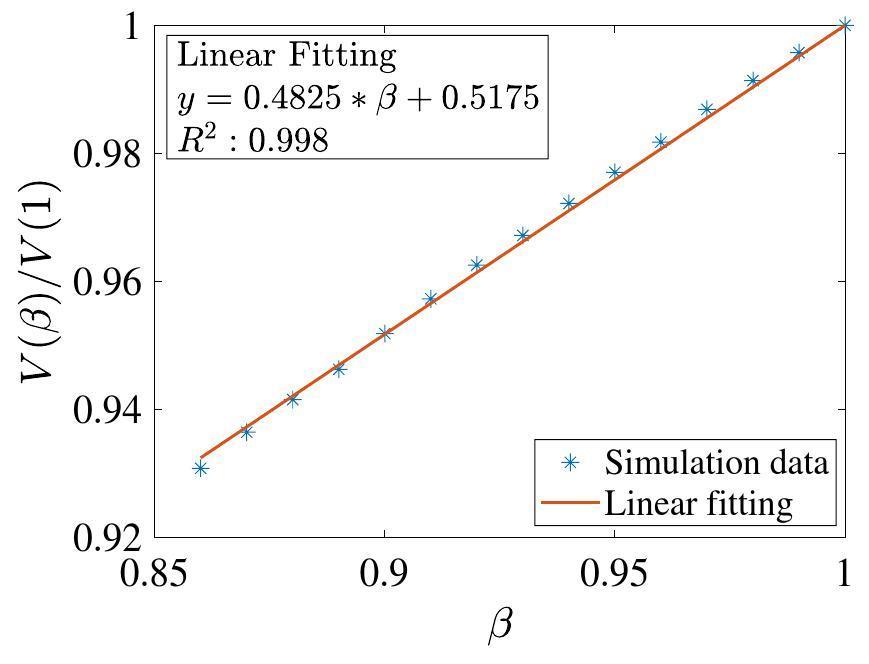
The variation in the amplitude of the TM010 mode with β and the ratio of the cavity length L and radius d is shown in Fig. 1(a). Note, a nearly linear relationship between β and the voltage amplitude can be observed Fig. 1 when β>0.86 and L/d<2.
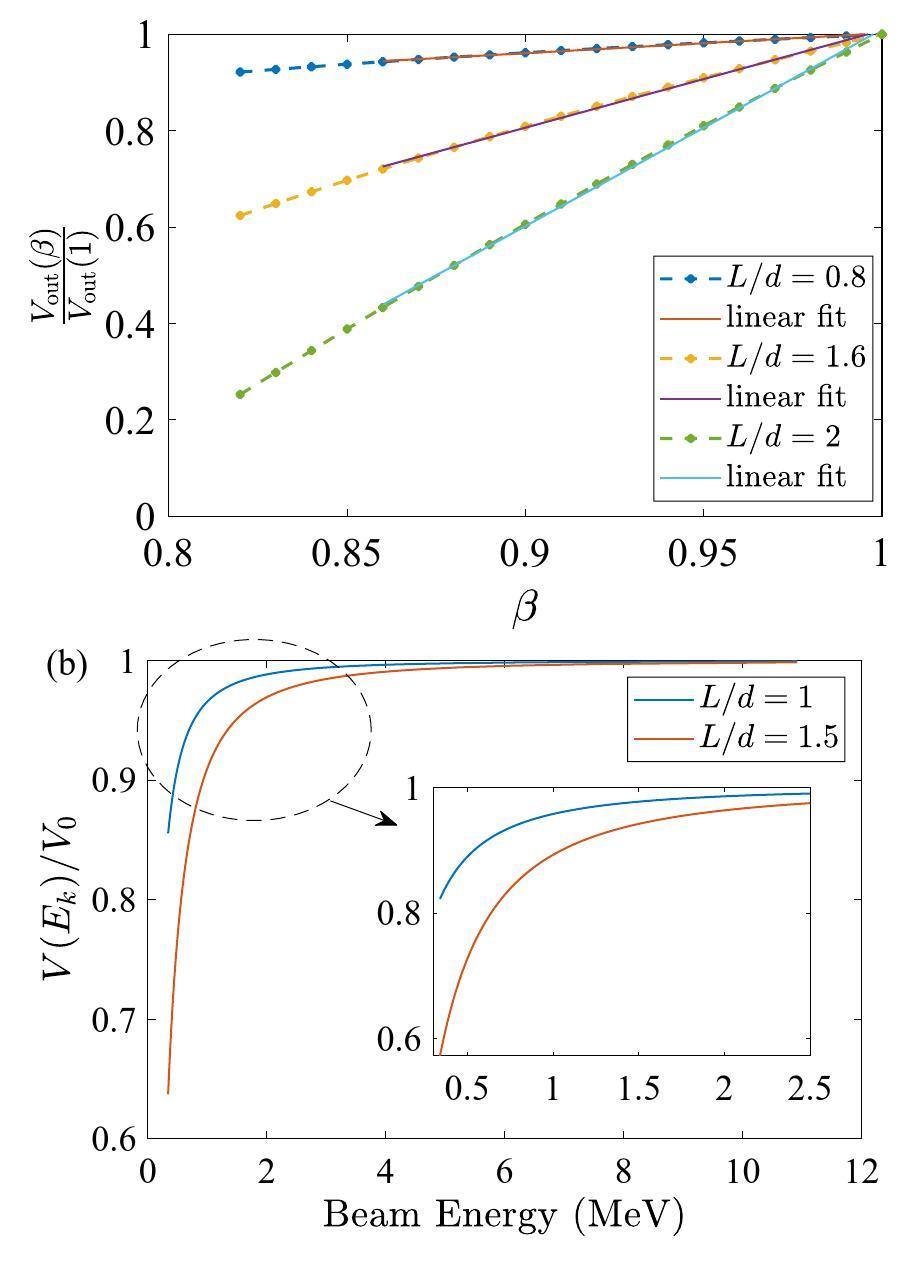
Compared to β, the beam energy Ek is a more commonly used parameter. The relationship between the beam energy and β is expressed by the following formula:
Simulation and test results of different parameters
Simulation and analysis of the cavity beam length monitor
Influence of the beam energy and the resolution analysis
Based on the discussion in Sect. 2, two cavities with proportional dimensions have the same
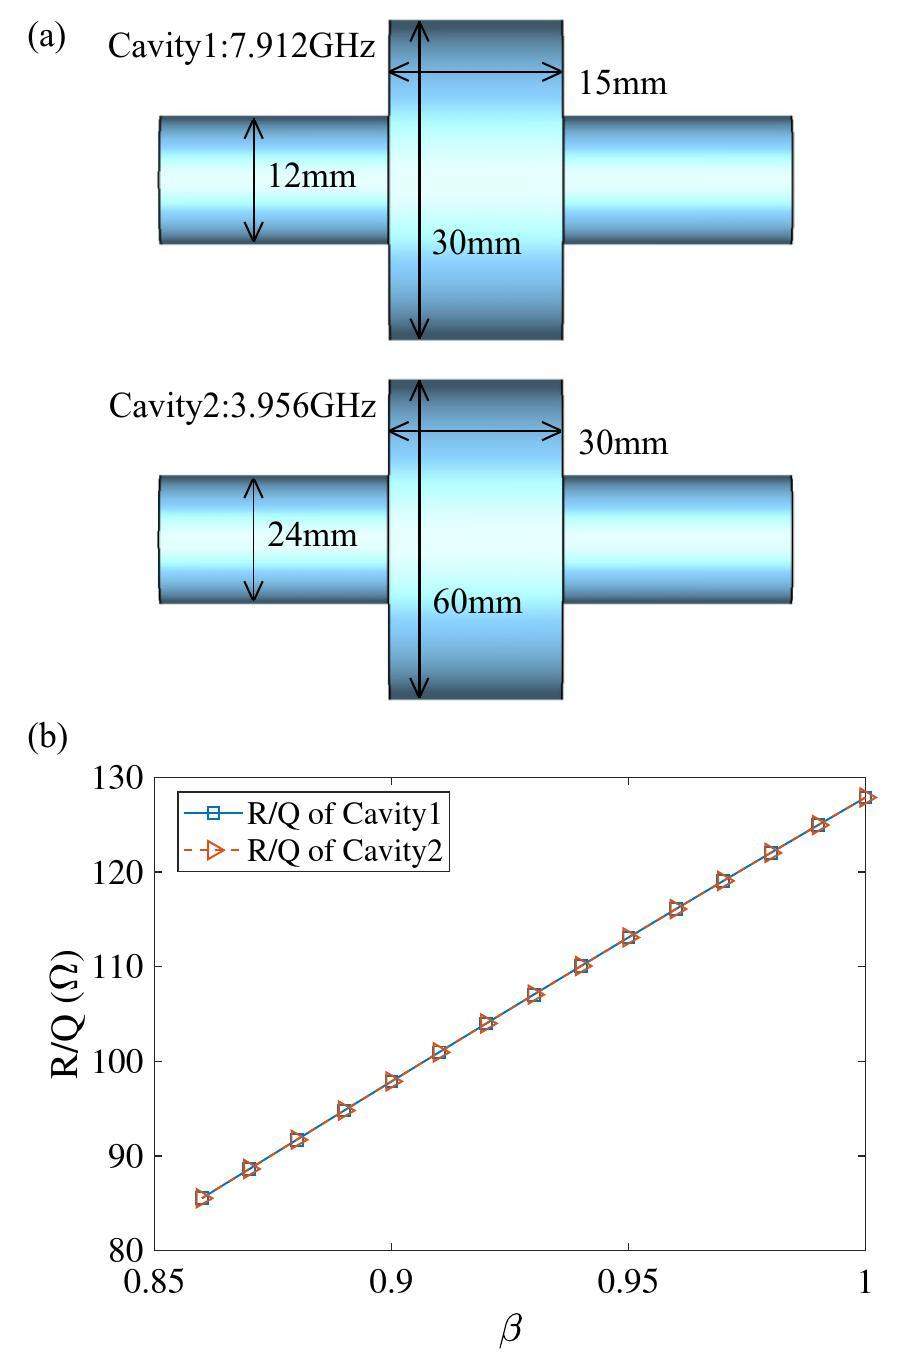
By cancelling the
Influence of the transverse offset
The output voltage is proportional to the
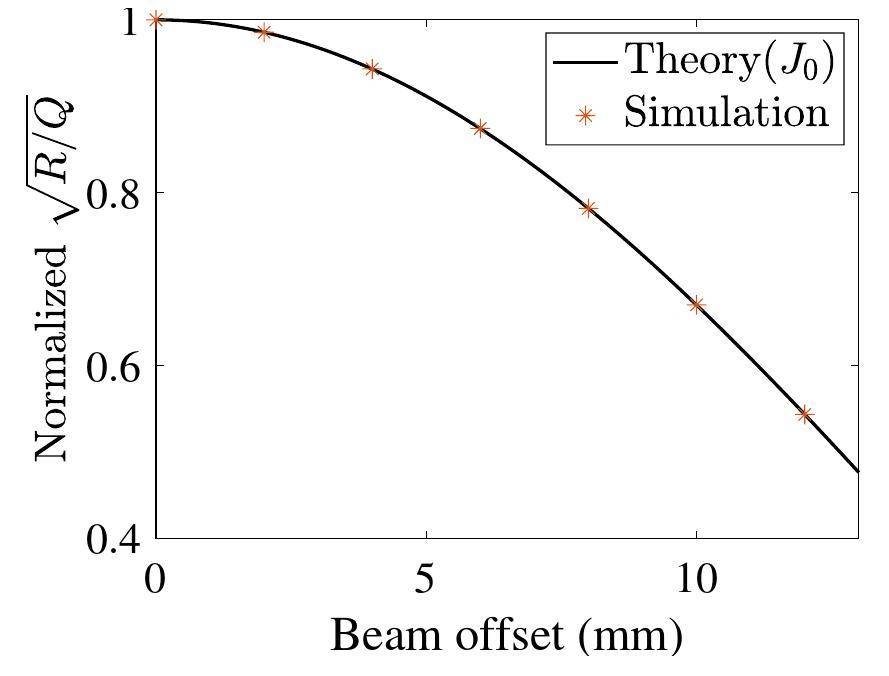
For cavities with tubes, the electric field intensity of the TM010 mode along the cavity diameter is inconsistent with the J0 function, especially for the pipe area. According to [31, 32], the
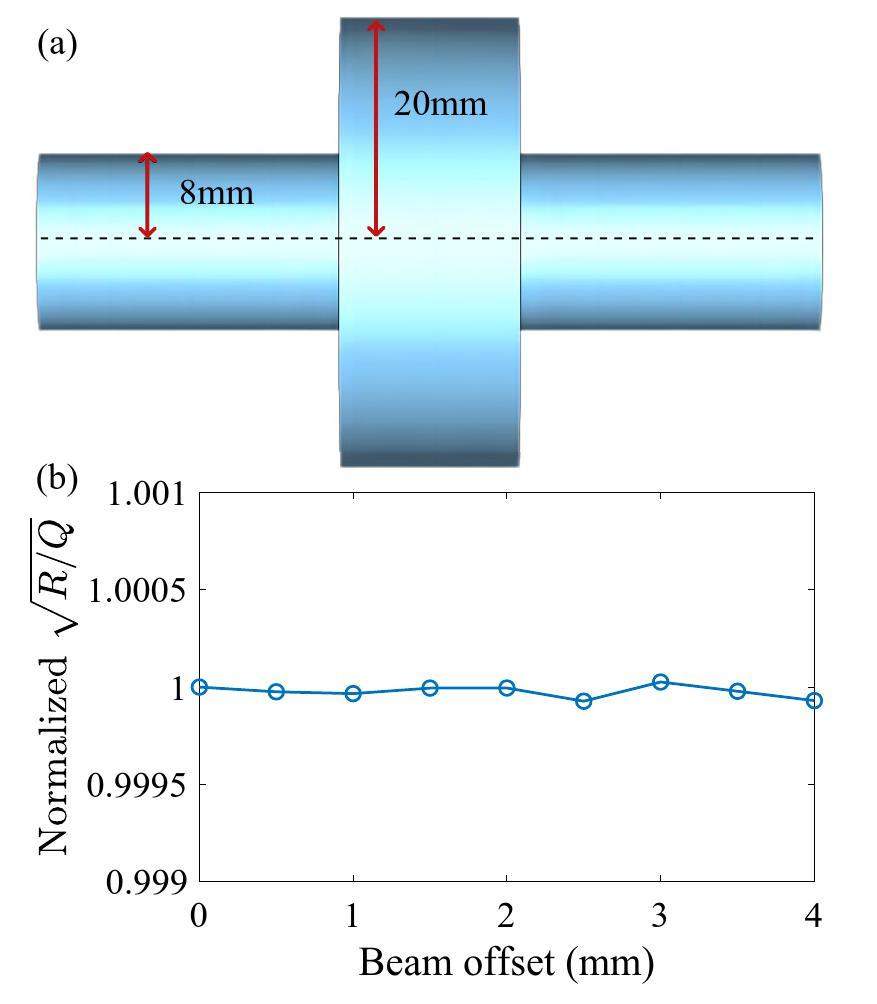
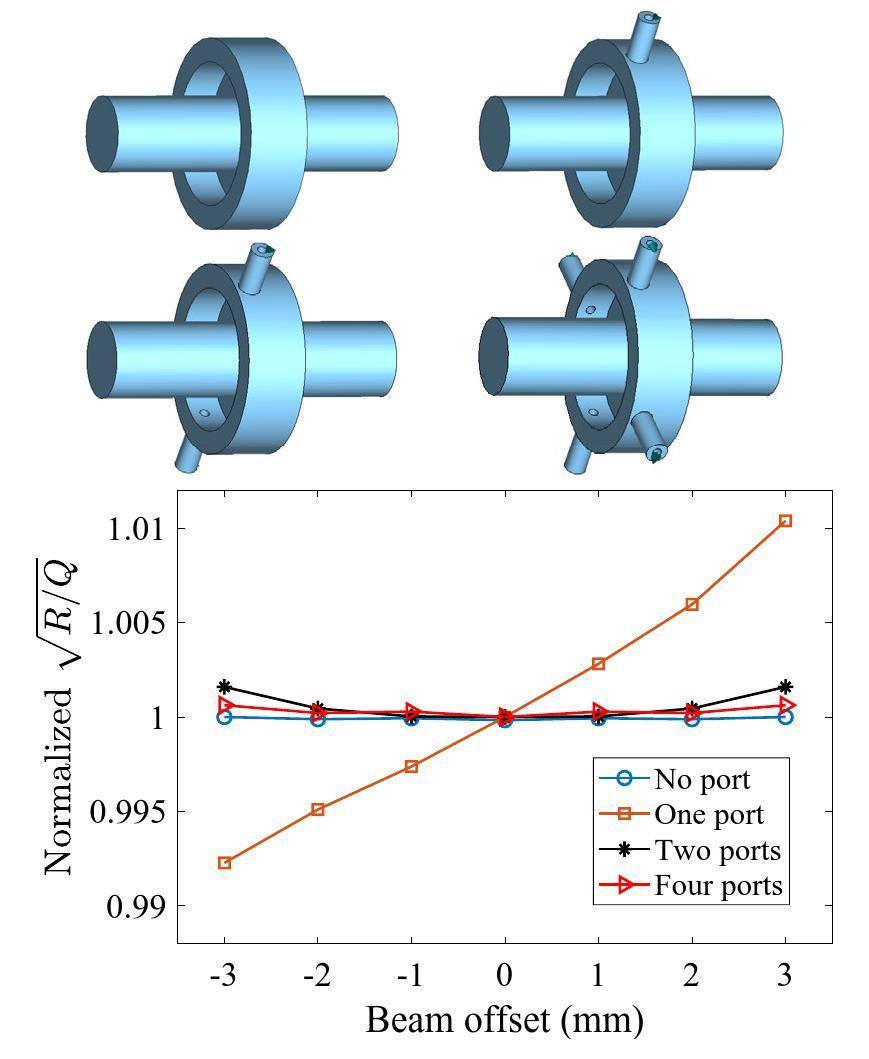
Coupling structures and cavity types, such as the reentrant type, can lead to noncylindrically symmetric structures of the cavity. In these cases, the beam offset effect no longer conforms to the aforementioned theoretical analysis. To study the influence, a simulation of the reentrant cavity monitor with different coupling ports was performed in the CST software. Figure 5 demonstrates the four cavities established for the simulation and the amplitude variation of the TM010 modes. For the cavity with a single port, the beam offset had a significant impact on the output signal from the port; the change was approximately 1% with a 3 mm offset. For the four-port cavity, the amplitude variation owing to the transverse offset was less than 1.
Influence of the beam longitudinal distribution
The measurement of the bunch length based on the TM010 mode was achieved by evaluating the amplitudes of two frequencies of the longitudinal spectrum of the beam and should be independent of the distribution. Because the shape of the bunch is not Gaussian in an actual scenario, the influence of different distributions should be considered. For a bunch with a longitudinally symmetric distribution, the beam spectrum
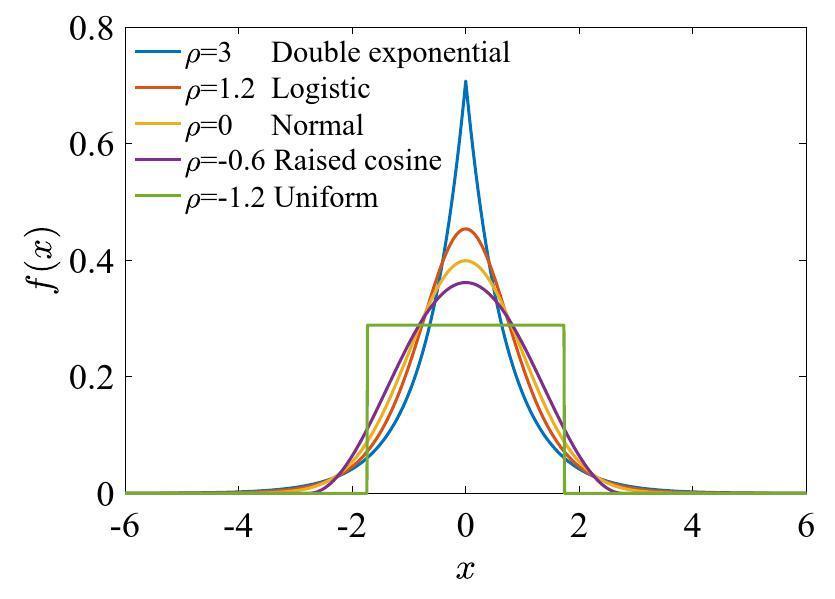
If the distribution of a longitudinally symmetric bunch is considered, in which the kurtosis significantly differs from that of the Gaussian distribution, such as the double exponential distribution (ρ=3), and if the error is limited to be within 1, the criterion of the beam length and frequency can be obtained as follows:
In conclusion, the resolution in Eq.(9) is better with a higher frequency for short bunches, but the frequency is limited to ensure that the influence of different bunch shapes is negligible.
Simulation and analysis for low-energy measurement
Influence of the resonant frequency
As analyzed in Sect. 2, the TM010 mode can be used for low-energy measurements. However, for a low energy, the bunch length and distribution may significantly vary owing to the space charge effects and low magnetic stiffness, which will affect the accuracy. The Eq. (4) can be rewritten as follows:
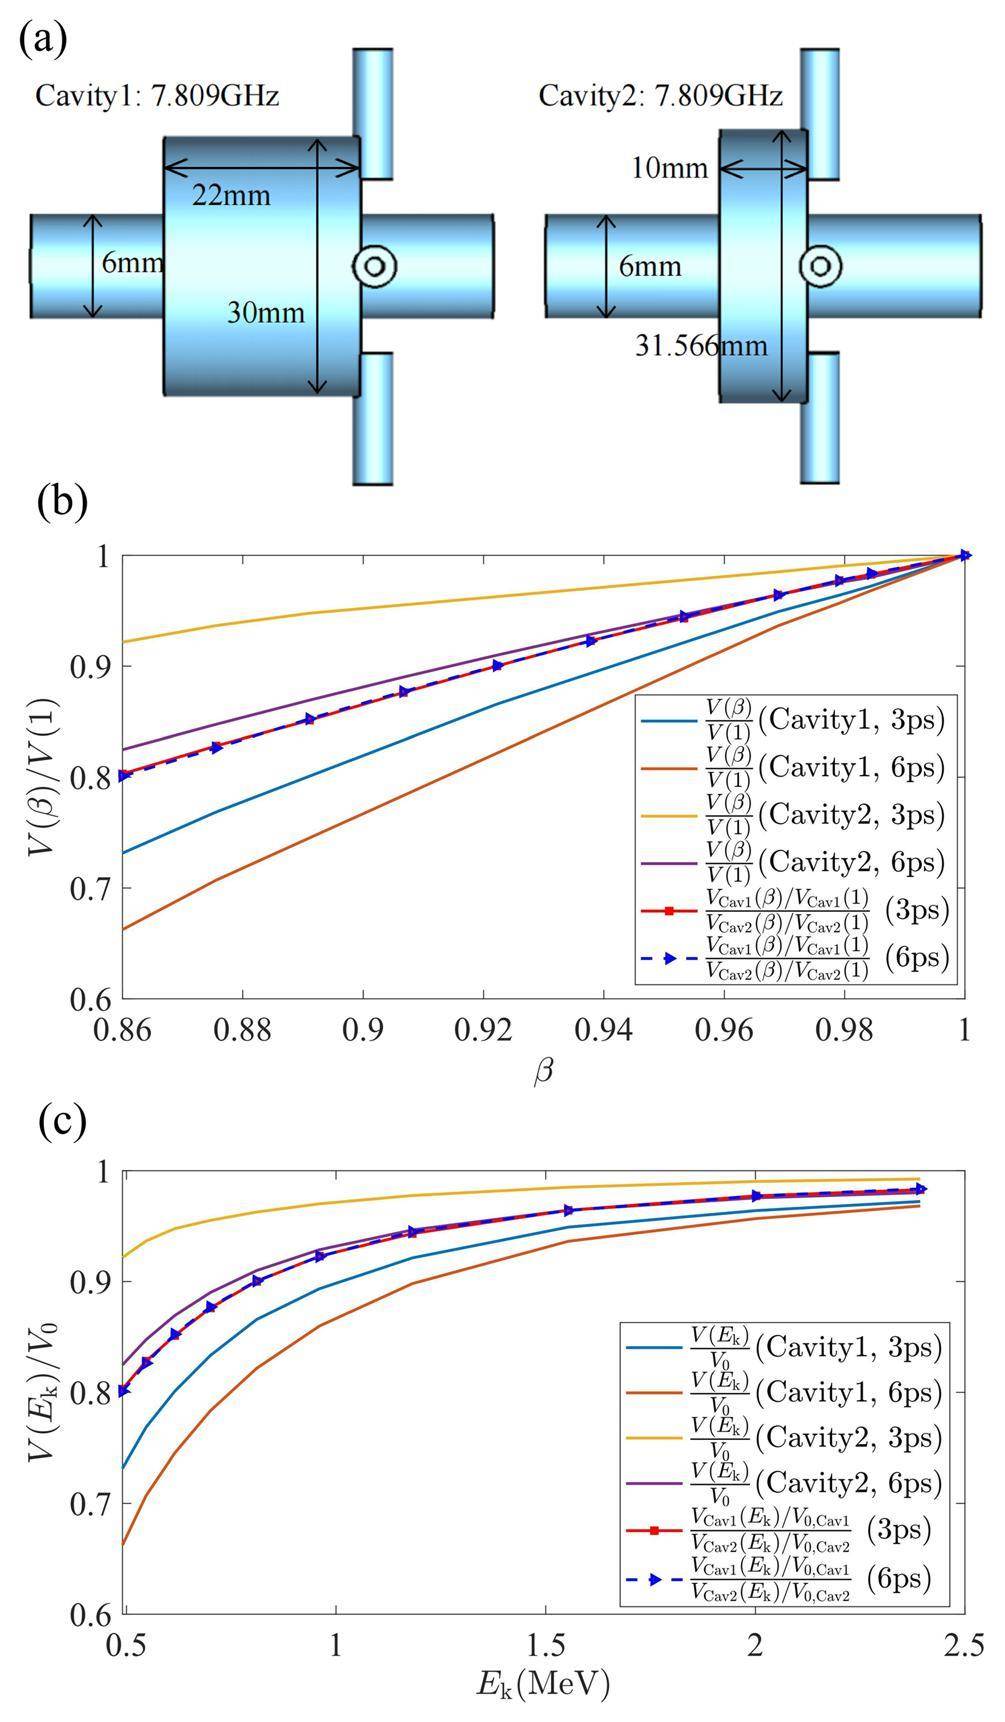
A simulation of two cavities was conducted in the CST software to validate the analysis. The two cavities were designed to have the same frequency but a different lengths, as shown in Fig. 7(a). Using the CST Wakefield solver, the voltage signals of the two cavities with different beam lengths and
Resolution analysis for low-energy measurement
The relationship between
| Resolution (keV) | Precision () | |
|---|---|---|
| 0.5 | 3.17 | 6.34 |
| 1 | 11.52 | 11.52 |
| 2 | 55.02 | 27.51 |
| 3 | 151.99 | 50.66 |
Evaluation test of the bunch length and energy
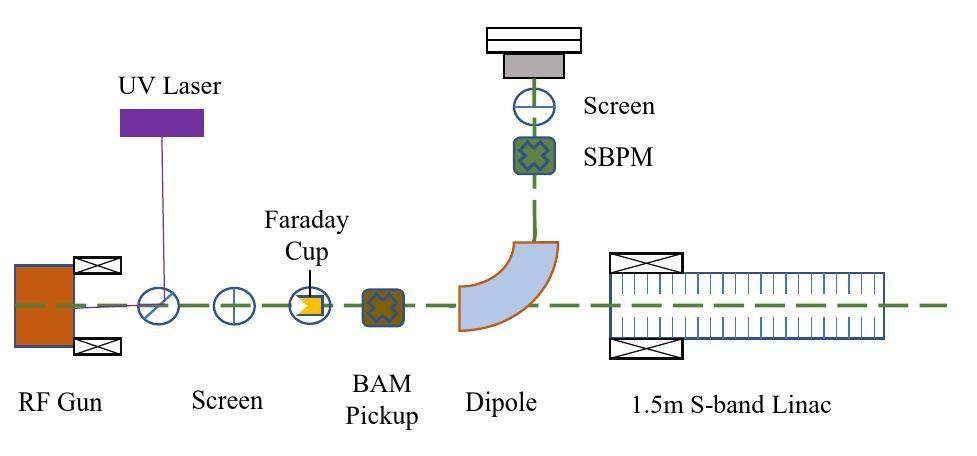
Evaluation experiments were performed based on a 4.76-GHz BAM pickup [33], which was installed after the RF gun in our test beamline of the Tsinghua Thomson scattering X-ray source facility [34], as seen in Fig. 9. The main beam parameters are summarized in Table 2.
| Parameters | Test beamline |
|---|---|
| Bunch charge (pC) | 20-30 |
| Laser pulse length (ps) | 3 |
| Electron energy (MeV) | 0.5-3 |
| Pulse repetition rate (Hz) | 10 |
In the test, the beam energy ranged from 0.5 MeV to 3 MeV and the raw rf signals from the pickup were captured by a 20 GHz bandwidth oscilloscope. Because the variation in the bunch charge also affects the amplitude of the pickup, an adjacent Faraday cup was used to calibrate the charge information. The amplitude variation of the pickup with the energy is plotted in Fig. 10. The sensitivity is 130.54 mV/pC at an energy of 3 MeV, but when the energy is reduced to 0.5 MeV, the sensitivity is only 70.92 mV/pC, decreasing to 54%.
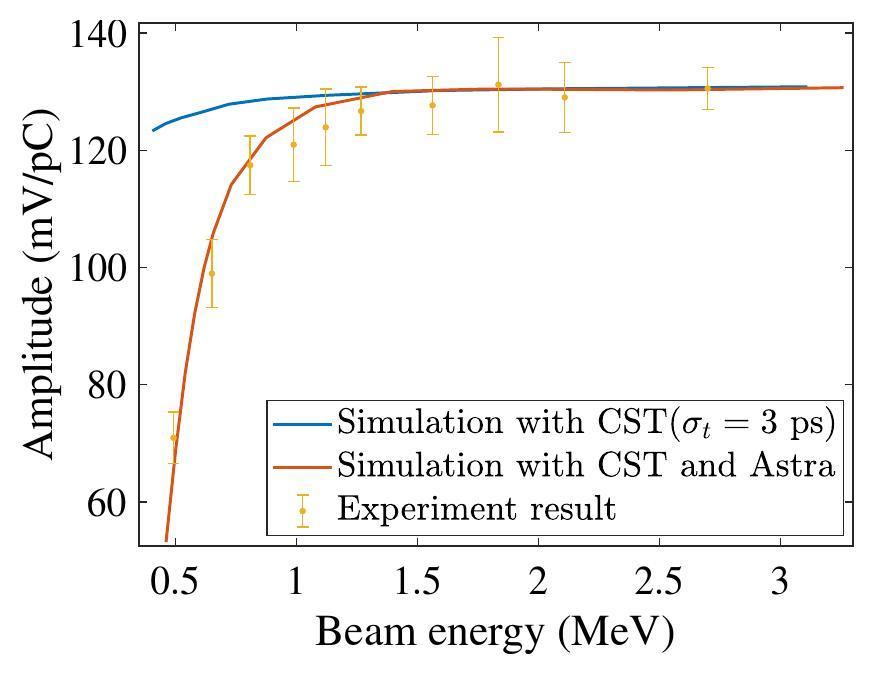
Figure 10 also presents the simulation results obtained in the CST with a beam length of 3 ps, which is the same as the laser pulse length. However, the simulated sensitivity is only reduced to 95% at 0.5 MeV, which is inconsistent with the experimental result. This occurred because the beam length increases at lower energies owing to the space charge force effects, which are not considered in the CST Wakefield solver. A simulation using Astra was performed with the space charge force activated, and the beam length at different energies was obtained. Subsequently, we imported the bunch energy and bunch-length parameters into CST to recalculate the amplitude of the pickup. As shown in Fig. 10, the experimental data and the simulation results obtained with the CST and Astra [35] are in good agreement.
A design of three cavities for the four-parameter measurement
Two cavities can be used for the bunch length or low-energy measurement. For the TM010 mode in the cavity, a high frequency is sensitive to the beam length, and a long cavity length is sensitive to the beam energy, while the TM010 mode with a low frequency and short length was used as the BAM monitor and for the charge normalization. A set of three cavities was designed to measure the beam charge, arrival time, beam length, and energy. Figure 11 presents the three cavities established in CST. The frequency of Cavity1 and Cavity2 was 1.904 GHz for both, but the cavity lengths were significantly different. The two cavities can be used to measure the beam energy with the beam length normalized. The frequency of Cavity3 increased to 11.424 GHz, and the sizes of Cavity3 and Cavity2 were proportional. Therefore, Cavity2 and Cavity3 can be used for measuring the beam length. Note, the three cavities were designed with four ports to reduce the influence of the beam offset.
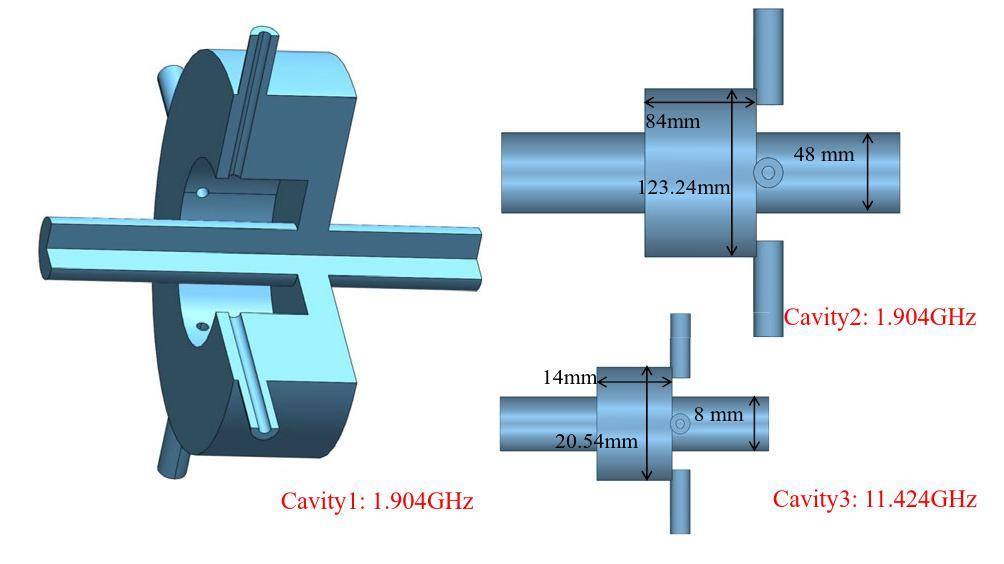
In the simulation, we found that increasing the length of the Cavity2 demonstrated a more apparent energy dependence, but the frequency of the TM011 mode gradually approached that of the TM010 mode. The long cavity length may also cause errors owing to the tilted incidence of the beam. The cavity length should be carefully chosen to avoid the effect of the TM011 mode and the beam tilted incident. The final optimized dimensions and simulated rf parameters are summarized in Table 3.
| Parameter | Cavity1 | Cavity2 | Cavity3 |
|---|---|---|---|
| Cavity radius (mm) | 32.50 | 61.62 | 10.27 |
| Cavity length (mm) | 20.00 | 84.00 | 14.00 |
| Cut radius (mm) | 20.00 | – | – |
| Cut length (mm) | 15.00 | – | – |
| Pipe radius (mm) | 5.00 | 24.00 | 4.00 |
| Frequency (GHz) | 1.904 | 1.904 | 11.424 |
| 84.29 | 106.09 | 106.09 |
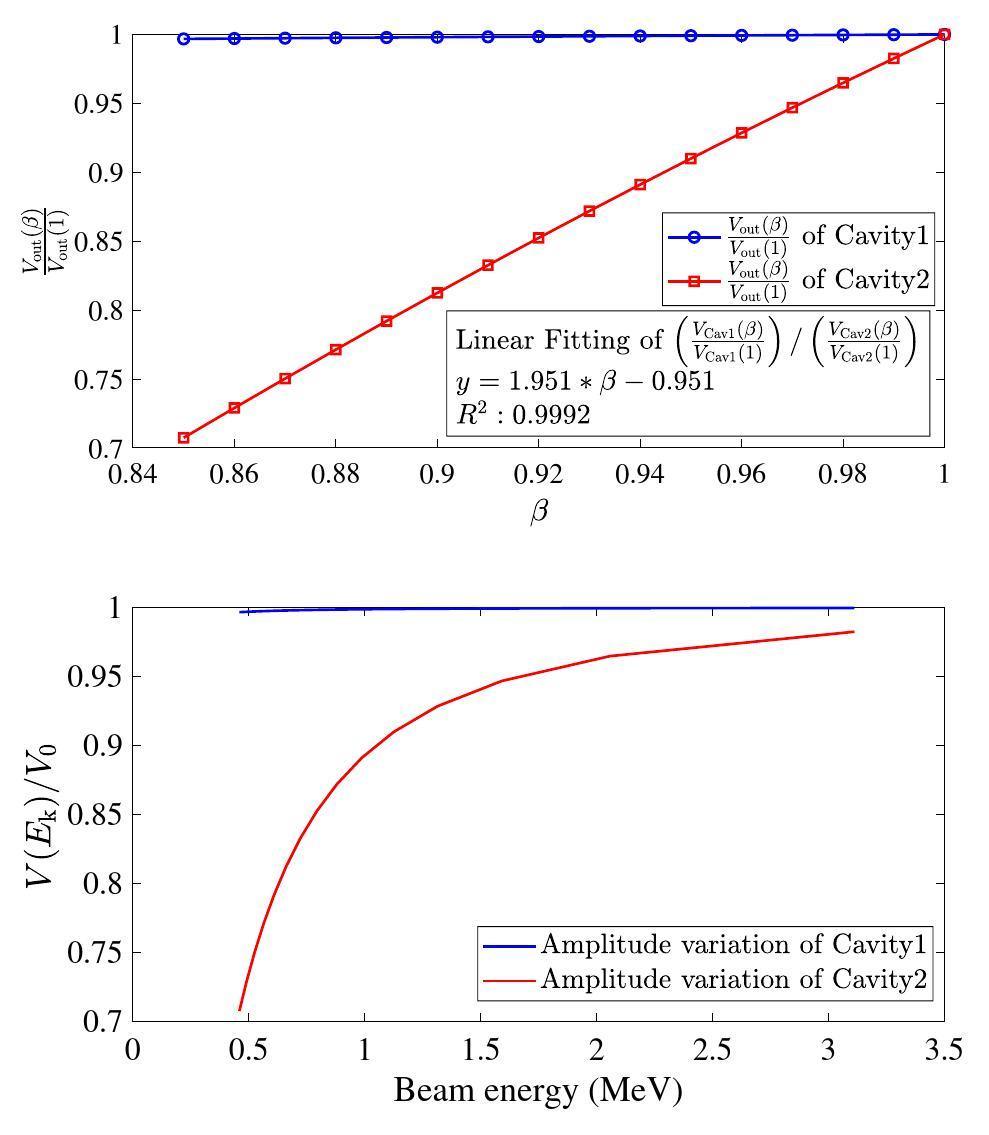
The amplitudes of the TM010 modes in Cavity1 and Cavity2 were monitored while scanning the β values. As shown in Fig. 12, the voltage amplitude of Cavity1 was barely reduced compared to that of Cavity2. The ratio of the two normalized signals was proportional to β with a coefficient of 1.951. The energy measurement resolutions calculated by Eq. (18) are summarized in Table 4, with a 70 dB SNR. The theoretical resolution reached 0.70 keV at 0.5 MeV and decreased to 37.59 keV at 3 MeV.
| Resolution (keV) | Precision () | |
|---|---|---|
| 0.5 | 0.78 | 1.56 |
| 1 | 2.84 | 2.84 |
| 2 | 13.61 | 6.80 |
| 3 | 37.59 | 12.53 |
The
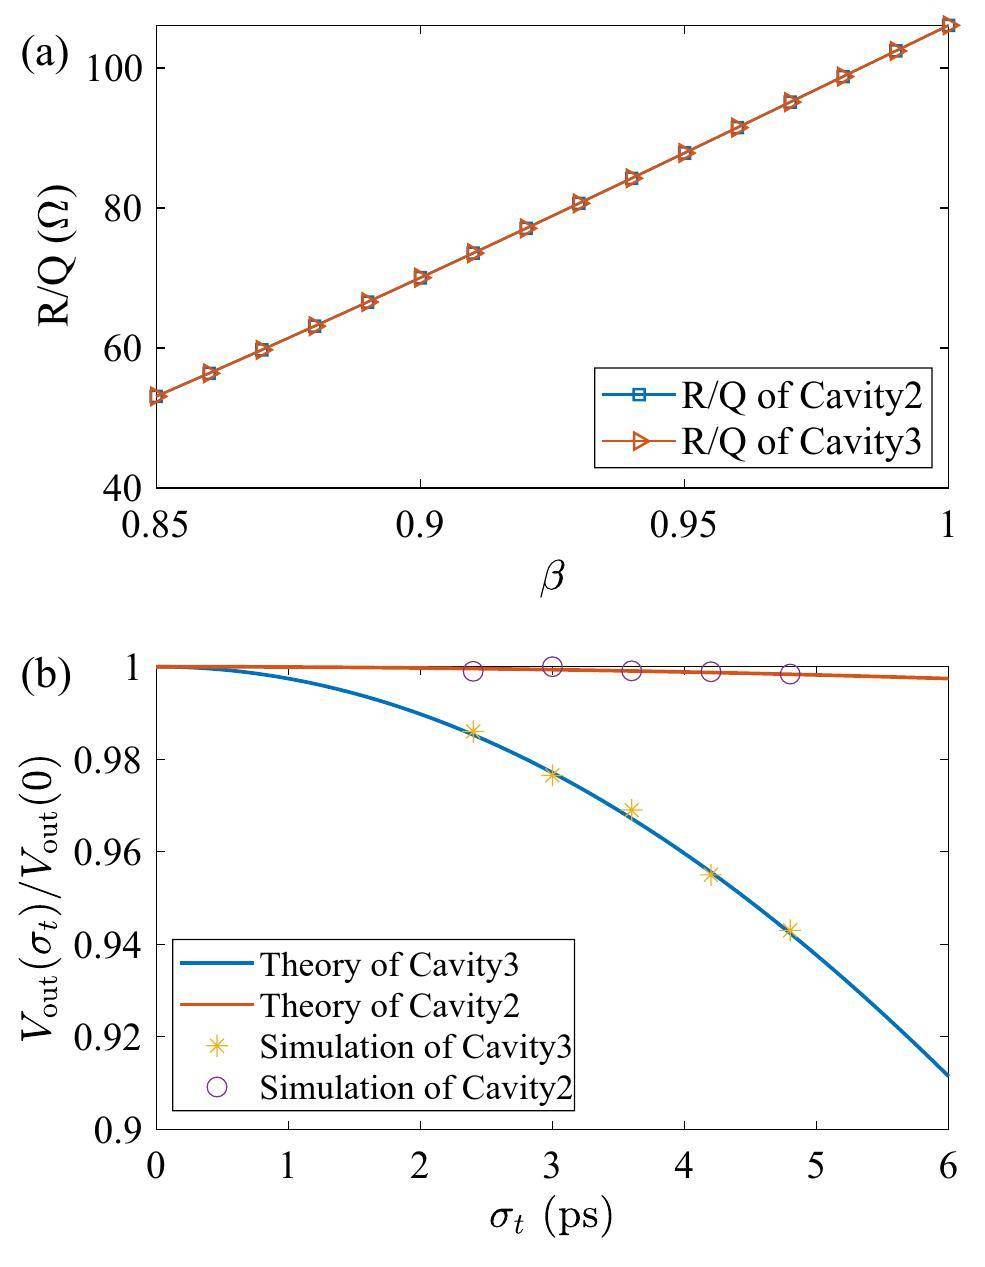
As shown in Fig. 12, the amplitude variation of Cavity1 was significantly small with β>0.86. The frequency of Cavity1 was 1.904 GHz, which is the same as that of Cavity2, which indicates that the amplitude of Cavity1 did not decrease when the bunch length was less than 6 ps. Therefore, Cavity1 can be used for monitoring the bunch charge and arrival time, as previously analyzed.
Summary
In this study, we analyzed beam diagnostics based on the TM010 mode; the impacts of multiple beam parameters on the TM010 mode were studied. The bunch length and energy measurements both require two TM010 modes. Regarding the measurement of the bunch length, the errors caused by the beam energy, beam offset, and longitudinal distribution were thoroughly considered. For low-energy measurements, the amplitude of the TM010 mode was nearly linear with β when β>0.86, and the bunch length was normalized with the same frequency of the two cavities. This method was used for low-energy measurements, achieving a high accuracy with a long cavity length. An evaluation test of the bunch length and energy was performed with a 4.76 GHz BAM pikcup. Finally, a set of three cavities with frequencies of 1.904 GHz and 11.424 GHz was proposed for measuring the four parameters, which reached a 63.13-fs resolution at 1 ps and a 1.56 precision at 0.5 MeV with a 70 dB SNR.
First commissioning results of the coherent scattering and imaging endstation at the Shanghai soft X-ray free-electron laser facility
. Nucl. Sci. Tech. 33, 114 (2022). https://doi.org/10.1007/s41365-022-01103-0Review of fully coherent free-electron lasers
. Nucl. Sci. Tech. 29, 160 (2018). https://doi.org/10.1007/s41365-018-0490-1Design and optimization of low-emittance C-band photocathode RF electron gun
. Nuclear Techniques 44, 060201 (2021) (in Chinese). https://doi.org/10.11889/j.0253-3219.2021.hjs.44.060201Experimental demonstration of high quality MeV ultrafast electron diffraction
. Rev. Sci. Instrum. 80, 083303 (2009). https://doi.org/10.1063/1.3194047SXFEL: A Soft X-ray Free Electron Laser in China
. Synchrotron Radiation News. 30, 29-33 (2017). https://doi.org/10.1080/08940886.2017.1386997X-ray crystallography experimental data screening based on convolutional neural network algorithms
. Nuclear Techniques 46, 030101 (2023) (in Chinese). https://doi.org/10.11889/j.0253-3219.2023.hjs.46.030101Beam dynamics optimization of very-high-frequency gun photoinjector
. Nucl. Sci. Tech. 33, 116 (2022). https://doi.org/10.1007/ s41365-022-01105-yElectron beam diagnostic system for the Japanese XFEL
, in Proceedings of the 1st International Beam Instrumentation Conference. (Advanced diagnosis of the temporal characteristics of ultra-short electron beams
. Nucl. Instrum. Methods A 637, S7-S11 (2011). https://doi.org/10.1016/j.nima.2010.02.010Optimization of beam arrival and flight time measurement system based on cavity monitors at the SXFEL
. IEEE Trans. Nucl. Sci. 68, 2-8 (2020). https://doi.org/10.1109/TNS.2020.3034337Design of cavity beam monitor at HLS
. in Proceedings of IPAC2011. (Subpicosecond beam length measurement study based on the TM010 mode
. Phys. Rev. ST Accel. Beams 16, 072801 (2013). https://doi.org/10.1103/PhysRevSTAB.16.072801Beam test results of high Q CBPM prototype for SXFEL
. Nucl. Sci. Tech. 28, 51 (2017). https://doi.org/10.1007/s41365-017-0195-xOptimization of the cavity beam-position monitor system for the Shanghai Soft X-ray Free-Electron Laser user facility
. Nucl. Sci. Tech. 33, 124 (2022). https://doi.org/10.1007/s41365-022-01117-8Femtosecond operation of the LCLS for user experiments
. in Proceedings of the IPAC2010. (Dual-cavity beam arrival time monitor design for the Shanghai soft X-ray FEL facility
. Nucl. Sci. Tech. 30, 72 (2019). https://doi.org/10.1007/s41365-019-0593-3LLRF and timing system for the SCSS test accelerator at SPring-8
. Nucl. Instrum. Methods A 696, 151-163 (2012). https://doi.org/10.1016/j.nima.2012.06.067Measurement of femtosecond electron bunches using a rf zero-phasing method
. Phys. Rev. E 57, 2283 (1998). https://doi.org/10.1103/PhysRevE.57.2283Design, RF measurement, tuning, and high-power test of an X-band deflector for Soft X-ray Free Electron Lasers (SXFEL) at SINAP
. Nucl. Instrum. Methods A 930, 210-219 (2019). https://doi.org/10.1016/j.nima.2019.03.093Sub-picosecond electron bunch length measurement using coherent transition radiation at SXFEL
. Nucl. Sci. Tech. 29, 74 (2018). https://doi.org/10.1007/s41365-018-0399-8Overall comparison of subpicosecond electron beam diagnostics by the polychromator, the interferometer and the femtosecond streak camera
. Nucl. Instrum. Methods A 480, 315 (2002). https://doi.org/10.1016/S0168-9002(01)00952-4Electro-Optic Technique with Improved Time Resolution for Real-Time, Nondestructive, Single-Shot Measurements of Femtosecond Electron Bunch Profiles
. Phys. Rev. Lett. 93, 114802 (2004). https://doi.org/10.1103/PhysRevLett.93.114802Design and performance study of an improved cavity bunch length monitor based on an optimized offline test scheme
. Nucl. Instrum. Methods A 968, 163975 (2020). https://doi.org/10.1016/j.nima.2020.163975Study on the influence of beam transverse position on the cavity bunch length measurement
. J. Phys. Conf. Ser. 1350, 012153 (2019). https://doi.org/10.1088/1742-6596/1350/1/012153Dependence of bunch energy loss in cavities on beam velocity
. Phys. Rev. ST Accel. Beams 2, 032001 (1999). https://doi.org/10.1103/PhysRevSTAB.2.032001Measurement of beam loading at the SNS superconducting linac for a beam with β<1
. Nucl. Instrum. Methods A 597, 132 (2008). https://doi.org/10.1016/j.nima.2008.08.145Simulations and measurements of the dipole magnet using in the 4-MeV electron spectrometer
. J. Phys. Conf. Ser. 1144, 012108 (2018). https://doi.org/10.1088/1742-6596/1144/1/012108The development of ultrafast electron microscopy
. Crystals 10, 452 (2020). https://doi.org/10.3390/cryst10060452CST Microwave Studio, Germany
, www.cst.com, 2018.Proton linear accelerators: A theoretical and historical introduction
, Los Alamos National Laboratory Report No. LA-11601-MS, 1989.High-resolution cavity bunch arrival-time monitor for charges less than 1 pC
. Phys. Rev. Accel. Beams 26, 012803 (2023). https://doi.org/10.1103/PhysRevAccelBeams.26.012803Tsinghua Thomson scattering X-ray source
. Nucl. Instrum. Methods A 608, S70-S74 (2009). https://doi.org/10.1016/j.nima.2009.05.088Astra: A space charge tracking algorithm
.The authors declare that they have no competing interests

