INTRODUCTION
X-ray absorption fine structure (XAFS) spectroscopy is an important experimental method for synchrotron radiation facilities. It is characterized by element selectivity and local structure sensitivity, which renders it effective for investigating the local atomic and electronic structures of matter [1, 2]. Owing to the rapid development of XAFS spectroscopy in recent decades, it has been widely used in cutting-edge research fields such as energy materials, catalysis, and environmental science [3-13]. The demand for X-ray absorption spectroscopic techniques to dynamically characterize the structures of various reactions is increasing owing to the continuously increasing effort toward scientific studies [14-17]. In particular, for some chemical reaction processes, the continuous structural evolution of materials, which involves reaction conditions and times, imposes new requirements for the development of in situ experimental techniques [18-24]. Currently, owing to the XAFS scanning-time limit of 10–30 min [25, 26], in situ characterization is generally performed through an alternative “quasi-in situ” protocol, in which the external conditions are fixed at a certain position for data acquisition, followed by a change in the conditions for the next acquisition. The obtained discrete experimental data are used to predict the actual reactions. Recently, quick-scanning monochromator instruments have been successfully developed that allow rapid data acquisition in the subsecond time scale, thereby outperforming the conventional XAFS technique in terms of experimental capabilities [27-30]. The quick-scanning XAFS technique is advantageous for the real-time and dynamic monitoring of reaction processes and understanding the intrinsic mechanisms underlying catalytic reaction processes.
In this regard, a hard X-ray absorption spectroscopy beamline, BL11B, which is dedicated to conventional and quick-scanning XAFS spectroscopy, was constructed at the Shanghai Synchrotron Radiation Facility (SSRF) [31-35]. The beamline provides a wide energy range of energy (i.e., 5–30 keV) based on a bending magnet source. The construction of the beamline was completed in December 2019, and it was officially opened to users in January 2021. As of July 2023, BL11B has delivered ~6500 h to users, and more than 300 research papers have been published in different scientific fields consequently. In the following section, we describe the optical layout and characteristics of the BL11B beamline. Additionally, the versatile experimental environments and methods as well as the first commissioning results are presented.
Beamline
Light source
The SSRF is a third-generation synchrotron radiation light source composed of a 3.5 GeV electron storage ring, a full energy booster, and a 150 MeV linear accelerator [32]. The electron-beam current in top-up mode is 300 mA. A bending magnet is used as the photon source for the BL11B beamline as it offers a low thermal power density, thus reducing the thermal load of the optics and improving the beamline stability. A bending magnet can provide a wide energy spectrum, which is essential for Extended X-ray Absorption Fine Structure (EXAFS). The most important specifications of the bending magnet source and BL11B beamline are summarized in Table 1.
| Parameters of storage ring | Parameters of bending magnet | ||
|---|---|---|---|
| Storage ring current (mA) | 300 | Magnetic field intensity (T) | 1.27 |
| Electron energy (GeV) | 3.5 | Critical energy (keV) | 10.346 |
| Horizontal emittance (nm·rad) | 4.22 | Acceptance angle (mrad2) | 1.5×0.17 |
| Horizontal electron size (μm) | 72.99 | Maximum photon flux (phs/s/0.1%BW) | 1.74×10¹³@7.5 keV |
| Horizontal electron divergence (μrad) | 118.6 | Power density (W/mrad2) | 310 |
| Vertical electron size (μm) | 23.24 | Total radiant power (W) | 66.2 |
| Vertical electron divergence (μrad) | 1.947 | Coupling ratio | 1% |
Beamline optics
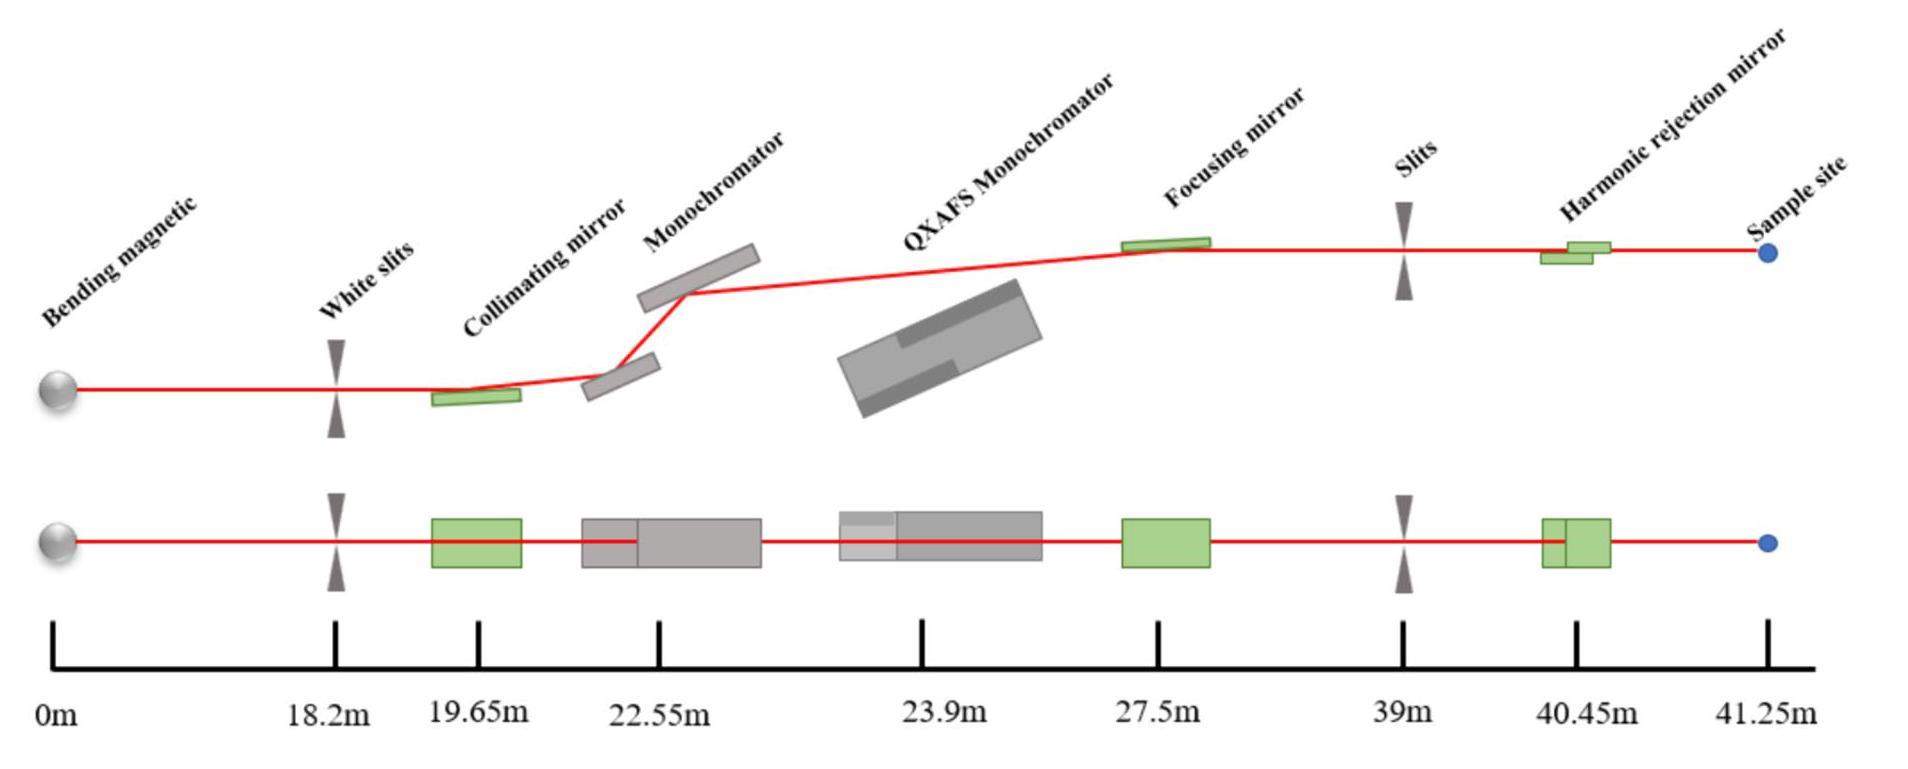
A schematic illustration of the BL11B beamline is shown in Fig. 1. A water-cooled four-blade slit is equipped at 18.2 m from the source, which controls the maximum acceptance angle of the white beam to 1.5 mrad × 0.17 mrad. The main optical elements are described as follows:
Collimating mirror
The collimating mirror is the first optical element downstream of the white-beam slit. It collimates a white beam in the vertical direction to improve the energy resolution. Additionally, it can increase the vertical acceptance of the focusing mirror to increase the X-ray flux.
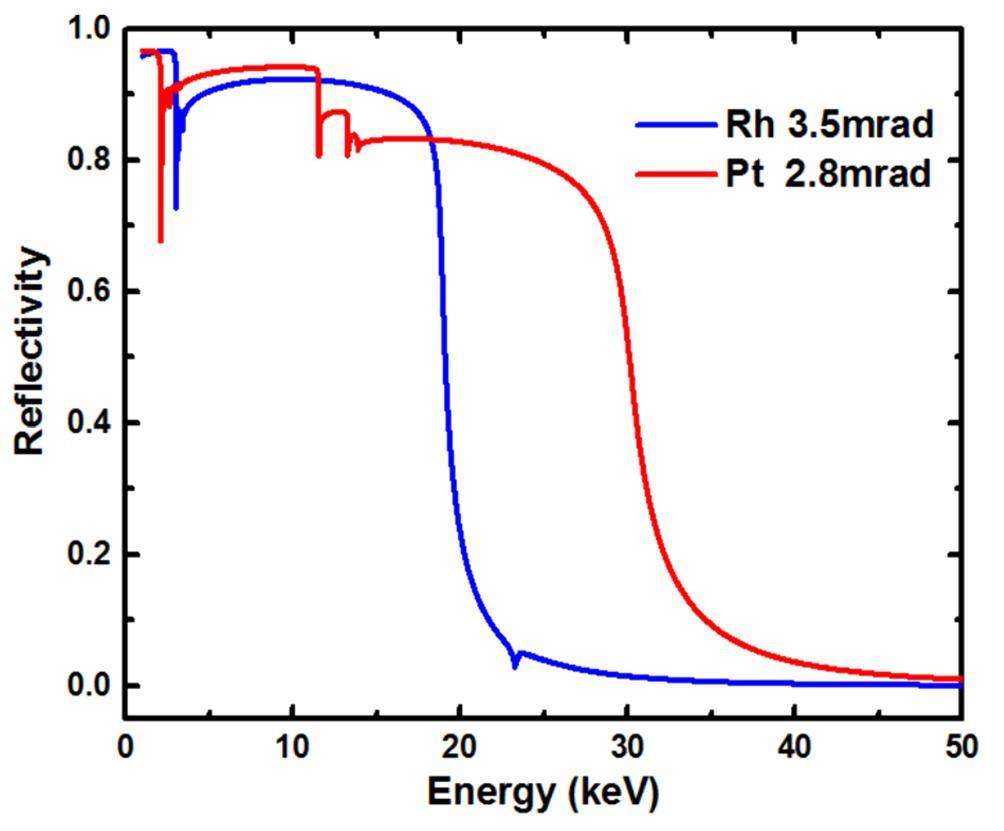
In BL11B, the collimating mirror is placed 19.65 m from the source. It is a cylindrical mirror bent from a plane mirror, whose tangential curvature radius can be adjusted via a bending mechanism. The mirror comprises a single-crystal Si substrate with Rh and Pt coatings, with each coating measuring 1000 mm (length) × 40 mm (width) and featuring incident angles of 3.5 mrad and 2.8 mrad, respectively. Owing to the two coatings, the collimating mirror affords an energy range of 5–30 keV and exhibits high reflectivity, as shown in Fig. 2. The two coatings can be switched via the horizontal translation of the mirror in the vacuum chamber. Owing to the different incident angles, the switching of the coatings will change the height of the downstream optical path. Therefore, the height of the optical elements after the collimation of the mirror must be adjusted. To reduce thermal deformation on the mirror surface, the edge of the substrate is water cooled using a copper clamp.
Monochromators
To satisfy the different experimental requirements, an independent double-crystal monochromator (DCM) system and a quick-scanning monochromator system were installed sequentially at the BL11B beamline, as shown in Fig. 3.

The DCM system is located at 22.55 m from the source and comprises two sets of flat silicon crystals, i.e., Si(111) and Si(311). Si(111) crystals are suitable for intermediate energies of 5–18 keV, whereas Si(311) crystals are used for high energies of 10–30 keV. Meanwhile, Si(311) can provide a higher energy resolution to satisfy specific experimental requirements. The two crystal sets can be easily switched via a horizontal translation mechanism outside the vacuum chamber. The monochromator is designed for bounce-up operation with a fixed-exit beam offset of 20 mm. When the Bragg angle is changed, the second crystal propagates in a cascade along the Z-direction to maintain a constant 20 mm beam offset between the exit and incoming beam. A coarse stepper motor and a fine piezoactuator are used to adjust the crystal parallelism. When the two sets of crystals must be removed from the beam path, the vertical stepper motor can be operated such that the crystals shift up and down simultaneously.
The quick-scanning monochromator system is located 23.9 m from the source. It comprises a Si(111) channel-cut crystal that can encompass an energy range of 5–26.5 keV. The rapid rotation of the crystal is afforded by a direct-drive torque motor with a small oscillatory amplitude of approximately 4°. The oscillation frequency and amplitude of the crystal can be adjusted rapidly and smoothly. The drive mechanism is mounted coaxially inside a Huber 430 goniometer. The goniometer precisely aligns the center angle of the channel-cut crystal based on the selected absorption edge, and a torque motor is used to drive the oscillatory movement of the crystal during the QXAFS operation. The maximum oscillatory frequency of the channel-cut crystal is 50 Hz, which results in a time resolution of 10 ms. In addition the QXAFS operation, we can adjust the goniometer to perform a conventional step scan. For the channel-cut crystal, the two reflection surfaces of the crystal are rigidly connected, thus resulting in high stability during EXAFS scanning. Considering the relatively low heat load of the bending magnet source, both types of monochromators are water cooled.
To satisfy the requirements of different experiments, the two sets of monochromators can be switched rapidly. When the stepping-scanning mode of the DCM is required, the channel-cut crystal should be laid flat and shifted down to remove the crystal out of the beam path. When the quick-scanning mode of the channel-cut monochromator is required, the DCM crystals are laid flat, and the crystal spacing is increased to allow the white beam to pass through them. Additionally, the attitude and height of the focusing mirror are adjusted to optimize the spot size and photon flux at the sample position. The switching process can be completed within 30 min.
Toroidal focusing mirror
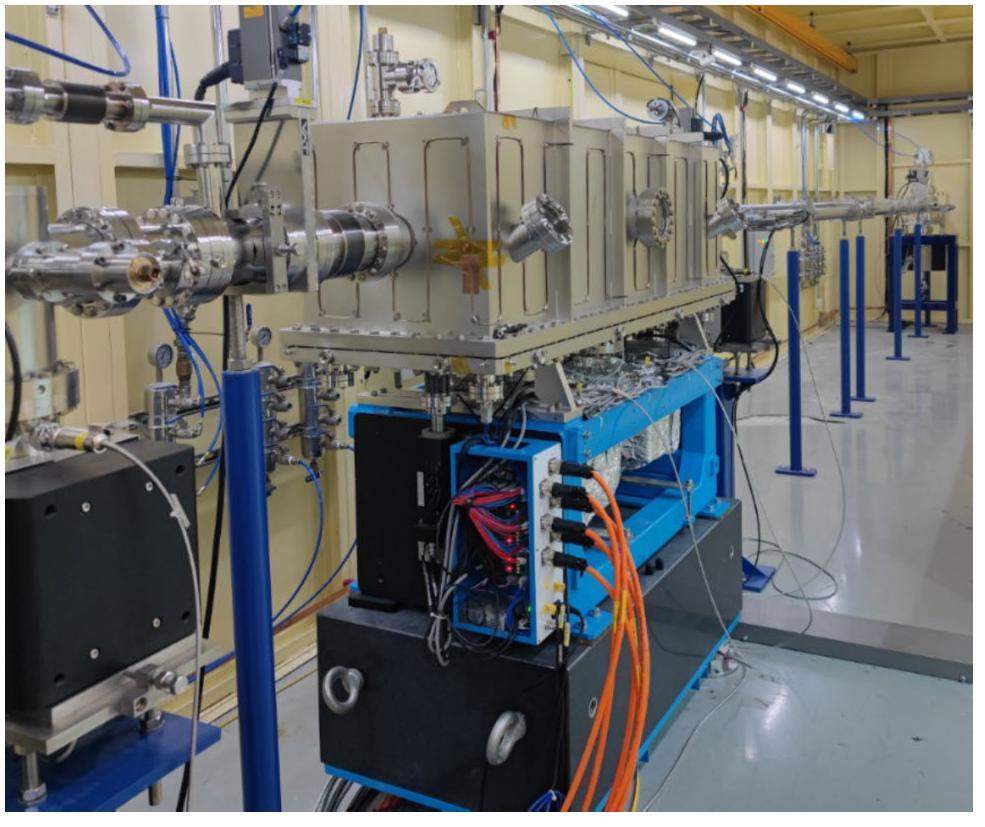
Following the monochromators, a toroidal focusing mirror that is bent from a cylindrical mirror is installed 27.5 m from the source. It focuses the parallel and divergent beams in the vertical and horizontal directions to the sample, respectively. The focusing mirror is shown in Fig. 4. Similar to the collimating mirror, it comprises two strips of cylindrical single-crystal Si substrates with Pt- and Rh-coated regions. The Pt-coated region features an incident angle of 2.8 mrad and a sagittal radius of 51.3 mm. The Rh-coated region features a grazing angle of 3.5 mrad and a sagittal radius of 64.2 mm. These two coating regions can be bent to the theoretical meridional radius, i.e., 19.6 and 7.9 km, respectively, via a stepper motor. The mirror is placed horizontally downward and 27.5 m from the source. To minimize the effect of aberration caused by the toroid focusing mirror, a horizontal focus ratio of 2:1 was implemented by placing the sample 13.75 m downstream of the focusing mirror.
Harmonics-rejection mirror
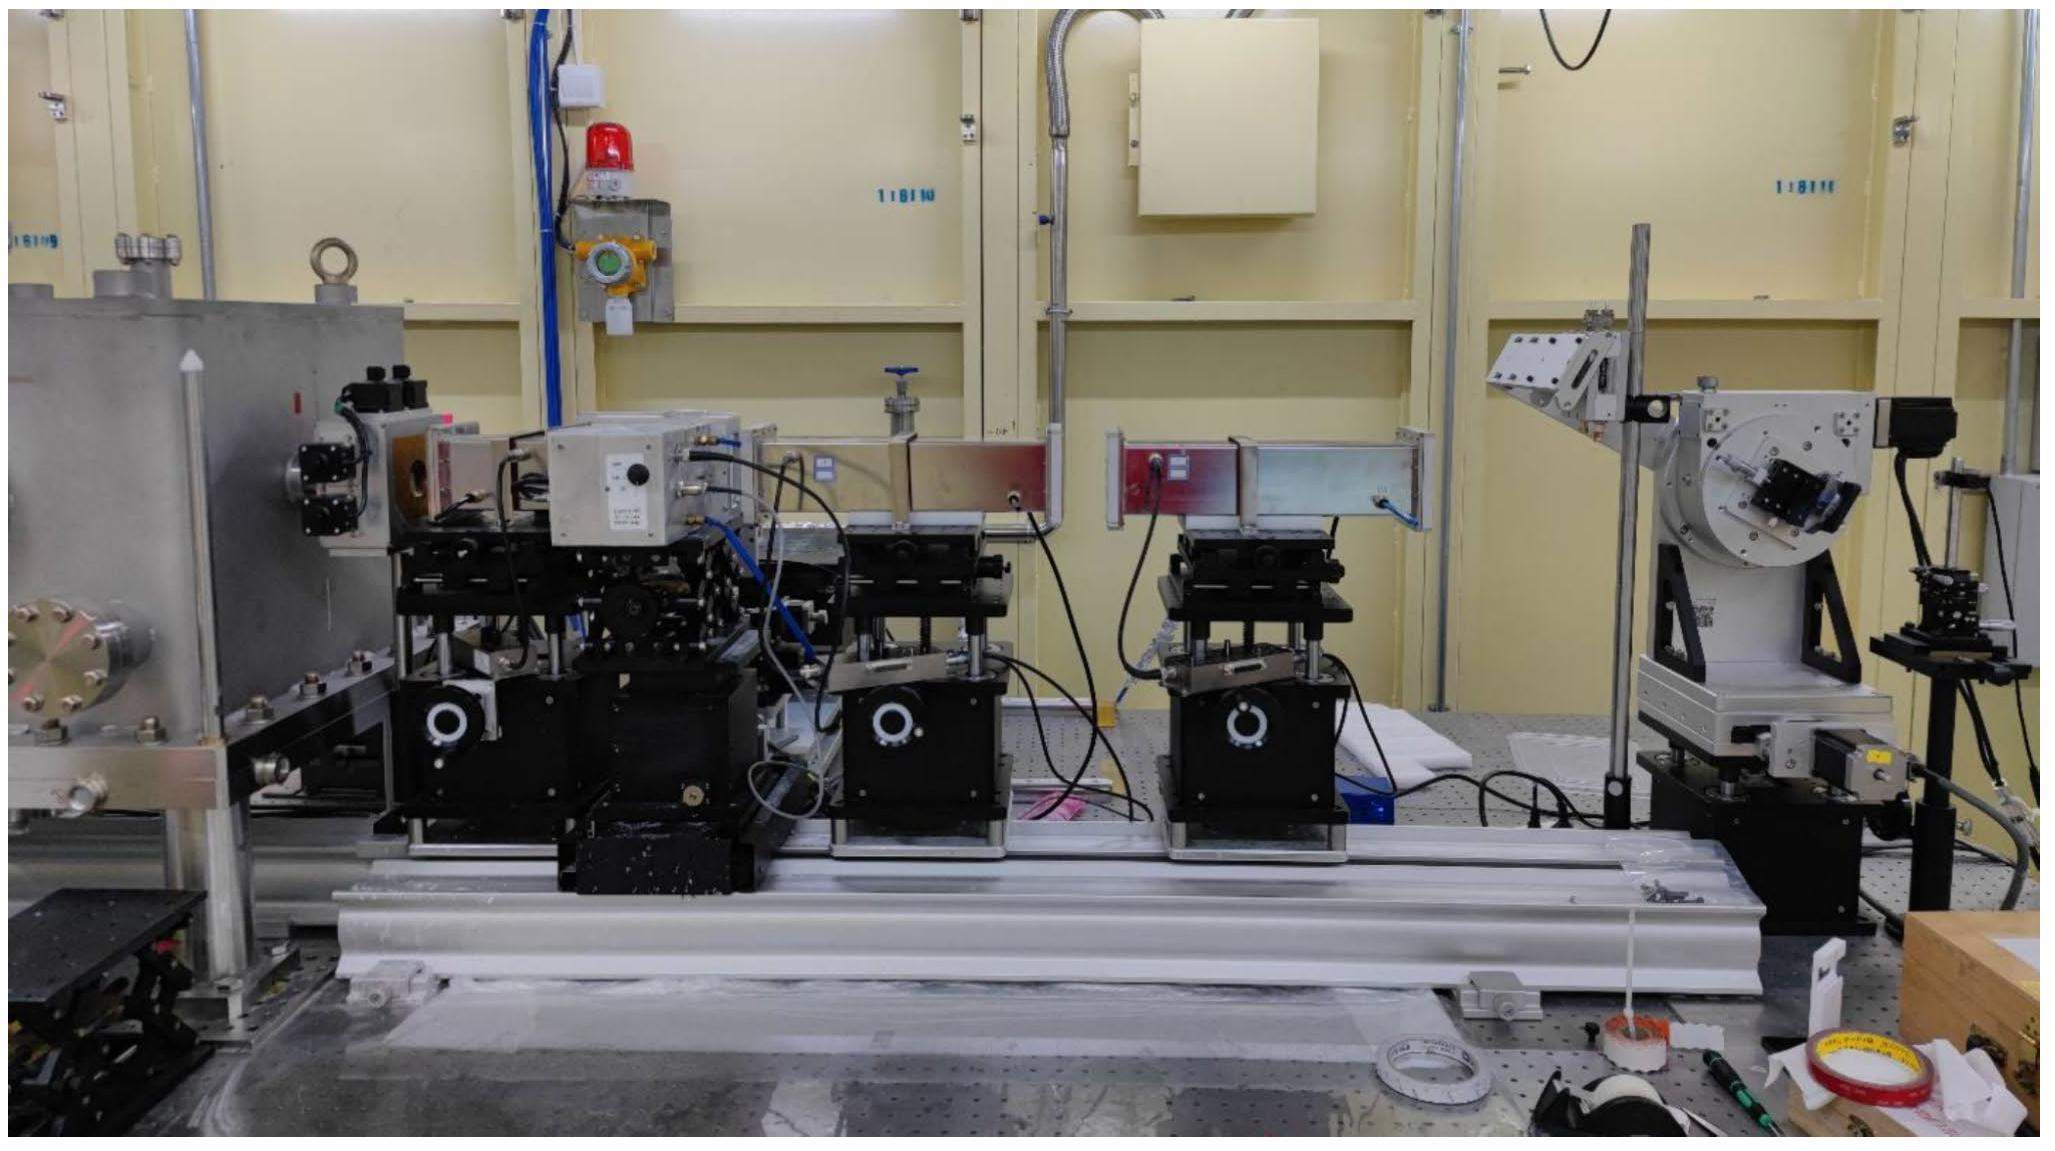
To realize high-quality XAFS experiments, a specific harmonics-rejection mirror is necessitated to suppress the high-order harmonics photons of the crystal monochromators. The harmonics-rejection mirror was placed 40.45 m from the source and on an optical table in the experimental end-station, as shown in Fig. 5. It comprised two planar mirrors placed face-to-face and parallel to each other to maintain the beam direction. Moreover, it featured three reflection regions with different coatings, i.e., Si for 5–7 keV, Cr for 6.5–11 keV, and Rh for 7.5–15 keV. For energies above 15 keV, the harmonics-rejection mirror was shifted directly out of the beam path owing to the negligible high-order harmonics. Combining the above with the collimating and focusing mirrors, the higher-harmonic contents can be reduced to less than 10-5, thus satisfying the requirement of high spectral purity for XAFS experiments.
Experimental end-station
The experimental end-station hutch was located 37.35–45.35 m from source and measured 8 m (length) × 3.5 m (width) × 3.4 m (height). Various hardware communication control cabinets, instruments, and equipment were equipped in the hutch, including optical tables, detector systems, sample stages, in situ sample cells, and other auxiliary equipment.
The experimental platform was an optical table, on which most of the instruments were placed, as shown in Fig. 5. A harmonics-rejection mirror chamber was placed on an optical table. A high-precision four-blade slit was connected to the outlet of the harmonics-rejection mirror chamber and was used to shield stray X-rays. Furthermore, it can limit the spot size of the monochromatic X-rays on the sample, depending on the experimental requirements. After the slit, detector systems and a sample stage with vertical and horizontal translations with micrometer accuracy were installed. An automatic gas-distribution system was used to deliver gas to the ionization chambers, thus achieving the optimal distribution of He, N2, Ar, and Kr gases at different energies in the ionization chambers. The automatic gas-inflation function was integrated into the data-acquisition software and operated with a single click.
Experimental methods
Transmission-mode XAFS
Transmission measurement is the basic principle of XAFS spectroscopy and is typically performed on concentrated samples (generally > 5 wt%). The setup for this measurement is shown in Fig. 6. Three parallel-plate ionization chambers are set in a straight line and the sample is placed between the first two ionization chambers, whereas a reference foil is placed between the second and third ionization chambers. This layout is useful for monitoring slight shifts in the absorption edges. Several standard foils have been measured at room temperature in this mode as reference.

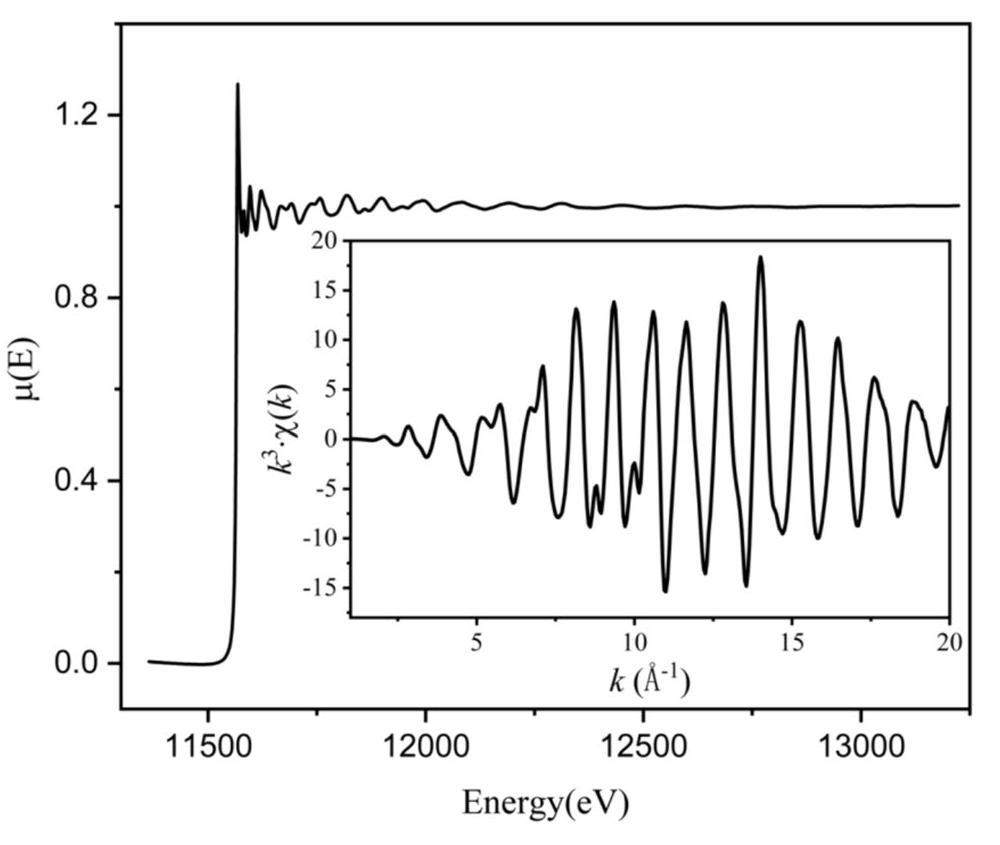
Typically, the L3 edge of the Pt foil is measured at BL11B, as shown in Fig. 7. It exhibits excellent quality with sharp absorption features and a low noise of k3·χ(k), which extends to high wavenumbers of up to 20 Å-1 (more than 1500 eV above the edge). In most studies, an energy range of 800–1000 eV above the edge is sufficient and allows all EXAFS spectrum data to be measured within 10 min.
Fluorescence-mode XAFS
For samples with low absorbing-element concentrations or those that cannot be penetrated by X-rays, fluorescence measurements are the best option. The layout for such measurements is shown in Fig. 6. A fluorescence detector is placed perpendicular to the beam path on the side of the sample. Four types of detectors for fluorescence measurement are equipped at BL11B. The most commonly used detector is the Lytle-type detector [36], which is an ionization chamber with a large detection area. The second is the PIPS detector (Mirion Technologies, Inc.), whose rapid response enables effective conventional XAFS and QXAFS measurements [37]. These detectors cannot distinguish between X-ray photons of different energies. The other two detectors include a monolithic 36-pixel high-purity germanium detector [38] (Canberra) with XIA FalconX electronics and a four-element silicon drift detector [39] (SDD, Hitachi Vortex) with Xspress3 electronics. These detectors feature high energy resolution and are optimal for measuring samples of lower concentrations.
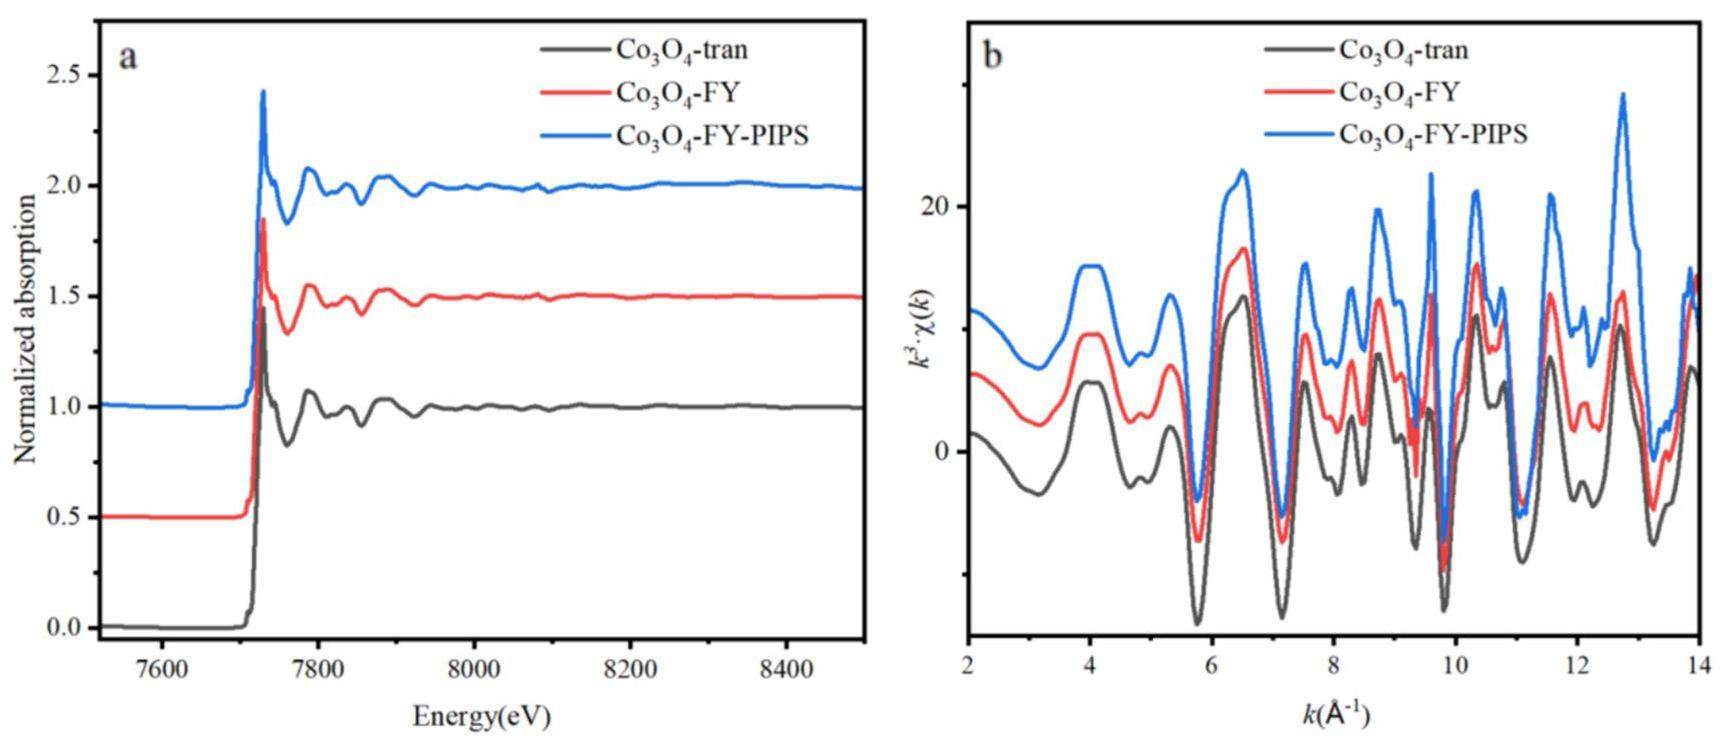
Typically, the spectra of a Co3O4 sample with a Co concentration of approximately 0.5 wt% is measured at BL11B. As shown in Fig. 8, the normalized spectra and k3·χ (k) with different detection modes and detectors are almost identical.
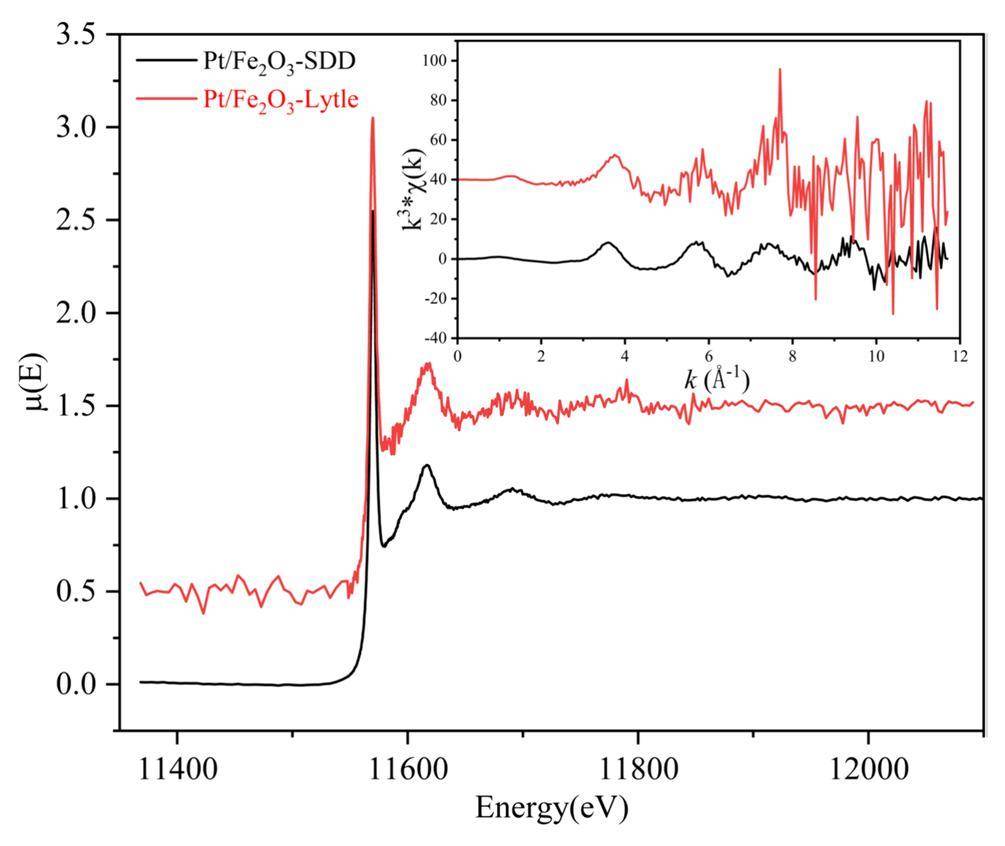
For ultralow-concentration or complex systems, the SDD is advantageous for XAFS measurements. For comparison, we measured a sample with 0.5 wt% Pt supported on Fe2O3 using Lytle and the SDD, respectively, as shown in Fig. 9. Because of the strong background fluorescence signal of Fe, the signal-to-noise ratio of the spectra acquired by the Lytle detector was unsatisfactory. By contrast, the SDD exhibited a high energy resolution and easily separated the fluorescence signal of Pt from the background. Additionally, the SDD acquired much better data quality, thus demonstrating that it can acquire high-quality absorption spectra of complex systems or ultralow-concentration systems.
QXAFS
The time-resolved XAFS technique is effective for investigating dynamic structural changes in materials during physical processes or chemical reactions [40]. The quick-scanning monochromator system is described in Sect. 2.2.2 and the data-acquisition system is described in Sect. 3.2. Both the gridded ionization chambers [41] with a fast response time (< 10 μs) and the parallel-plate ionization chambers with a slow response time (~220 μs) can be used to perform QXAFS measurements within a resolution of 100 ms to 1 s.
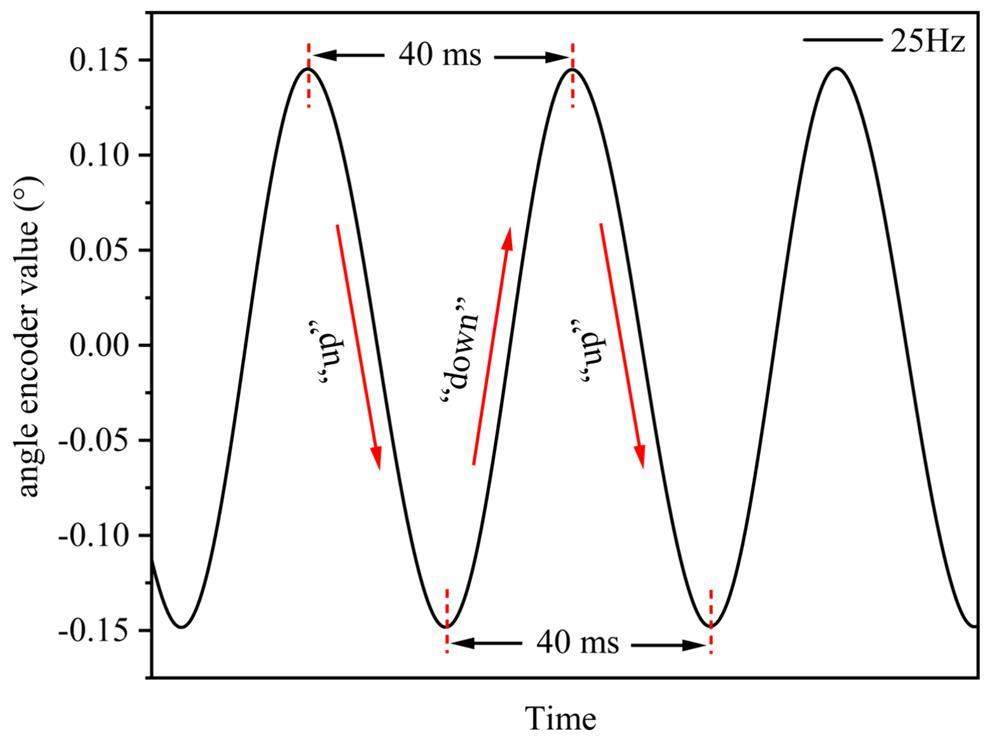
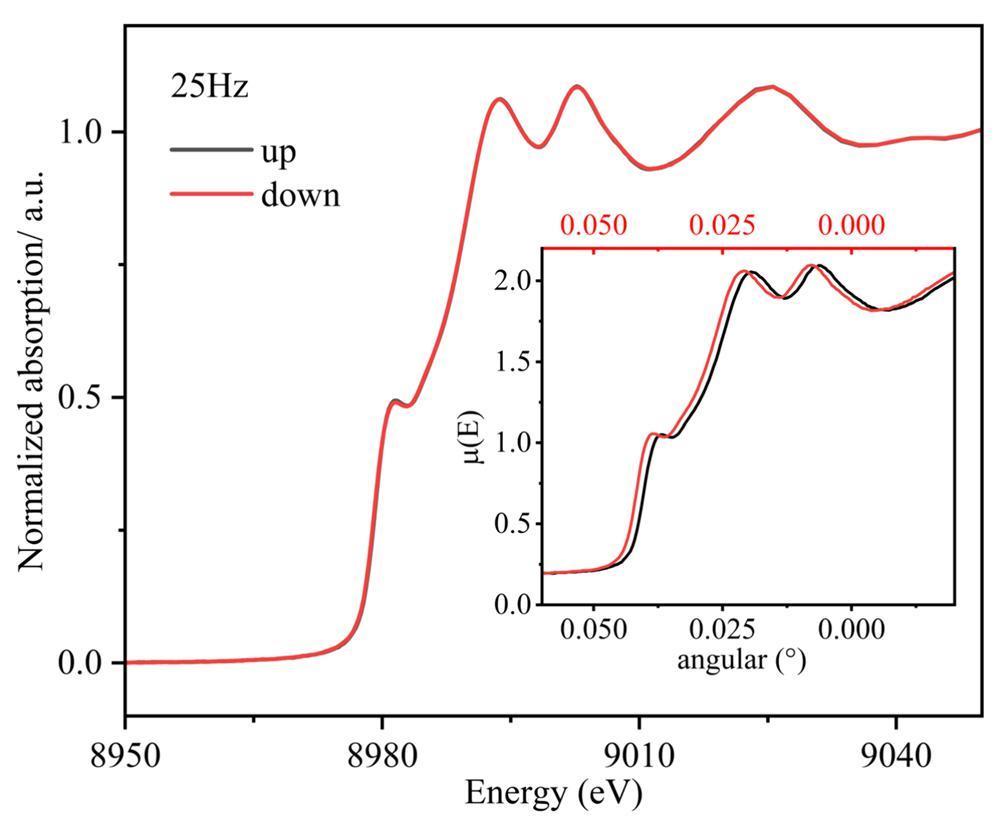
The XANES region of the Cu metal foil with an oscillation frequency of 25 Hz was measured. During the acquisition process, the angle encoder values changed over time, as shown in Fig. 10. The measured “up” and “down” spectra were identical, as shown in Fig. 11. The shoulder peak at 8981.3 eV was clearly distinguishable, thus exhibiting high energy resolution.
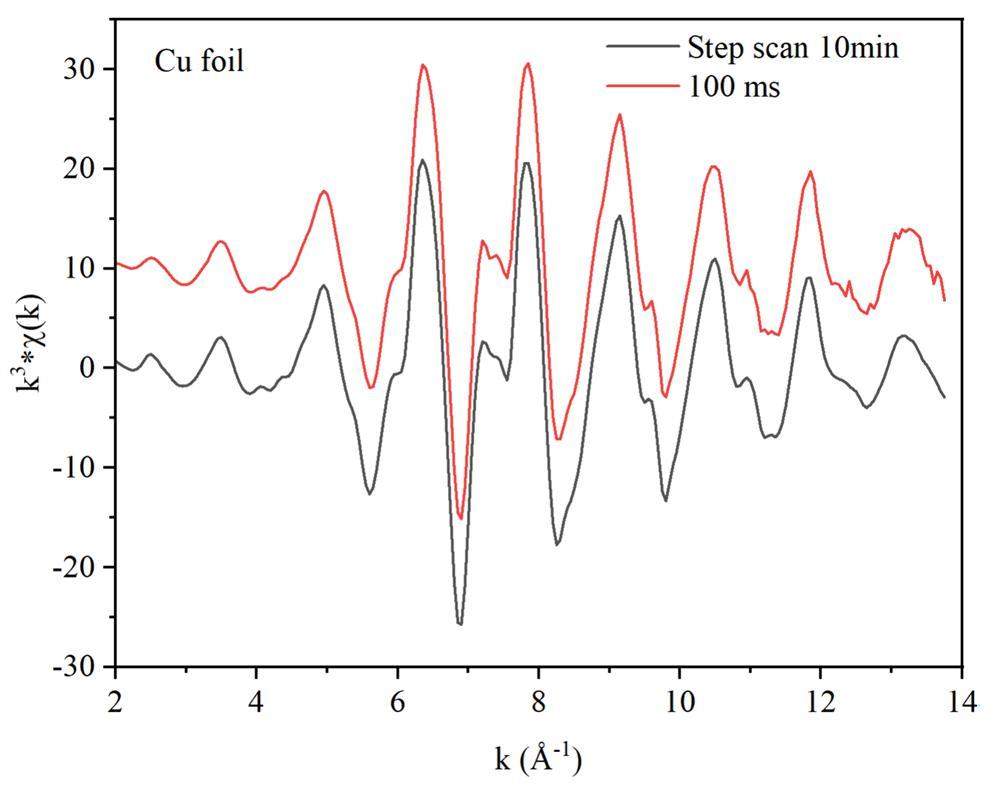
In addition, the EXAFS spectra of the Cu metal foil with an oscillation frequency of 5 Hz were measured to investigate the capabilities of the fast EXAFS measurements. We compared the k3-weighted fine structures of a single 100-ms QXAFS spectrum and the conventional 10-min step-scanning spectra, as shown in Fig. 12. The two EXAFS spectra exhibited comparable results. Although the QXAFS spectrum exhibited minimal noise in the high-k region, the data quality was sufficient for precise structure analysis. These results show that BL11B can perform time-resolved XAFS measurements on a millisecond scale.
In situ XASF sample environments
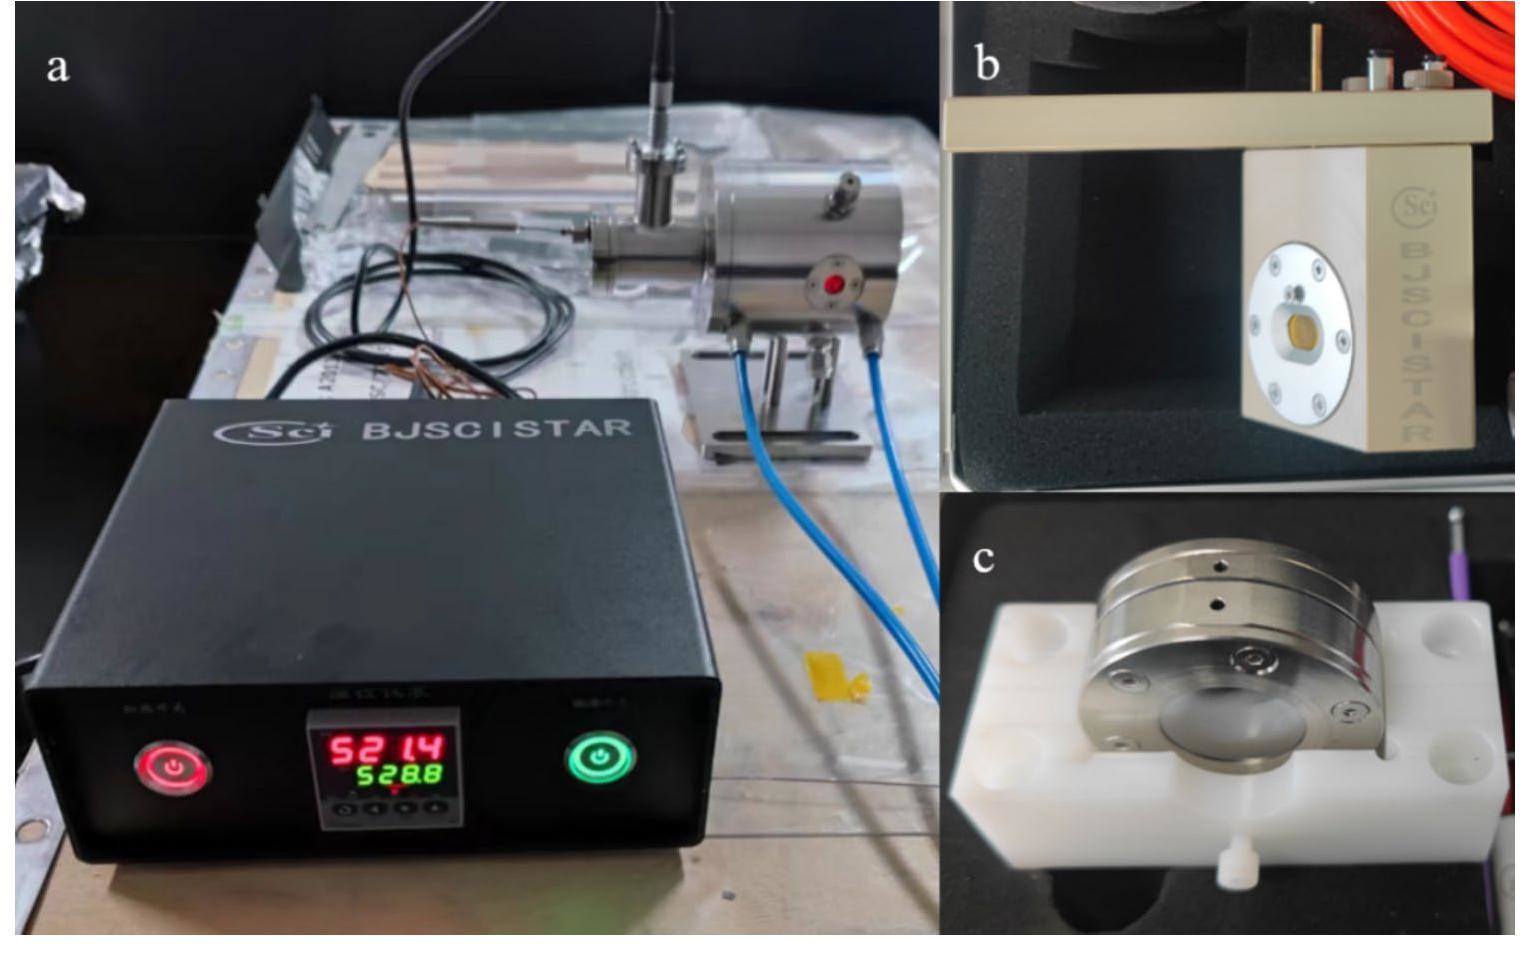
To facilitate in situ XAFS experiments at BL11B, various in situ cells have been developed, as shown in Fig. 13. They include a high-temperature in situ cell (Fig.13a), an electrochemical in situ cell (Fig.13b), and an ion battery in-situ cell (Fig.13c).
Beamline control and data-acquisition system
The control system for all the beamline stations at the SSRF uses the Experimental Physics and Industrial Control System (EPICS), which is a widely used distributed control system worldwide. All components in BL11B were controlled using control software based on the EPICS.
The motion control system of BL11B comprises an upper-layer operator interface (OPI), an input/output controller (IOC), and a local area network that connects the OPI and IOC. It uses Control System Studio, which is an Eclipse-based set of tools developed by DESY, SNS, and BNL, to design the control and display the interface of the system.
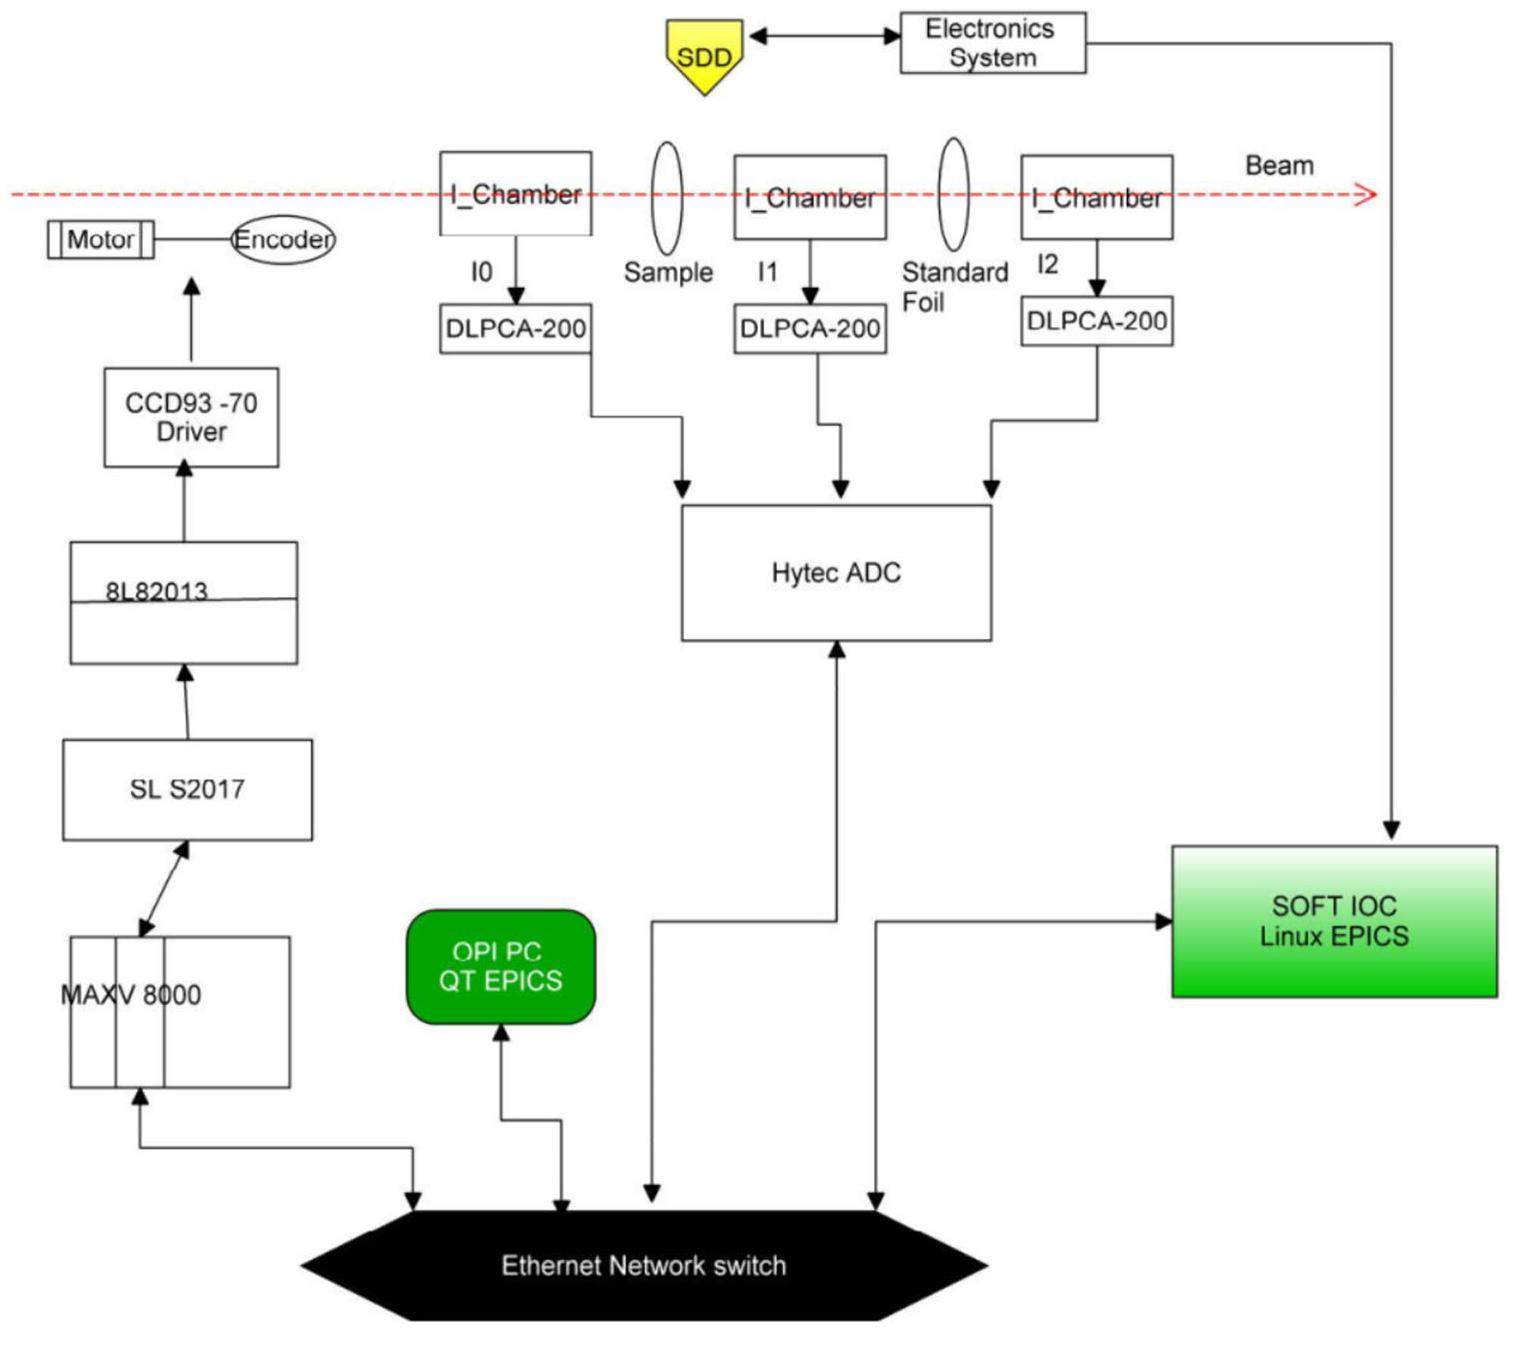
The data acquisition [43, 44] in BL11B was compiled using the QT software, which is an across-platform C++ GUI application-development framework that can be combined with the Python scripting software. It is an easily controllable model for different types of hardware and features a user-friendly graphical interface. It integrates several functions, such as automatic gas distribution, monochromator control, harmonics-rejection mirror control, detector control, and data acquisition, thus significantly improving the efficiency and reliability of XAFS measurements. Figure 14 shows a schematic illustration of the XAFS measurement system.
Beamline performance
After the installation of the optical equipment and the distribution of the control system were completed, the beamline was commissioned. The acceptance of the BL11B beamline was conducted in December 2019. The detailed commissioning results are summarized in the following subsections.
Energy resolution
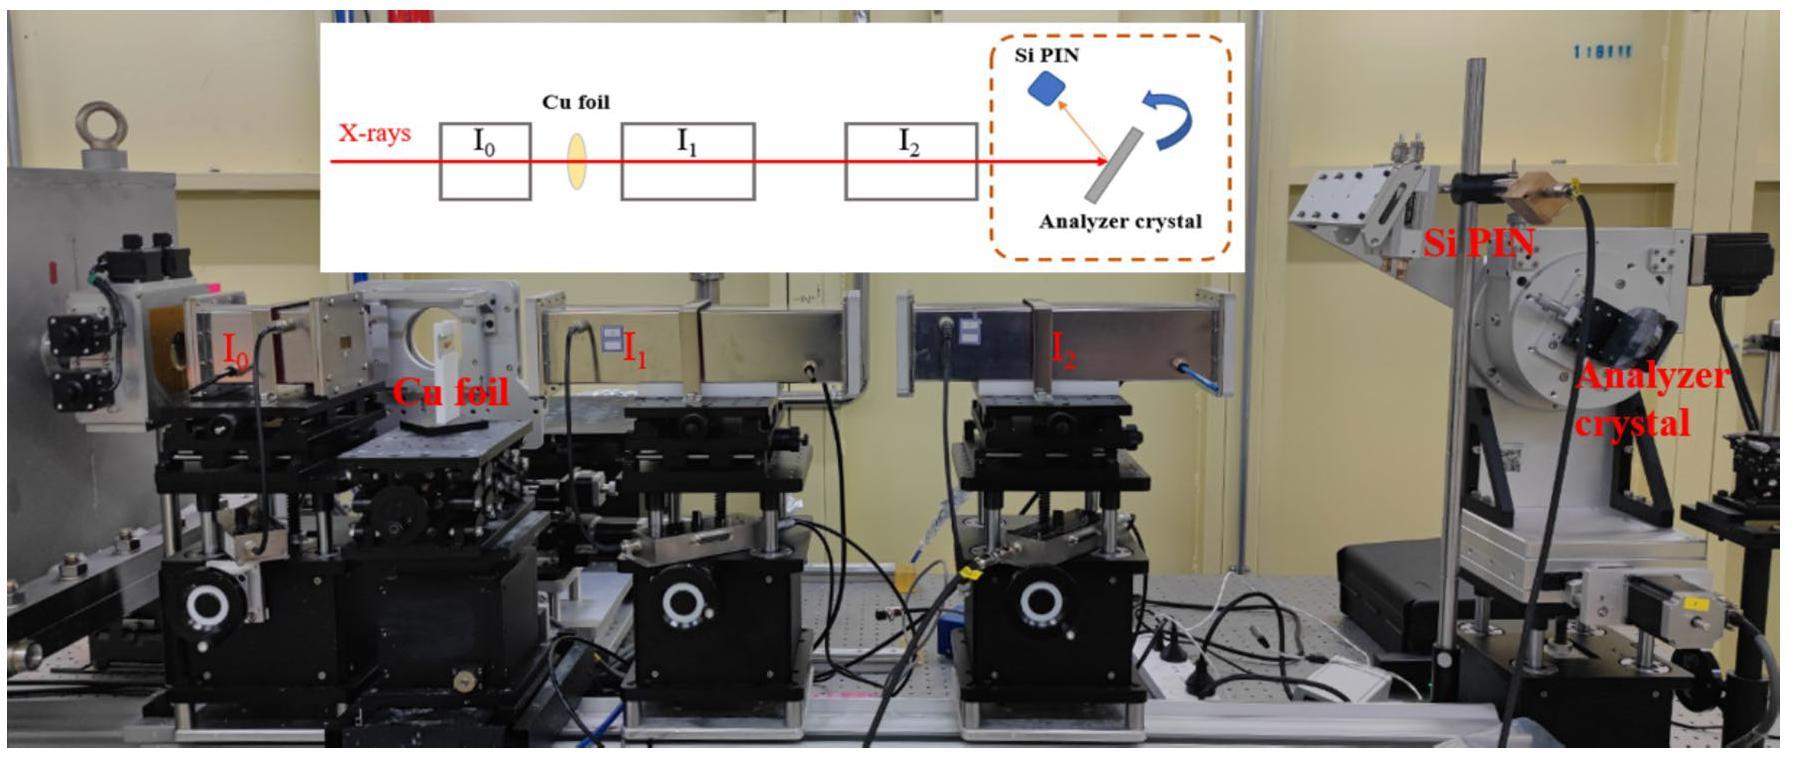
Energy resolution is the most important parameter for a spectroscopy beamline and depends on all the optical components of the beamline [45]. An energy-resolution measurement system was constructed at the BL11B experimental end-station. The system comprises a Si(111) analyzer crystal, a high-precision rotating stage, a Si PIN photodiode, and software for motion control and data acquisition. A schematic illustration of the measurement process is shown in Fig. 15. The X-rays passing through the sample and ionization chambers hit the downstream analyzer crystal and are diffracted into the Si PIN photodiode. Subsequently, the photodiode records the X-ray intensity as a function of the analyzer crystal’s Bragg angle [46].
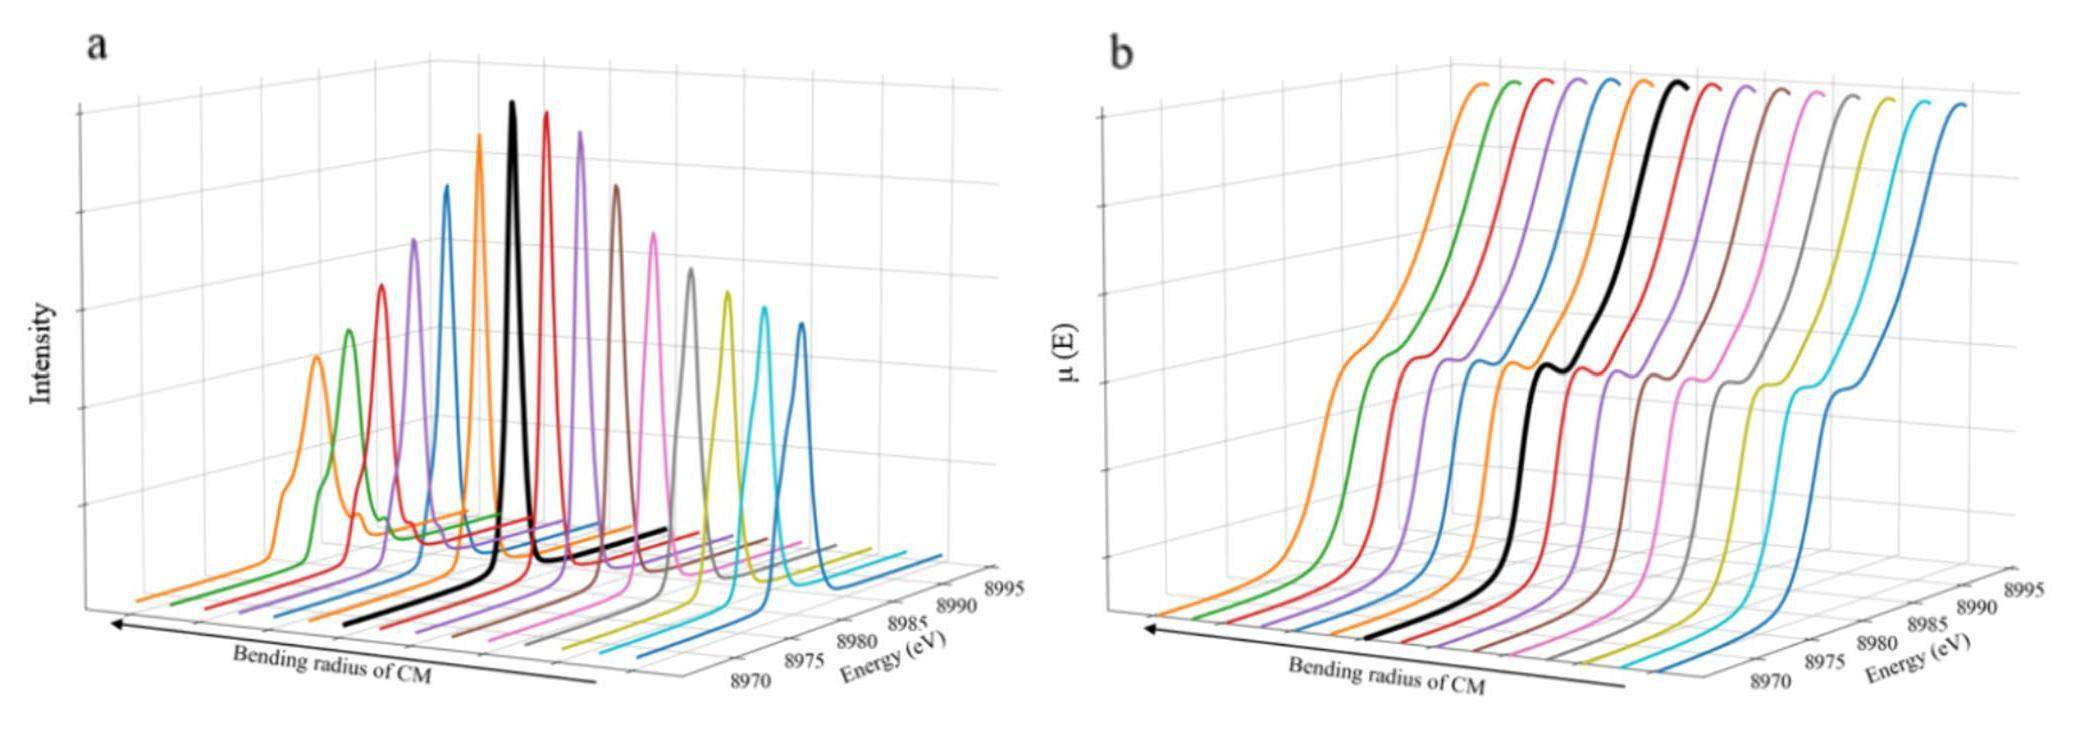
The energy resolution of the beamline is sensitive to the divergence of the incoming beam in the DCM crystal, which depends on the bending radius of the cylindrical collimating mirror. Therefore, the radius of the collimating mirror was optimized meticulously. First, we set the analyzer crystal to approximately 61.71° relative to the incident beam, which corresponds to the Bragg angle of Si(444) at 8981.3 eV. A series of different bending radii of the collimating mirror was obtained using the stepper motor. For each bending radius, we scanned the DCM from 8960 to 8990 eV and obtained I0, It, and ISiPIN values simultaneously. The XANES spectra of the Cu K-edge and the diffraction curves of the analyzer crystal with different bending radii were obtained, as shown in Fig. 16. Clearly, the height and width of the diffraction curves varied with the bending radius of the collimating mirror. When the bending radius approached the theoretical optimum, the diffraction curve exhibited the highest amplitude and the minimum full width at half maximum (FWHM), as indicated by the black line in Fig. 16a. In other words, the optimal bending radius that resulted in the highest energy resolution for the beamline was obtained. Meanwhile, the sharpest shoulder peak appeared at 8981.3 eV in the Cu K-edge XANES spectrum, as shown in Fig. 16b. This indicates that the energy resolution of BL11B satisfies the requirements of XAFS measurements.
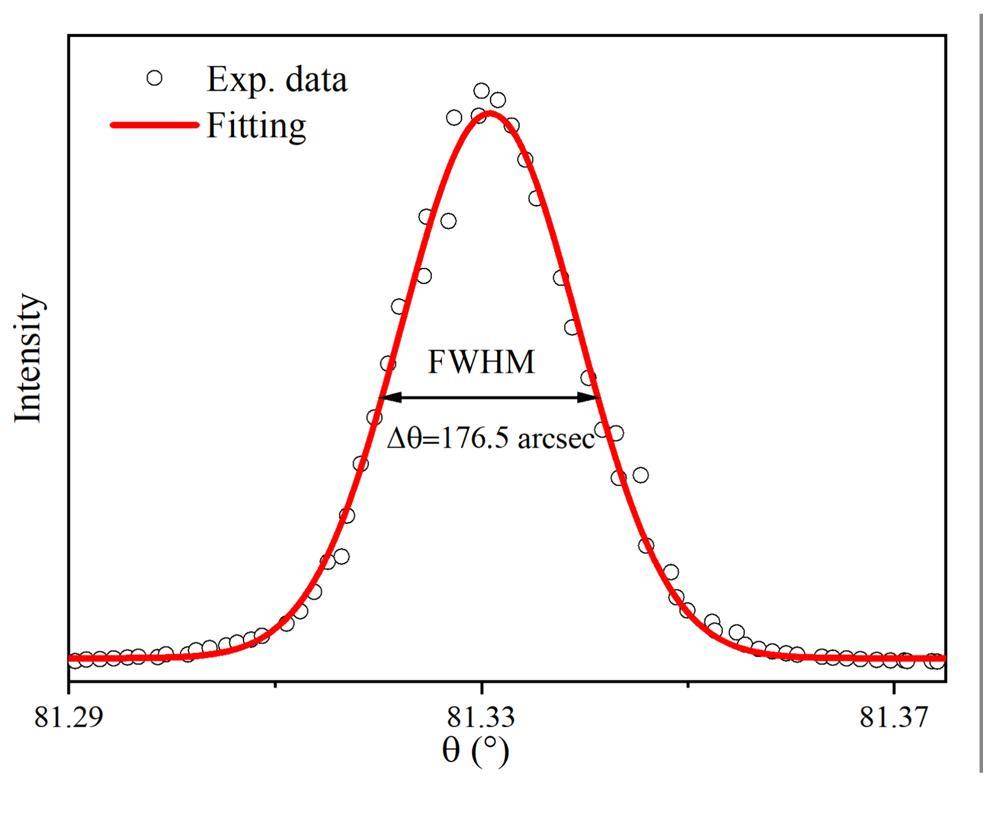
Subsequently, the beamline energy resolution was tested quantitatively. The analyzer crystal was set to approximately 81.32° relative to the incident beam, which was approximately the Bragg angle of Si(555) at 10,000 eV. We measured the rocking curve of the analyzer crystal by obtaining the ISiPIN while scanning the Bragg angle at the optimal bending radius of the collimating mirror. The rocking curve for Si(555) is shown in Fig. 17. The energy resolution can be expressed as ΔE/E = Δθ × cotθB, where θB is the Bragg angle of Si(555) at 10 keV, which is 81.32° theoretically, and Δθ is the FWHM of the rocking curve, which is 176.5 arcsec in this study. The total resolution is primarily reflected by the convolution of the beamline energy resolution, the effect of X-ray divergence, and the Darwin width of the crystal analyzer. Based on calculations, the energy resolution of the BL11B beamline exceeds 1.31 × 10⁻⁴ at 10 keV for Si(111) of the DCM.
Photon flux
Using the DCM of the Si(111) crystal, the photon flux at 10 keV was measured using a parallel-plate ionization chamber. The chamber was 15 cm long and filled with pure N2 gas at atmospheric pressure. The gain of the DLPCA-200 current amplifier used was 106 V/A. Using the Hephaestus software, the actual photon flux was calculated to be 4.98 × 10¹¹ photons/s [47].
Spot size
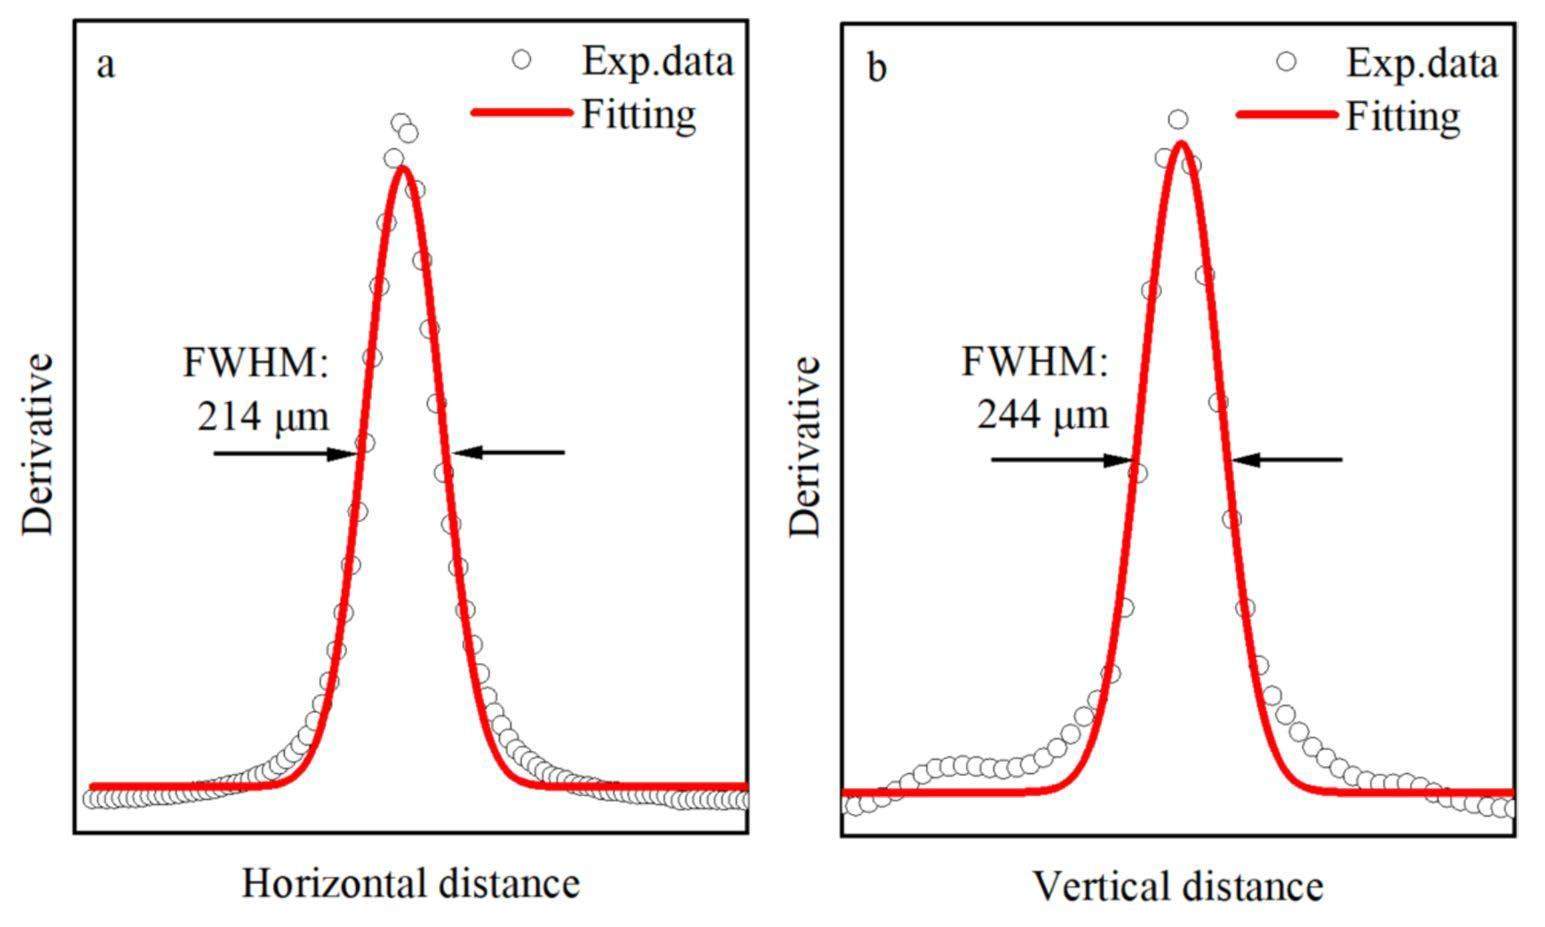
The beam-spot shape was displayed in real time using an X-ray imaging detector (X-ray FDS 6.02MP, PSEL) placed at the sample position. The detector was a SCMOS camera with a scintillator (Gadox: Tb) coupled through a fiber-optic input. Its pixel size was 4.54 μm × 4.54 μm, which was sufficient for the precise commission of the beamline optics. The spot size was measured by scanning the four-blade slits at the sample position in the vertical and horizontal directions. A parallel-plate ionization chamber was placed behind the four-blade slits, which recorded the X-ray intensity during scanning. Vertical and horizontal spot sizes were obtained by fitting the first derivative of the X-ray intensity. Figure 18 shows that the FWHM focused spot size was 214 μm (H) × 244 μm (V).
Stability
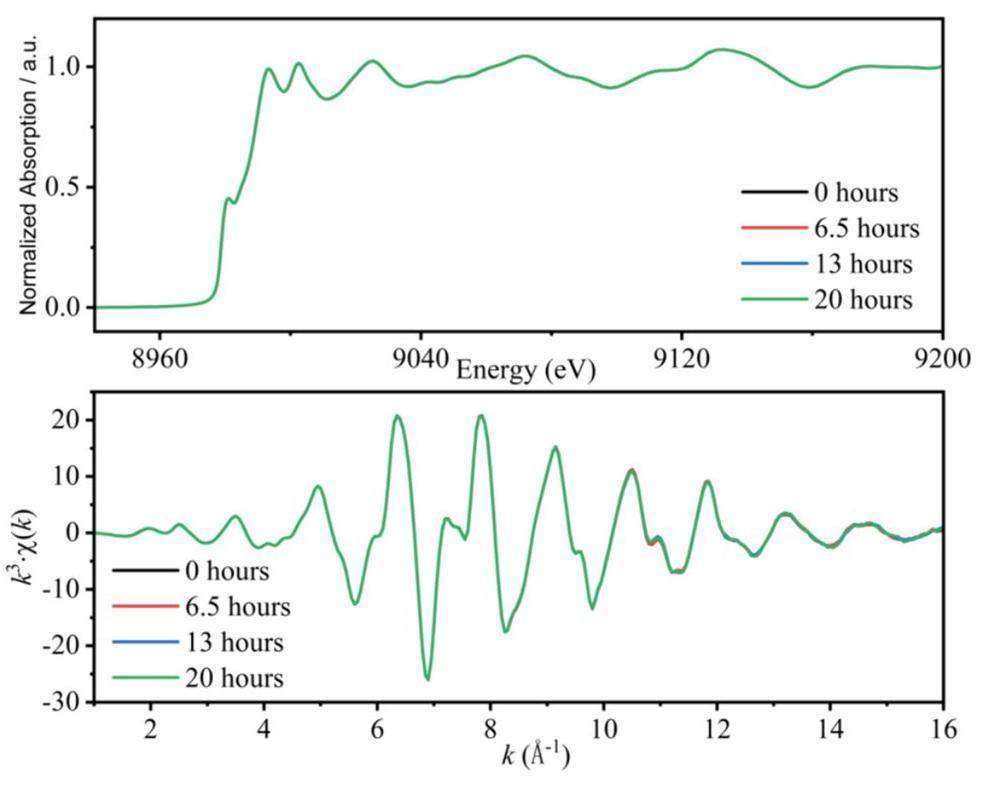
To verify the performance and stability of the beamline, continuous EXAFS was performed on the Cu metal foil for more than 130 times over 20 h, as shown in Fig. 19. All the spectra in both the E- and k-spaces were almost identical without a noticeable energy shift, thus demonstrating the excellent long-term stability and capacity of the beamline for continuous measurements over a long duration.
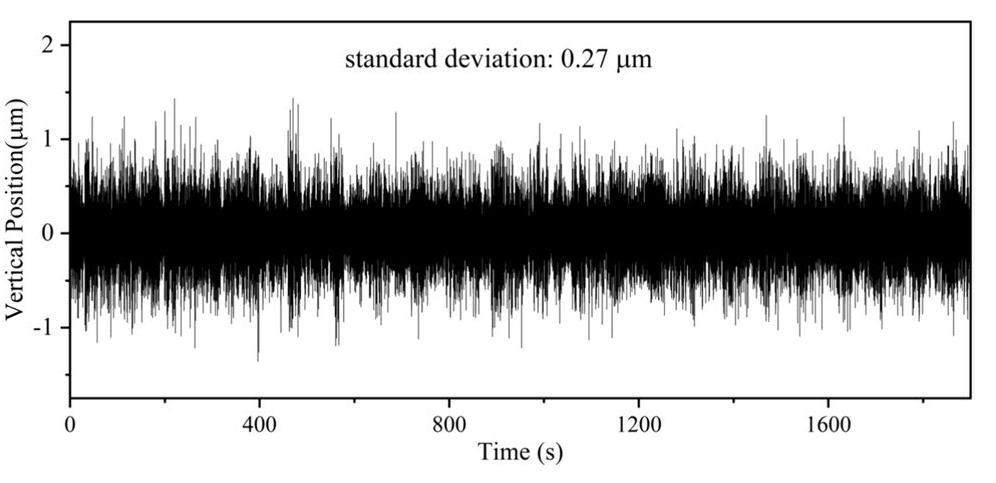
The static beam positions on the sample were monitored using a quadrant beam position monitor when using the DCM. Assuming that the change in the beam position in the horizontal direction was much smaller than that in the vertical direction, we focused on the vertical position stability over time, as shown in Fig. 20. The standard deviation was approximately 0.27 μm, which demonstrates favorable stability at the beam position.
Experimental results
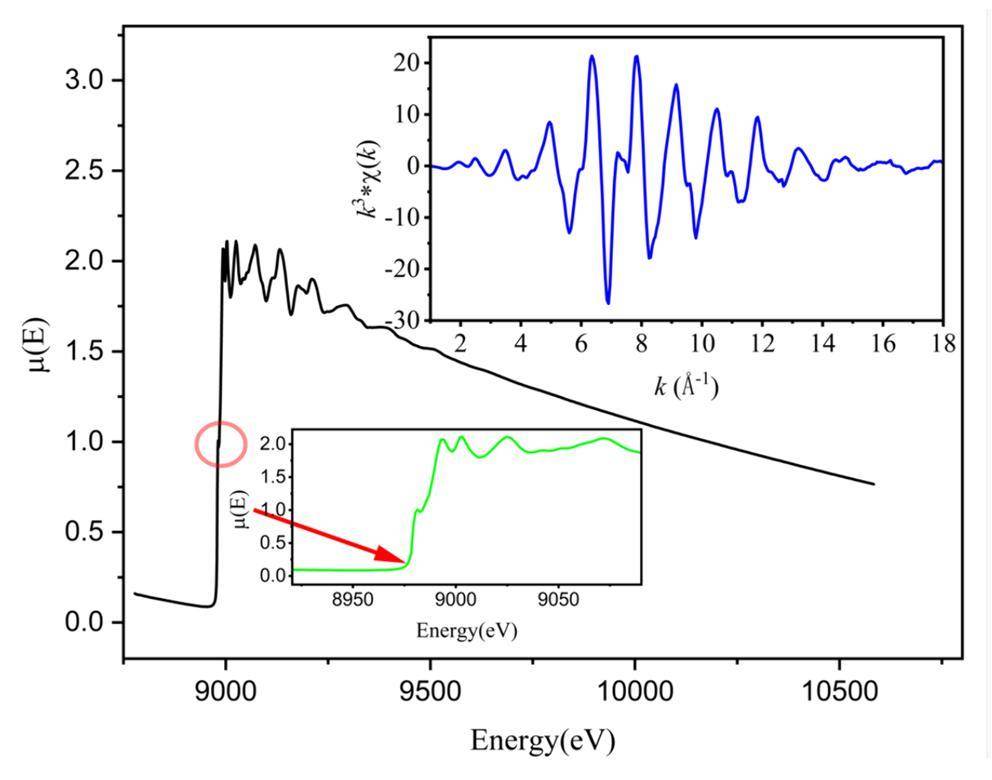
The overall performance of BL11B was first demonstrated by measuring the K-edge XAFS spectrum of the Cu metal foil in transmission mode, as shown in Fig. 21. Both the XANES spectrum with a clear shoulder peak and the k3-weighted EXAFS spectrum up to 18 Å-1 confirmed the high performance of BL11B.
Summary and conclusion
The BL11B beamline at the SSRF is dedicated to conventional and millisecond-scale QXAFS spectroscopy. The beamline is currently in operation and has been available for general user proposals since January 2021. The BL11B beamline offers a wide energy range (i.e., 5–30 keV), a submillimeter-focused spot size, high energy resolution and stability, and various types of in situ experimental equipment. Various experimental techniques have been developed, including transmission XAFS, fluorescence XAFS, QXAFS, and in situ XAFS. Consequently, more than 300 papers have been published in various scientific fields, thus demonstrating the excellent performance of the beamline. Meanwhile, new experimental techniques are being devised, including the combination of XAFS, XRD, and high-energy-resolution XAFS, which are expected to be operable by the general user community in the future. In conclusion, the BL11B beamline is an effective research platform for the fields of energy materials, catalysis, environmental science, and condensed matter physics. Furthermore, the beamline is advantageous to industrial application studies.
Extended x-ray absorption fine structure—its strengths and limitations as a structural tool
. Rev. Mod. Phys. 53, 769-806 (1981). https://doi.org/10.1103/revmodphys.53.769.Catalysts at work: From integral to spatially resolved X-ray absorption spectroscopy
. Catal. 145, 267-278 (2009). https://doi.org/10.1016/j.cattod.2008.11.002Interface-confined ferrous centers for catalytic oxidation
. Science 328, 1141-1144 (2010). https://doi.org/10.1126/science.1188267Single-atom catalysis of CO oxidation using Pt1/FeOx
. Nat. Chem. 3, 634-641 (2011). https://doi.org/10.1038/nchem.1095Reactivity of surface species in heterogeneous catalysts probed by in situ X-ray absorption techniques
. Chem. Rev. 113, 1736-1850 (2013). https://doi.org/10.1021/cr2000898X-ray absorption fine structure spectroscopy in nanomaterials
. Sci. China Mater. 58, 313-341 (2015). https://doi.org/10.1007/s40843-015-0043-4Spontaneous delithiation under operando condition triggers formation of an amorphous active layer in spinel cobalt oxides electrocatalyst toward oxygen evolution
. ACS Catal. 9, 15195 (2019). https://doi.org/10.1021/acscatal.9b00928.Recent advances in battery characterization using in situ XAFS, SAXS, XRD, and their combining techniques: From single scale to multiscale structure detection
. Exploration 4, 20230056 (2024). https://doi.org/10.1002/EXP.20230056Progress on X-ray absorption spectroscopy for the characterisation of perovskite-type oxide electrocatalysts
. Energ. Fuel. 35, 5716-5737 (2021). https://doi.org/10.1021/acs.energyfuels.1c00534The progress and outlook of metal single-atom-site catalysis
. J. Am. Chem. Soc. 144, 40 (2022). https://doi.org/10.1021/jacs.1c12642Applications of X-ray absorption fine structure spectroscopy in the photocatalytic conversion of small molecules
. ACS Catal. 13, 6690-6703 (2023). https://doi.org/10.1021/acscatal.2c06413Atomically dispersed materials: Ideal catalysts in atomic era
. Nano Res. 17, 18-38 (2024). https://doi.org/10.1007/s12274-023-5700-4Understanding heterogeneous electrocatalytic carbon dioxide reduction through operando techniques
. Nat. Catal. 1, 922-934 (2018). https://doi.org/10.1038/s41929-018-0182-6Operando insights into nanoparticle transformations during catalysis
. ACS Catal. 9, 10020-10043 (2019). https://doi.org/10.1021/acscatal.9b01831Electrochemically accessing ultrathin Co (oxy)-hydroxide nanosheets and operando identifying their active phase for the oxygen evolution reaction
. Energy Environ. Sci. 12, 739-746 (2019). https://doi.org/10.1039/C8EE03208D.Dynamically-evolved surface heterojunction in iridium nanocrystals boosting acidic oxygen evolution and overall water splitting
. J. Energy Chem. 78, 374-380 (2023). https://doi.org/10.1016/j.jechem.2022.12.032.Identification of highly active Fe sites in (Ni,Fe)OOH for electrocatalytic water splitting
. J. Am. Chem. Soc. 137, 1305-1313 (2015). https://doi.org/10.1021/ja511559dTracking the role of defect types in Co3O4 structural evolution and active motifs during oxygen evolution reaction
. J. Am. Chem. Soc. 145, 2271-2281 (2023). https://doi.org/10.1021/jacs.2c10515In-situ spectroscopic observation of dynamic-coupling oxygen on atomically dispersed iridium electrocatalyst for acidic water oxidation
. Nat. Commun. 12, 6118 (2021). https://doi.org/10.1038/s41467-021-26416-3Non-covalent ligand-oxide interaction promotes oxygen evolution
. Nat. Commun. 14, 997 (2023). https://doi.org/10.1038/s41467-023-36718-3Active and conductive layer stacked superlattices for highly selective CO2 electroreduction
. Nat. Commun. 13, 2039 (2022). https://doi.org/10.1038/s41467-022-29699-2Matching the kinetics of natural enzymes with a single-atom iron nanozyme
. Nat. Catal. 4, 407-417 (2021). https://doi.org/10.1038/s41929-021-00609-xIn Situ X-ray Absorption Spectroscopy Studies of Nanoscale Electrocatalysts
. Nano-Micro Lett. 11, 47 (2019). https://doi.org/10.1007/s40820-019-0277-xThe 1W1B-XAFS beamline at BSRF
. AIP Conf. Proc. 879, 856-859 (2007). https://doi.org/10.1063/1.2436195The XAFS beamline of SSRF
. Nucl. Sci. Tech. 26, 050102 (2015). https://doi.org/10.13538/j.1001-8042/nst.26.050102Quick-EXAFS setup at the SuperXAS beamline for in situ X-ray absorption spectroscopy with 10 ms time resolution
. J. Synchrotron Rad. 23, 260-266 (2016). https://doi.org/10.1107/S1600577515018007ROCK: the new Quick-EXAFS beamline at SOLEIL
. J. Phys.: Conf. Ser. 712, 012149 (2016). https://doi.org/10.1088/1742-6596/712/1/012149The quick EXAFS setup at beamline P64 at PETRA III for up to 200 spectra per second
. AIP Conf. Proc. 2054, 040008 (2019). https://doi.org/10.1063/1.5084609The new X-ray absorption fine-structure beamline with sub-second time resolution at the Taiwan Photon Source
. J. Synchrotron Rad. 28, 930-938 (2021). https://doi.org/10.1107/S1600577521001740Status of the Shanghai Synchrotron Radiation Facility
.Shanghai synchrotron radiation facility
. Chin. Sci. Bull. 54, 4171-4181 (2009). https://doi.org/10.1007/s11434-009-0689-yShadowOui: a new visual environment for X-ray optics and synchrotron beamline simulations
. J. Synchrotron Rad. 23, 1357-1367 (2016). https://doi.org/10.1107/S1600577516013837Shanghai synchrotron radiation facility
. Natl. Sci. Rew. 1, 171 (2014). https://doi.org/10.1093/nsr/nwt039Shanghai Synchrotron Radiation Facility Project Review and Its Current Status
(in Chinese). Journal of Fudan University. 62, 310-321 (2023). https://doi.org/10.15943/j.cnki.fdxb-jns.2023.03.002Measurement of soft X-ray absorption spectra with a fluorescent ion chamber detector
. Nucl. Instrum. Methods. Phys. Res. A. 226, 542-548 (1984). https://doi.org/10.1016/0168-9002(84)90077-9Fluorescence-detected quick-scanning X-ray absorption spectroscopy
. J Synchrotron Rad. 27, 681-688 (2020). https://doi.org/10.1107/S1600577520002350Nineteen-element high-purity Ge solid-state detector array for fluorescence X-ray absorption fine structure studies
. Nucl. Instrum. Methods Phys. Res. A, 403, 58-64 (1998). https://doi.org/10.1016/S0168-9002(97)00927-3Silicon drift detector – the key to new experiments
. Sci. Nat. 85, 539-543 (1998). https://doi.org/10.1007/s001140050545Gridded ionization chambers for time resolved X-ray absorption spectroscopy
. J. Phys.: Conf. Ser. 425, 092010 (2013). https://doi.org/10.1088/1742-6596/425/9/092010Quick scanning monochromator for millisecond in situ and in operando X-ray absorption spectroscopy
. Rev. Sci. Instrum. 86, 093905 (2015). https://doi.org/10.1063/1.4929866Data acquisition system of XAFS beamline experimental station based on Labview
(in Chinese). Nucl. Tech. 32, 5 (2009). https://doi.org/10.3321/j.issn:0253-3219.2009.04.002Data-collection system for high-throughput X-ray absorption fine structure measurements
. Nucl. Sci. Tech. 27, 82 (2016). https://doi.org/10.1007/s41365-016-0084-8Method for energy bandwidth measurement of synchrotron radiation focused beam
. Acta Opt. Sin. 40, 1934001 (2020). https://doi.org/10.3788/AOS202040.1934001ATHENA, ARTEMIS, HEPHAESTUS: data analysis for X-ray absorption spectroscopy using IFEFFIT
. J Synchrotron Radiat. 12, 537-541 (2005). https://doi.org/10.1107/S0909049505012719The authors declare that they have no competing interests.

