Introduction
Reducing Touschek scattering is considered one of the most effective methods for increasing beam lifetime [1]. The asynchronous electrons in the beam bunch oscillate continuously around the synchronous electrons. Using a higher harmonic cavity (HHC) helps to decrease the total voltage slope encountered by the beam bunch in the storage ring. This reduction in the voltage slope effectively minimizes the impact of the longitudinal focusing force, leading to a gentler distribution of the longitudinal charge density of the beam bunch. Furthermore, the use of a HHC does not introduce any energy spread to the beam and has a minimal impact on the brightness [2, 3]. Additionally, the introduction of more nonlinear terms in a radio-frequency (RF) system after the addition of the HHC can expand the synchronous frequency spread, which in turn can increase the Landau damping rate. This increase in damping rate effectively suppresses the instability of the coupled beam bunch [4, 5].
HHCs can be classified into two types based on their operating modes: active and passive. An active HHC relies on an external power source to provide power, whereas the cavity voltage of a passive HHC is induced by the beam itself. Currently, there are various facilities conducting operations or preliminary research in the passive mode, such as HLS-II, MAX-IV, and SSRF [5-9]. By contrast, the active mode includes facilities such as BESSY-III, PETRA-IV, and HEPS [10-14].
The mode-zero Robinson instability is a typical and well-understood instability among the proposed mechanisms [15]. In the case of bunch stretching, this instability can be excited by detuning the HHC and damped by detuning the main cavities (MCs) [16]. A method for analyzing the interaction between the beam and cavity using a phasor diagram was proposed and developed. This method demonstrated various voltage and current vectors in an equivalent-circuit model of a cavity. Building on this, Pedersen introduced a small-signal feedback loop model that considered cavity amplitude and phase modulation, as well as cavity tuning. The signals transmitted by this model all change in various physical parameters using the amplitude and phase of the cavity voltage as a medium. By incorporating the transmitter and beam current changes through the signal transmission function, classical control theory was applied to explain the mode-zero Robinson instability [17, 18]. This study extended the original Pedersen model by including an HHC, which was connected to the existing system through a beam as a medium. In this mathematical model, the system stability margin is observed from a signal analysis perspective, which allows for convenient adjustment and observation of the effect of the feedback loop on the double RF system. In addition to the commonly used automatic voltage control loop (AVC) and phase-lock loop (PLL), direct RF feedback (DRFB) directly feeds the cavity RF signal back to the cavity after amplification, resulting in an increased cavity bandwidth and reduced impedance, as perceived by the beam [19].
Drawing on the preceding explanation, the instability of the double RF system can be analyzed by employing the extended Pedersen model. Numerous studies have provided evidence that this instability aligns with the mode-zero instability examined from a beam dynamics perspective. Consequently, it becomes feasible to scrutinize the influence of various parameters on the system stability, including the loading angle of the MC, the detuning frequency in the passive superconducting harmonic cavity (PSHC), the loading angle and coupling coefficient in the active superconducting harmonic cavity (ASHC), and diverse feedback loop parameters.
The remainder of this paper is organized as follows. Section 2 presents the process of obtaining the phasor diagram from the equivalent circuit model of the cavity, derives the extended Pedersen model, and provides the gain and transfer function (TF) within the model. Section 3 discusses the impact of operating the PSHC on the system stability under beam-cavity interactions. This section presents the conclusions drawn from the instability analysis using beam dynamics and a comparative analysis with the model analysis to ensure the accuracy of the model [20]. Section 4 examines the addition of DRFB to the system, with a focus on studying the low-level RF control system (LLRF), that is, the impact of the amplitude (AVC) and phase (PLL) modulation loops on the stability margin of the system, using the Shanghai Synchrotron Radiation Facility (SSRF) as an example. The investigation includes analyzing the impact of each loop parameter on the system stability and discussing the relationship between the system's open-loop TF pole and loop delay. In Sect. 5, the focus is expanded from the PSHC to ASHC, prompting revisions to the Pedersen model and new suggestions for system stability. Finally, Section 6 concludes the paper and provides an outlook.
System Description and Model Establishment
In the equivalent circuit model of an RF system, the cavity can be modeled as an RLC resonant circuit [21-23]. Power transmission can be modeled as a transmission line, the power source as the current source, and the coupler as the transformer. HHCs are only excited by the beam when operating in passive mode, whereas the operation in active mode is also excited by the transmitter.
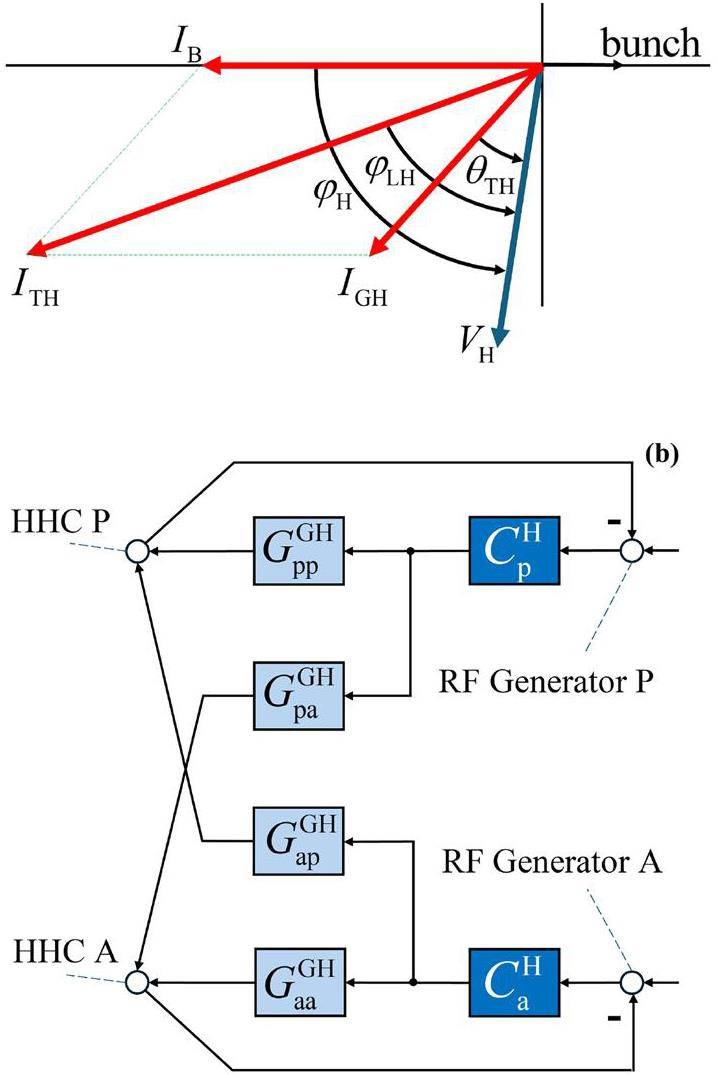
All the current and voltage amplitude phases in the equivalent circuit model are depicted in the same phasor diagram. In this section, the PSHC is illustrated as an example, whereas the ASHC is discussed in subsequent sections. A steady-state phasor diagram of the system is shown in Fig. 1. Taking the beam direction as a reference, the vectors of the MC are positioned on the upper half of the real axis, whereas those of the HHC are positioned on the lower half of the real axis. where
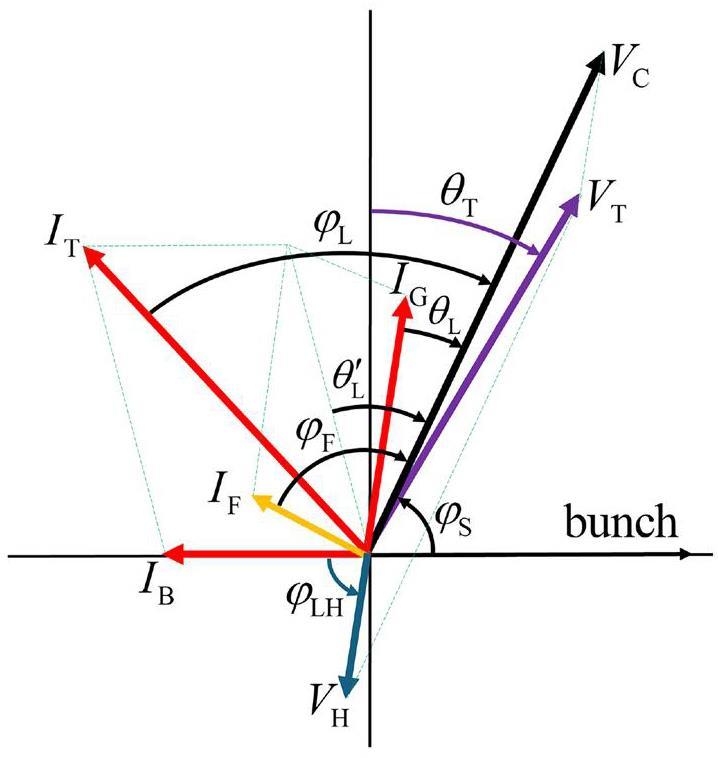
We typically use the beam loading factor
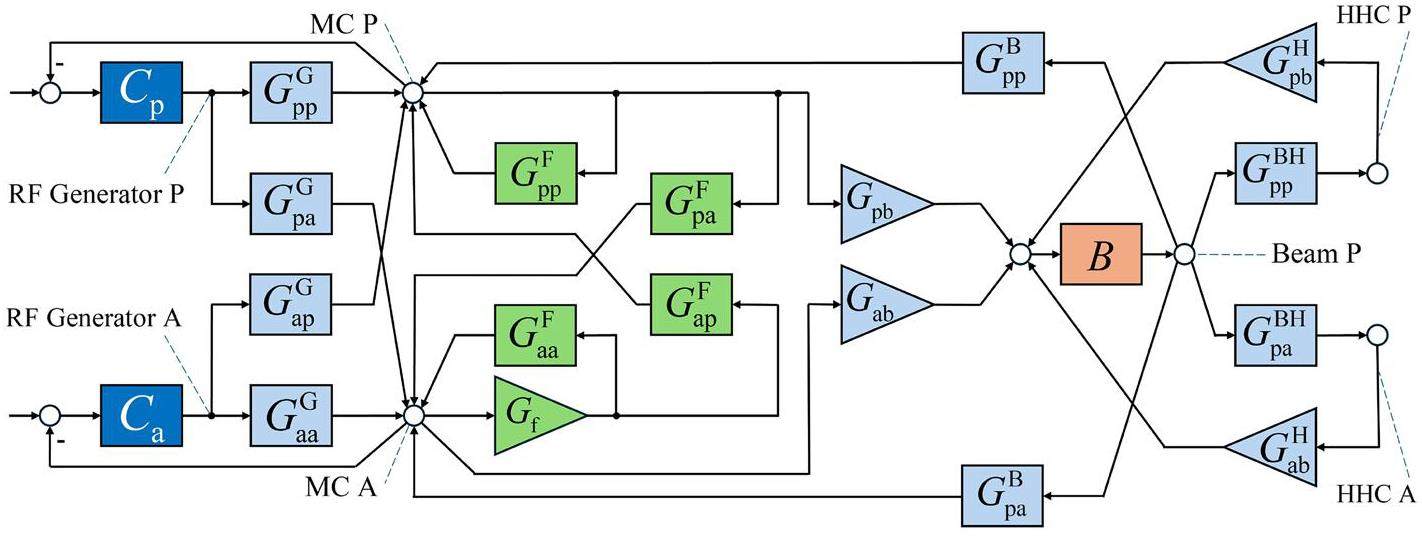
The original Pedersen model presents a TF that relates current excitation modulation to voltage signal modulation.
In general control systems, Bode plots are commonly employed as a frequency-domain stability assessment method to determine system stability. However, this method is only applicable to minimum-phase systems and does not encompass double RF systems, which are not typical control systems. If the amplitude-phase change of the signal in the MC is considered as the forward path, then the AVC, PLL, HHC, and DRFB can be viewed as part of the feedback or the entire feedback in the forward path. Consequently, the situation becomes more intricate, and the open-loop TF of the system possesses poles and zeros on the right half-plane. This complexity is reflected in Bode plot using non-monotonic phase–frequency curves. Consequently, this study adopted the Nyquist stability criterion for the stability analysis [27]:
Although the Bode plot is primarily an auxiliary tool for assessing the stability, it effectively displays the amplitude and phase response of a system on a logarithmic frequency scale. This graphical representation allows a comprehensive understanding of the system's behavior over a wide frequency range. Interpreting the relationship between the Nyquist and Bode plots can assist in fine-tuning system parameters or controller settings, resulting in improved performance within a specific frequency range.
Verification and Effection of the HHC on System Stability in Beam–Cavity Interactions
This section focuses solely on the interaction between the beam and the cavity, disregarding the impact of the external loop. The limit stable state derived from the original Pedersen model, which exclusively considers the beam–cavity interaction, aligns with mode-zero Robinson instability. Building on this concept, the system can be developed using an equation based on the Robinson instability induced by any longitudinal impedance in the beam dynamics [28, 29]:
When considering only the interaction between the beam and the double cavities, the open-loop TF of the system can be easily obtained using Eq. (10):
| Parameters | Value |
|---|---|
| Beam energy (GeV) | 2.2 |
| RF frequency (MHz) | 500 |
| Harmonic number | 800 |
| Radiation loss (keV) | 400 |
| MC voltage (MV) | 1.2 |
| Assumed beam current (mA) | 40 |
| Longitudinal damping time (ms) | 2 |
| Momentum compaction | 9.4×10⁻⁵ |
| Harmonic cavity number | 3 |
| Near-optimum HHC voltage (kV) | 375 |
| R/Q of the HHC | 39 |
| Q of the HHC | 2×10⁸ |
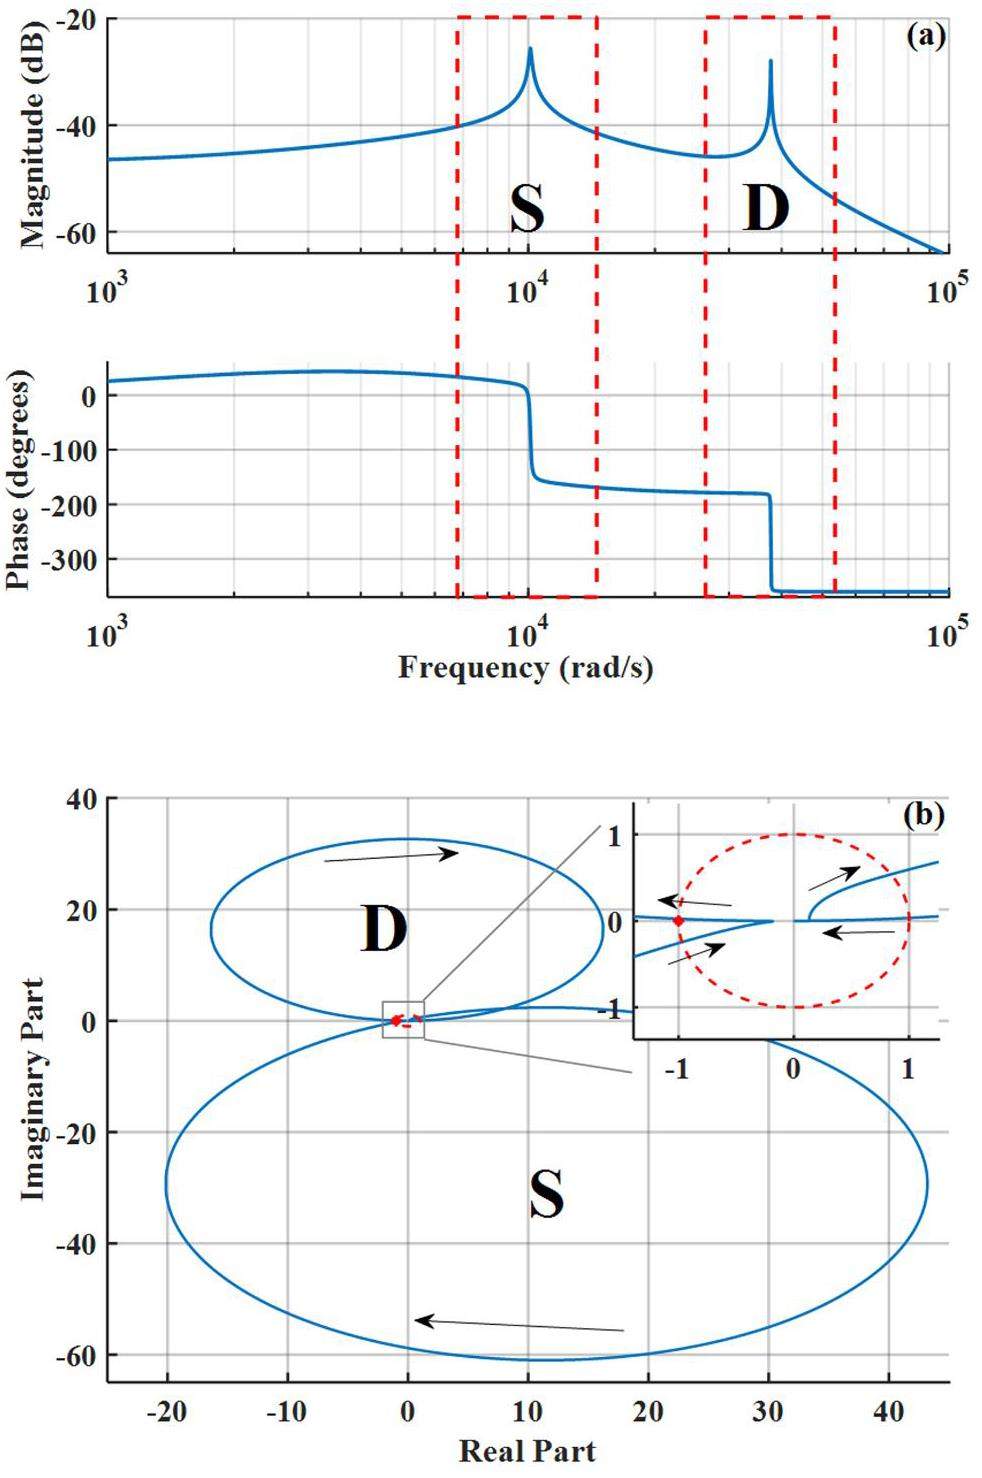
The presence of these two peaks in the Bode plot corresponds to the occurrence of two large circles in the Nyquist plot. This observation supports the conclusions of the beam dynamics analysis.
Akai et al. applied the Pedersen model to a single-cavity system and verified that the synchrotron frequency obtained from model simulations was consistent with the experimental results [33, 34], thereby confirming the model's impact on the S mode. To further validate the accuracy of the model in a double RF system, it was necessary to verify the instability of the D mode. We utilized the STABLE code to track single macroparticles per bunch for 50000 turns [30]. The STABLE code is executed in the MATLAB environment and can track the longitudinal beam dynamics for any filling pattern and passive harmonic cavity. For more detailed information, refer to [35]. The fitting yielded oscillations in the average relative momentum deviation during the exponential rise or decay phases, thereby determining the growth rate (or damping rate), which is the imaginary part of Ω. It is noteworthy that the maximum real parts of the poles from the closed-loop TF of the model system also represent the growth rate. After model testing, the extended Pedersen model's closed-loop TF poles explained the instability in both S and D modes. An effective solution is to compare the growth rate of the D mode with the real part of the system's closed-loop TF poles under the condition that the S mode exhibits a higher damping rate, where the real part of the pole is the solution with the maximum real part of the system characteristic equation 1+GH=0.
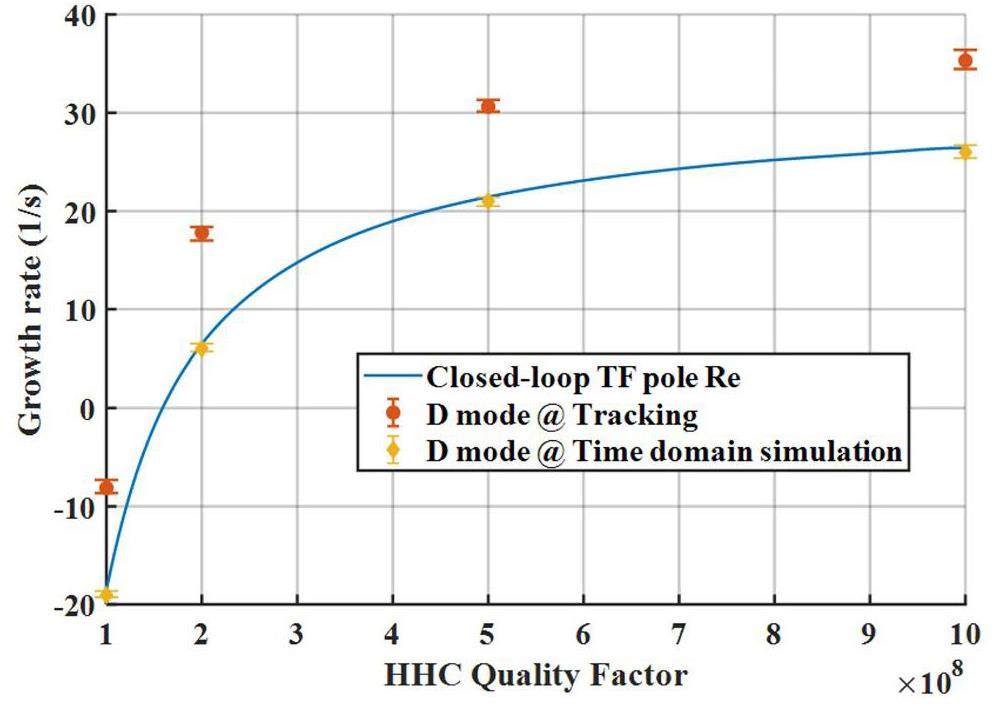
We also conducted simulations using MATLAB Simulink with parameters identical to those listed in Table 1. Figure 4 illustrates the impulse response under different quality factors of the HHC, from which the growth rate of the D mode was derived through exponential fitting of the signal envelope. Figure 5 presents a comparison of the real part of the poles derived from the characteristic equation, along with the growth rates of the D mode obtained from both the tracking simulations and time-domain simulations. However, even under identical initial conditions, the growth rates obtained using the latter two methods in different time windows may vary marginally. These variations are represented by error bars, where the points within the error bars denote the average growth rates.
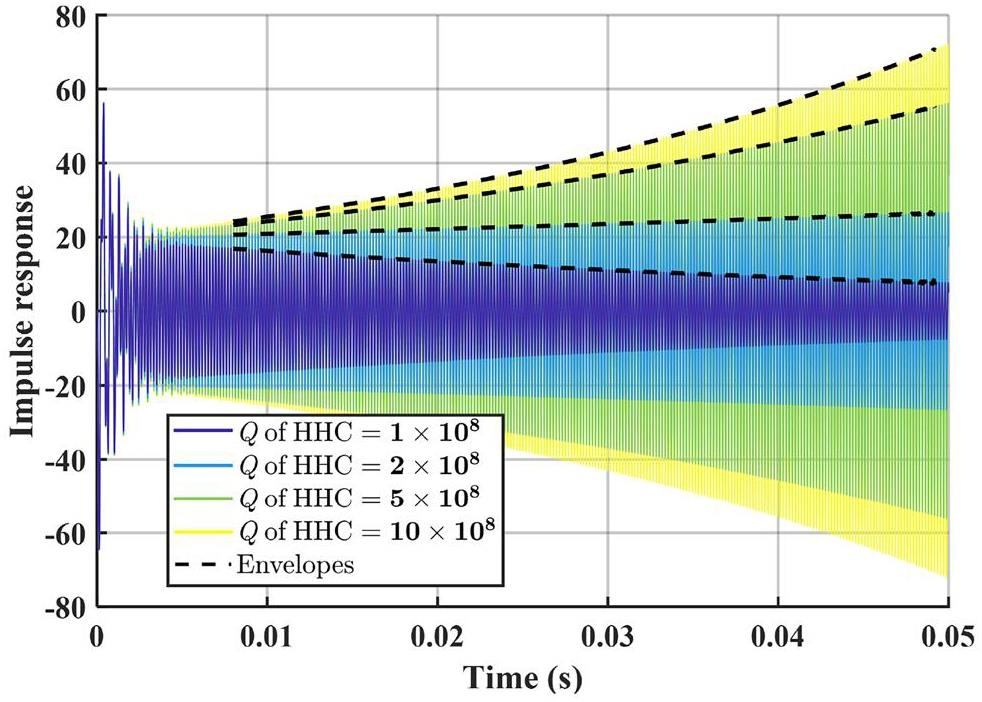
Using the same methodology, Figs. 6 and 7 present the comparative growth rates of the D mode under variations in the detuning frequency of the HHC and changes in the damping rate (1/τz), respectively.
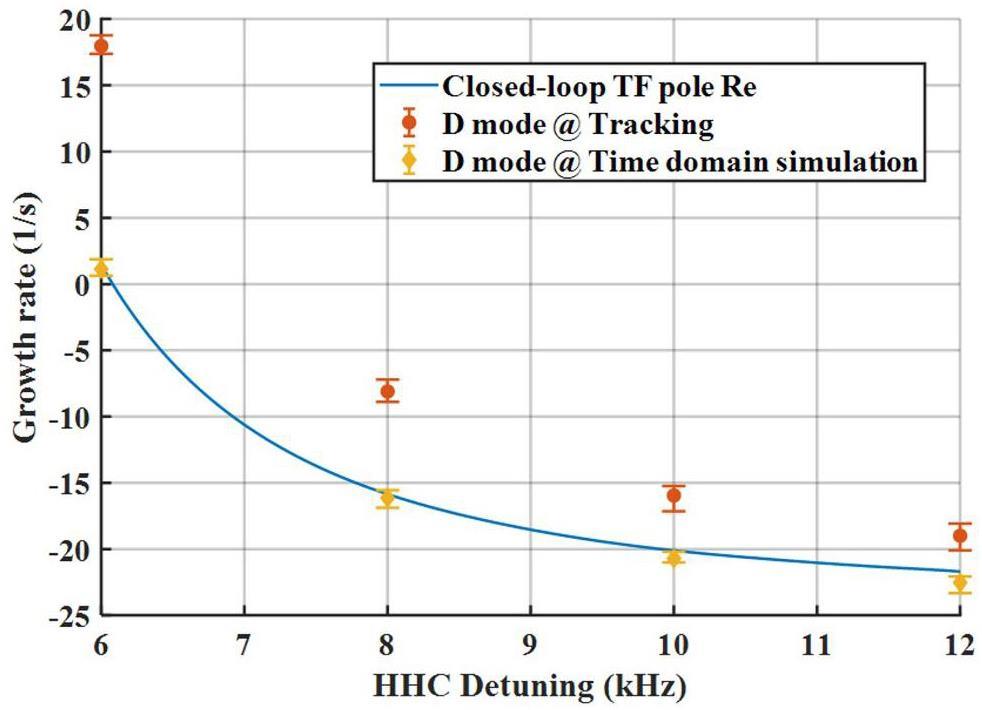
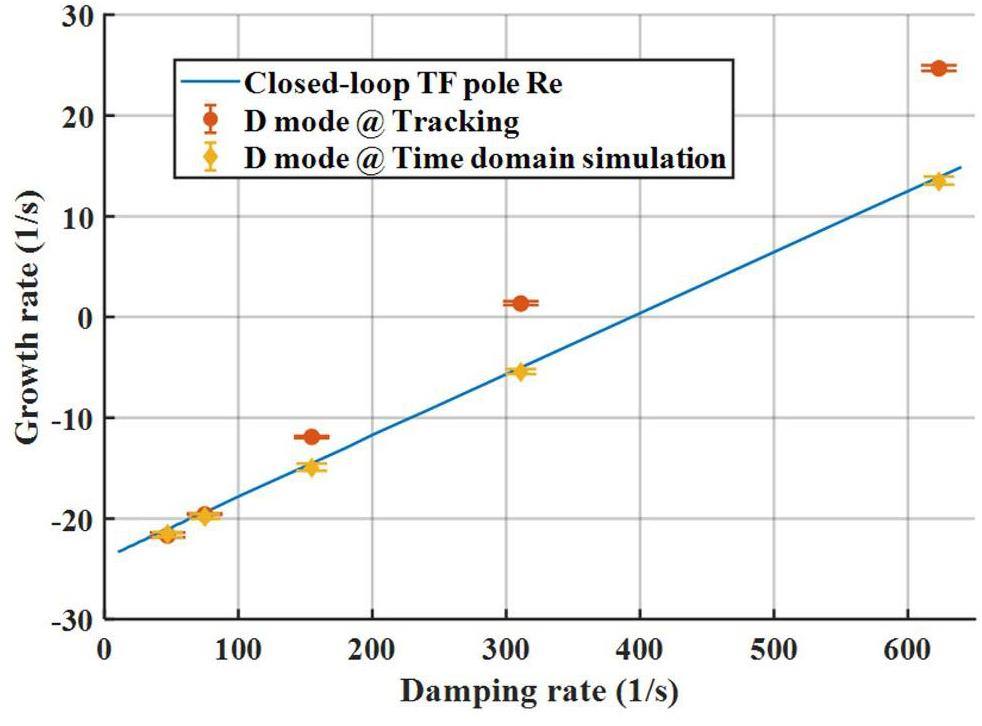
The growth rate of the D mode derived from the system characteristic equation was consistent with the results obtained from the time-domain simulations. Similarly, the results of the tracking simulation demonstrated a comparable trend in variation, albeit with larger numerical values. This indicates that the results derived from the Pedersen model are more stable than those from the tracking simulations. Besides considering that the S mode has a minor impact, the speculated reason is that the linear Pedersen model can only accurately describe the system when it is near or in a steady state, neglecting several nonlinear effects considered in the tracking simulations. Nevertheless, the advantages of quickly obtaining the system characteristics using the Pedersen model should not be overlooked.
Impact of Loop Parameter Settings on the System
This section considers the SSRF as an example, and its system parameters are listed in Table 2. The conclusions drawn from the model, combined with the experimental results, comprehensively illustrate the impact of various loop parameters on the system stability.
| Parameters | Values |
|---|---|
| Energy (GeV) | 3.5 |
| RF frequency (MHz) | 500 |
| Harmonic number | 720 |
| Radiation loss (MeV) | 1.44 |
| MC voltage (MV) | 4.5 |
| Beam current (mA) | 200 |
| HHC voltage (MV) | ~ 1.8 |
| R/Q of the HHC | 87.5 |
| Q of the HHC | 3.8×10⁸ |
| Harmonic cavity number | 3 |
| Momentum compaction factor | 4.2×10⁻⁴ |
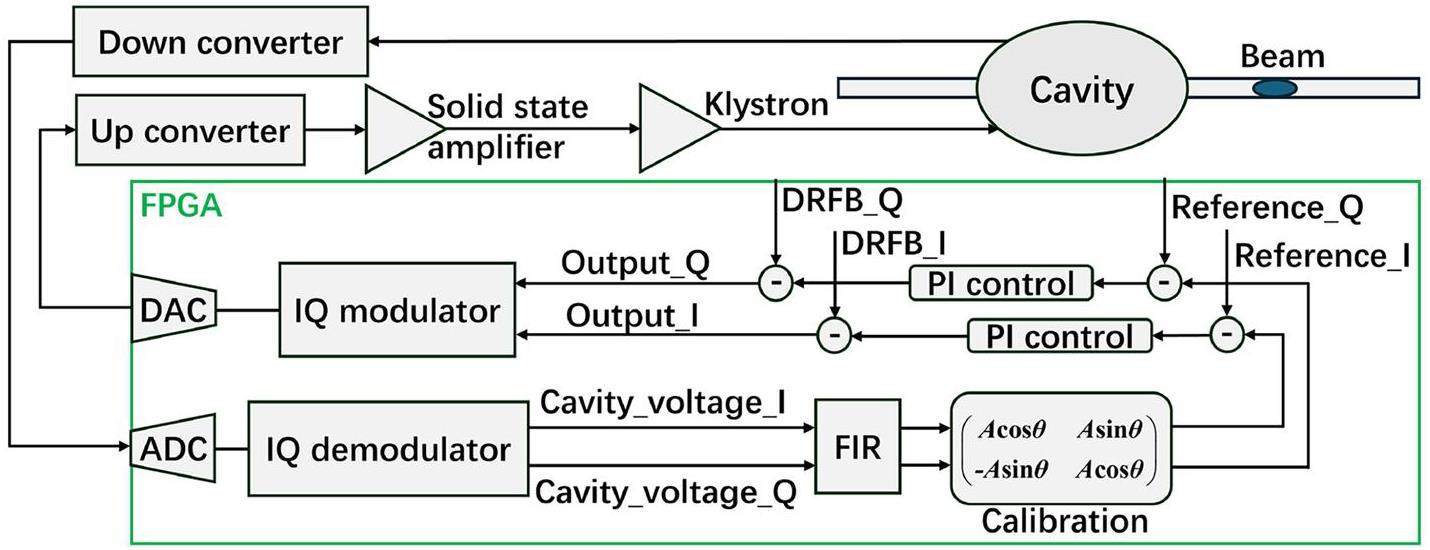
The SSRF operates a digital LLRF system controlled by an I–Q based feedback loop, as shown in Fig. 8. By adjusting the filters or loop amplifier gains to avoid beam instability and from the perspective of mode-zero stability, there is no fundamental difference between I–Q and amplitude-phase control. Further details on the amplitude and phase loops are provided in the following subsection.
DRFB
In Section 2, it is noted that the gain and offset angle of DRFB can be represented by X and φF, respectively. At this time, DRFB can be regarded as a means of changing the cavity parameters. This study considered DRFB as an outer loop connected in the middle of the forward path.
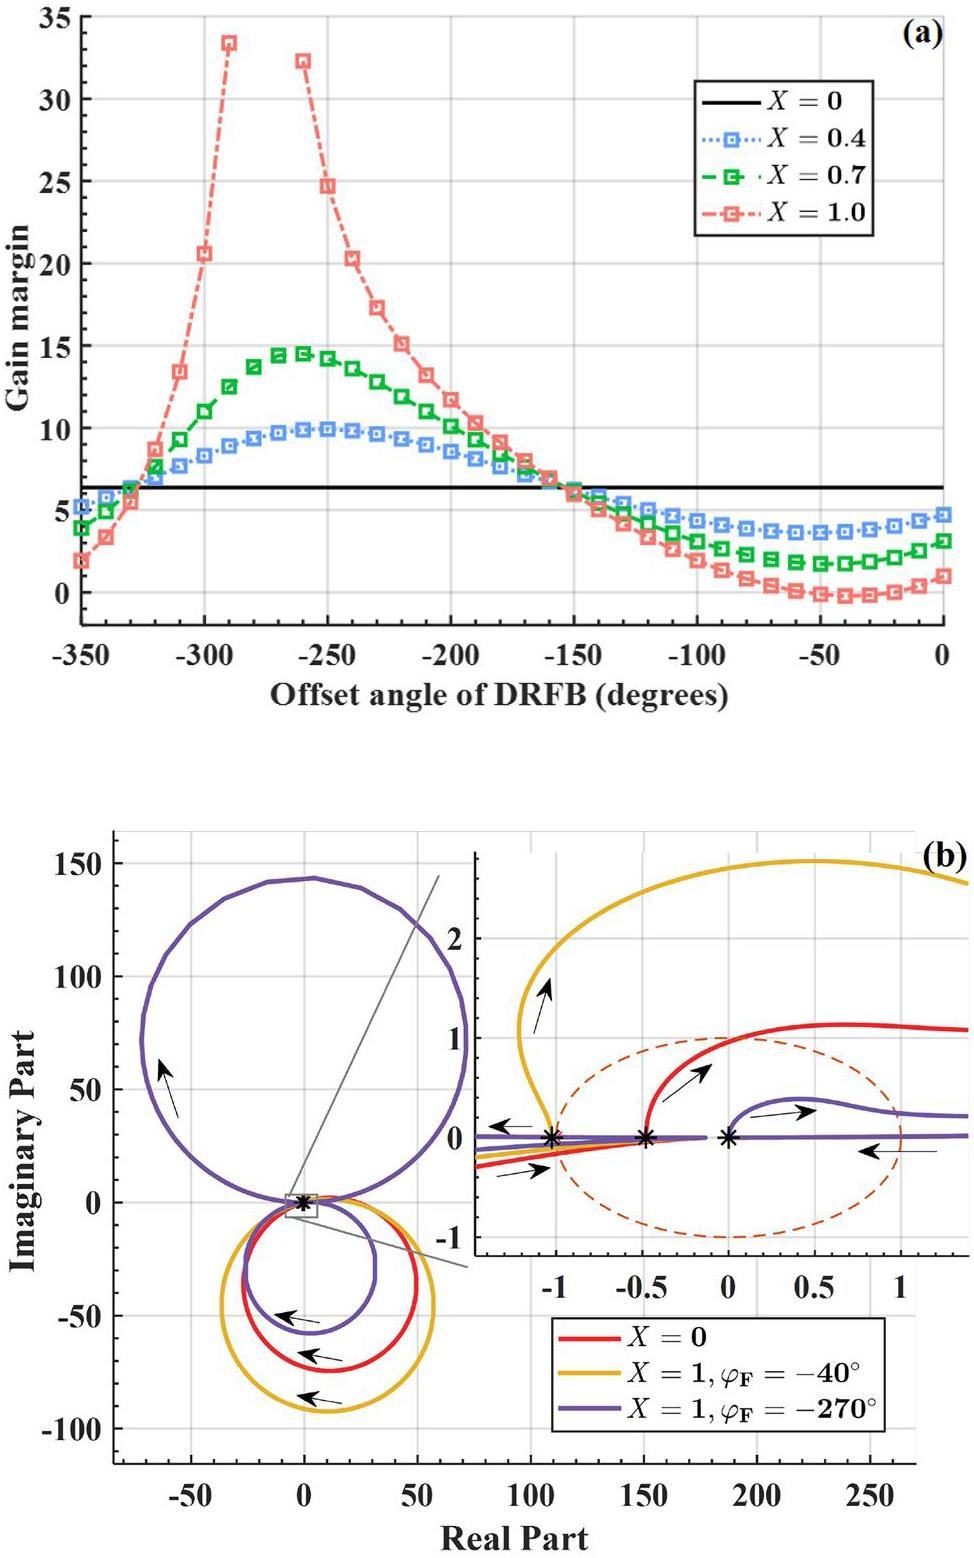
DRFB acts on the MC, affecting the low-frequency segment of the S mode in the frequency domain, and the gain margin recorded here is also in this frequency segment. When X is larger, the gain margin may not be recorded, and as shown by the purple curve in Fig. 9b (X=1, φF=-270°), when observing the corresponding Nyquist curve, this part is actually in the right half-plane at zero frequency, indicating that the system is stable at this point. However, as X continues to increase, the pole of the system's open-loop TF will fall into the right half-plane, which is manifested as the loop generating self-oscillation, and the system enters an unstable state at this time. When the offset angle is not set properly, the system gain margin is less than 0, and the system may also become unstable. Therefore, gain must be maintained within a certain range. When the offset angle is set between -300° and -200°, it is most conducive to the stability margin of the S mode.
During the previous operation of the SSRF, DRFB directly fed back the I–Q signals from the pickup end to the input of the cavity, as shown in Fig. 8. Considering that the loading angle of the MC is not zero, and correspondingly
| Total cavity voltage (MV) | DRFB gain | Current (mA) |
|---|---|---|
| 3.3 | 0 | 140 |
| 3.3 | 0.26 | 185 |
| 3.3 | 0.33 | 190 |
| 3.3 | 0.46 | 220 |
Loading angle
In the preset condition, the entire system was in a compensated state, as in previous discussions, that is, maintaining the transmitter current and cavity voltage in phase by detuning the MC to consider the beam loading effect, corresponding to the case of
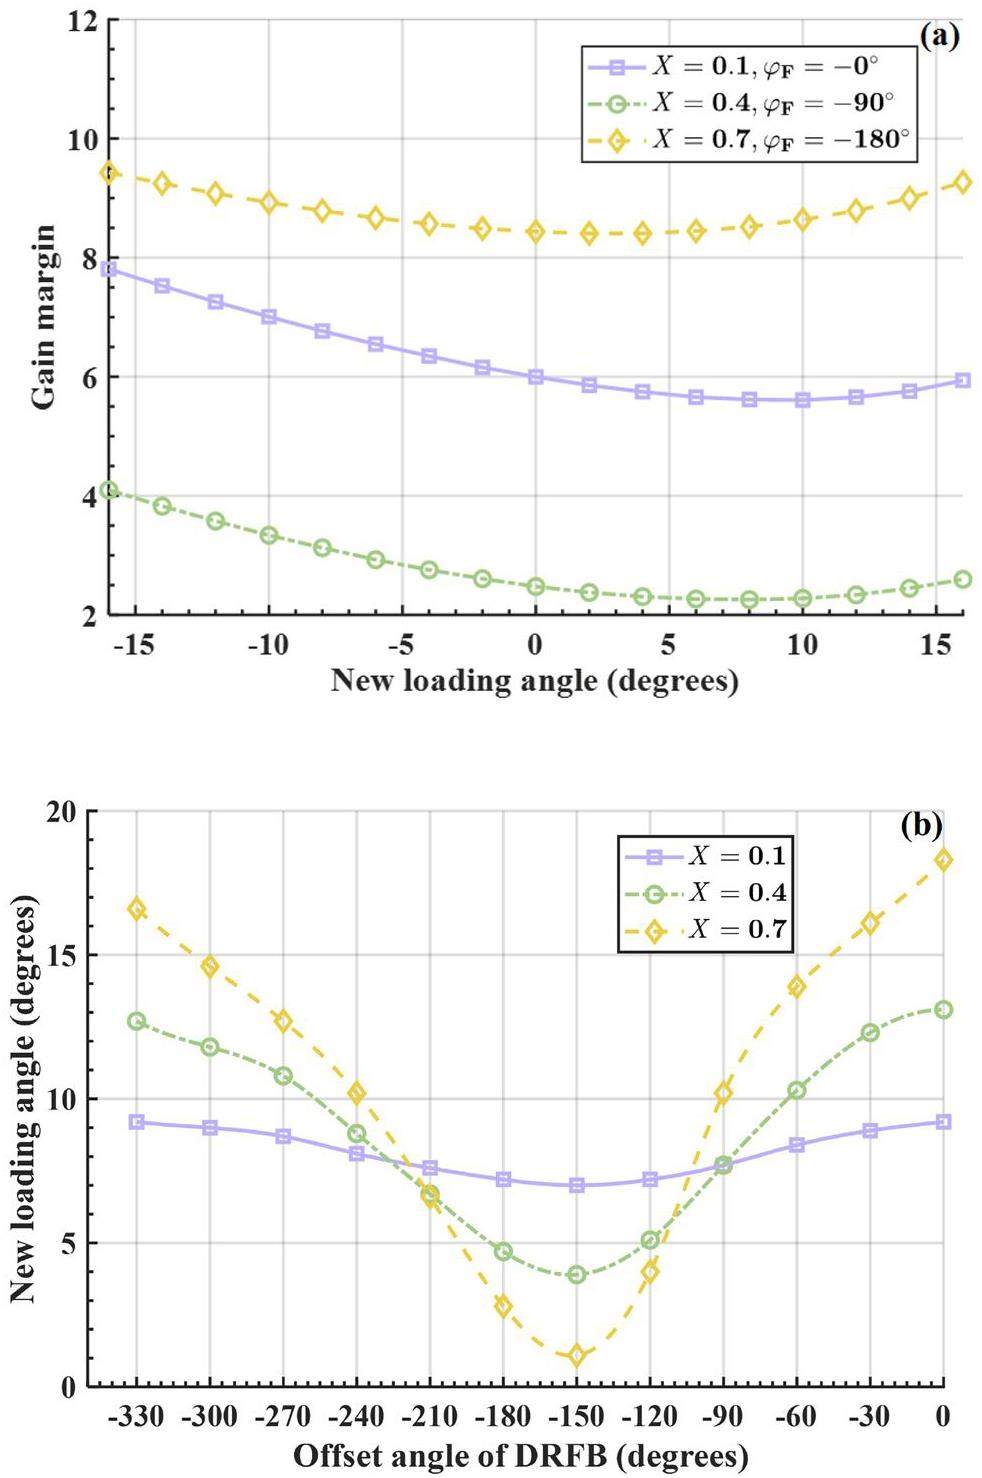
Consistent with the beam dynamics results, the side on which the loading angle was greater than 0 corresponded to the unstable side of the Robinson impedance curve of the cavity. By combining DRFB, the relationship between the new loading angle and stability margin was explored in more detail. As the parameters of DRFB changed, the local minimum value of the gain margin changed; however, they were all positive. In actual operation, the loading-angle deviation caused by the poor loop control capability of the system is common. A suitable negative loading angle can be preset to prevent the system from reaching a more unstable area.
In practical tests, only the MC was analyzed, which means that the HHC part in the model can be significantly detuned. The loop-instability region of SSRF was obtained and marked by simulating and adjusting the load angle. This region was then compared and analyzed against the experimentally measured data, as shown in Fig. 11.
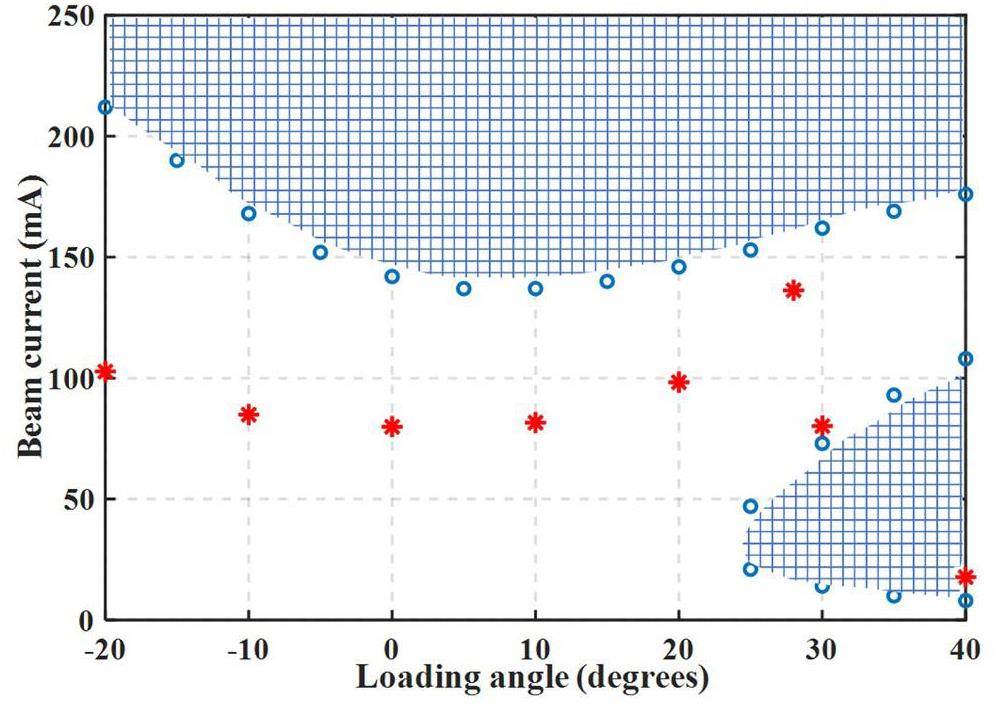
In the experimental results, owing to the presence of nonlinear factors and detuning jumps (usually ±10°), and because low-pass filters cannot fully and effectively simulate the actual effect of digital I–Q-based PI filters, there was a significant deviation from predicted values. However, the experimental results and model predictions exhibited similar trends. Near a small positive value, the beam current reached its minimum value. Additionally, when the loading angle exceeded 25°, coupling with the low-frequency band of the S mode occurred at low beam currents. In practice, sudden drops in the beam current occur when the loading angle is 30°–40°.
AVC and PLL
The amplitude modulation (AVC) and phase modulation (PLL) loops, where the LLRF is located, correspond to the Ca and Cp parts of the system block diagram in Fig. 2, respectively. They have a complex impact on the system stability, as shown in Fig. 8, where the signal passes through a digital filter, a PI controller, and internal and external amplifiers in the loop. If the FIR filter is also simplified to a first-order form, the bandwidth after cascading is that of the digital filter, and the gain is the product of the gains of each amplifier and the PI controller at that bandwidth. The resulting TF after cascading is still equivalent to a low-pass filter module with the specific derivations provided by Liu et al. [34]. These modules eliminate the DC component and exclude the carrier-frequency component [38], which is expressed in Eq. (12):
From the previous analysis of the loading angle, in the SSRF 2.4 MV experimental environment, the controller was found to be located in Region I. At this point, with the loading angle fixed at 0°, when Kp=0.1 and Ki=1×10⁻⁵, the beam was unstable at 110 mA. However, when the controller
As AVC gain and bandwidth continued to increase, the controller's impact was placed in Region II, the controller's impact on the S mode gradually decreased, and the impact on the D mode increased, possibly causing instability in the D mode. While increasing the bandwidth and gain of the PLL, the gain margin near the S mode first increased and then decreased. This implies that only within a certain range did the parameters of the PLL ensure that the S mode did not oscillate. Once again, the continuously increasing AVC bandwidth and gain acted in Region III, at which point the stability margin point of the system was only in the low-frequency segment of the D mode. The PLL had a difficult time affecting the system's stability, and the system was generally in the stable region.
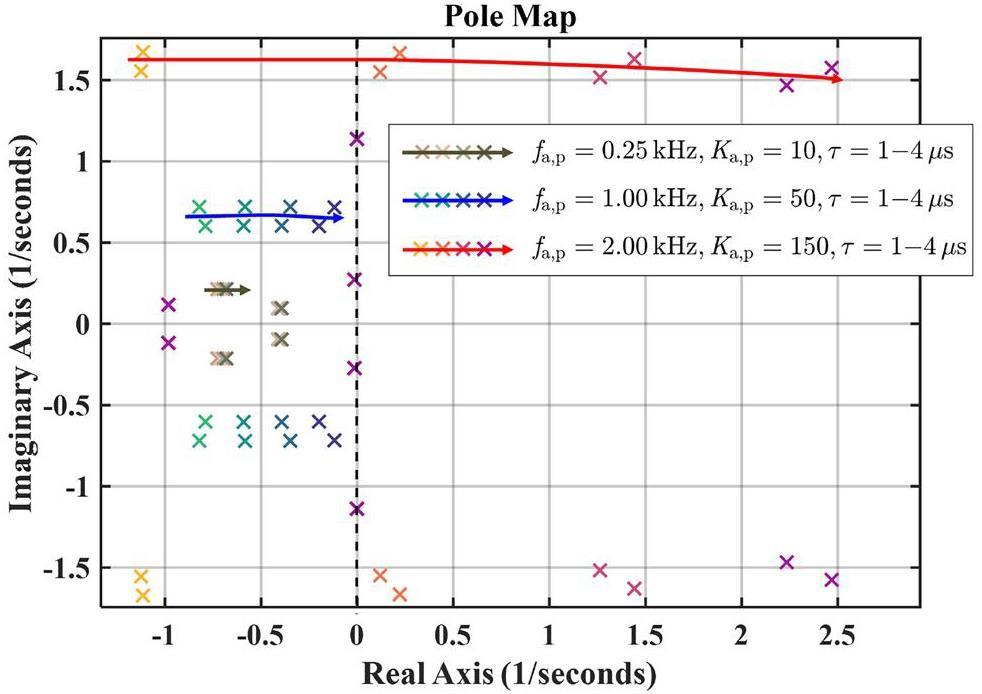
In actual situations, loop delay must be considered. The delay in the LLRF is generally on the microsecond level. Currently, the expression of the system's open-loop TF is extremely complex. We used MATLAB Simulink to simulate the system and found that the delay module had almost no impact on the Bode and Nyquist plots of the system but had a significant impact on the pole of the open-loop TF. In other words, p in Eq. (7) is not necessarily zero because of the presence of a delay.
The poles in Fig. 12 are merely partial poles influenced by the loop delay owing to the amplitude and phase modulation loops. As the loop delay time increased, the poles of the open-loop system gradually approached the imaginary axis from the negative plane; the controller was extremely sensitive to loop delay in Region III, and the pole easily fell in the right half-plane, leading to system instability. In practice, owing to the limitations of the amplifier power and loop delay, it is difficult for the controller to adjust to Region III; that is, the bandwidth gain of the loops will not be very high (Fig. 13.
Conversion of the ASHC from the PSHC
To allow beam currents of different intensities to achieve optimal stretching, the conversion of the HHC to an active mode was considered. Prior to this, we slightly modified the expanded Pedersen model HHC module.
In the phasor diagram, only the HHC components in the third quadrant must be modified. Similarly, in the Pedersen model, only the excitation source must be added to the right side of Fig. 2. The TF from the current excitation modulation in the HHC to the voltage signal modulation is consistent with Eq. (4), simply changing σ to σH, and φL to φLH, and
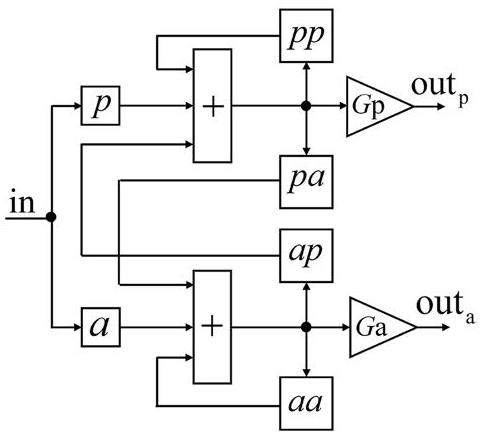
| HHC | MC | |
|---|---|---|
| p | ||
| a | ||
| pp | ||
| pa | ||
| ap | ||
| aa | ||
To achieve optimal stretching [39], the cavity voltage amplitude phase of the HHC should be satisfied, as expressed in Eq. (15):
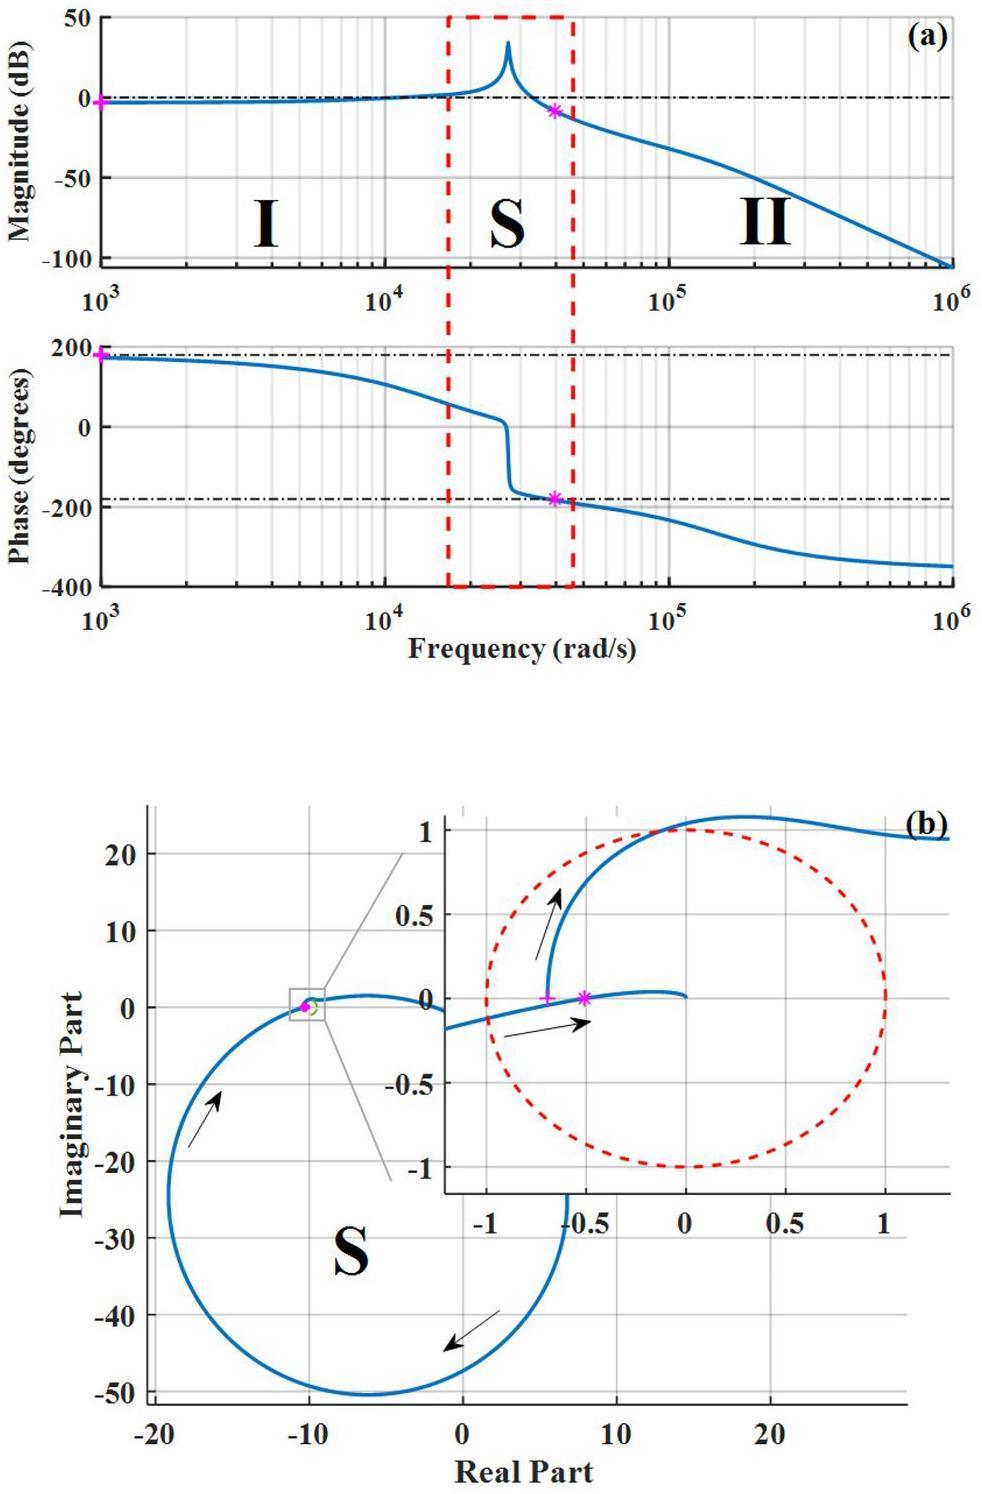
The initial state shown in Fig. 15 refers to not enabling DRFB and setting the loading angle of the MC and HHC to 0 without considering the amplitude-phase loop. The coupling coefficient of the HHC was consistent with that of the MC, at approximately 7500. In practice, the gain margin point of the low-frequency segment does not change significantly, and it is difficult to affect the actual stability of the system, which is marked with a “+” symbol. We were more concerned with the gain margin of the S mode; that is, the point marked with “*” is the critical gain margin.
The parameter settings in Table 5 were changed compared with the parameters in the initial state. We also constructed a MATLAB Simulink model to validate the accuracy of the model. After obtaining the impulse response of the system, we fit its envelope with an exponential function to derive the growth rate. This was then compared with the maximum real part of the poles of the characteristic equation obtained from the open-loop TF, which demonstrated good consistency.
| System parameter | Closed-loop TF pole Re | Time-domain simulation growth rate | Critical gain margin |
|---|---|---|---|
| Initial state | -599 | -589 | 5.89 |
| X=0.4, φF=-50° | -209 | -196 | 2.79 |
| X=0.4, φF=-250° | -837 | -837 | 7.59 |
| θL=-10° | -886 | -886 | 7.76 |
| θL=10° | -258 | -257 | 4.28 |
| θLH=-10° | -412 | -412 | 3.24 |
| θLH=10° | -701 | -702 | 7.58 |
| β=5×10³ | -290 | -290 | 2.8 |
| β=1×10⁴ | -881 | -887 | 10.1 |
Focusing on the critical gain margin column, we easily found that the changes in the coefficients in the MC were consistent with the conclusions in the passive mode system in Section 4. The change in the loading angles of the HHC and MC had opposite effects on the stability margin of the system: the higher the coupling coefficient, the more stable the system tended to be. For the amplitude-phase loop, as shown in Fig. 15a, the influence of the controller on the system frequency domain could be applied to Regions I and II.
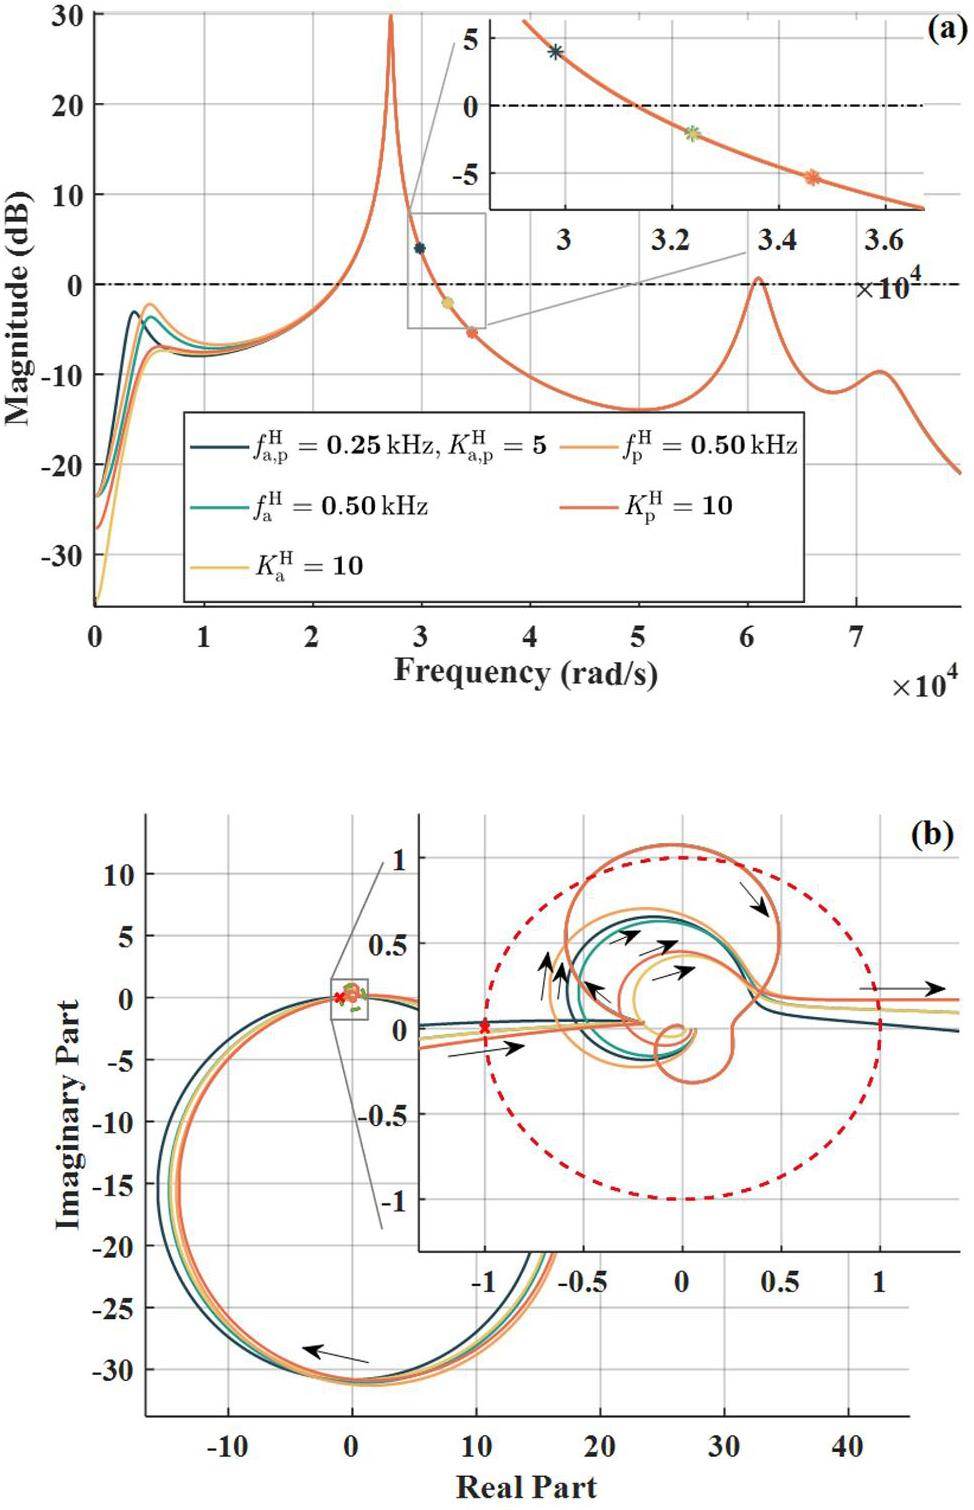
When the loop was set in Region I, the conclusion for the MC was consistent with the analysis in Section 4. A high-bandwidth gain AVC was not conducive to system stability, whereas the PLL had little impact on stability. For the AVC of the HHC, the opposite conclusion was drawn. As the bandwidth gain of the AVC increased, the gain margin of the system moved away from the S mode, whereas the gain margin always increased. In addition, as the bandwidth gain of the PLL increased, the Bode plot of the system produced a bulging shape at the stability margin, which also increased the gain margin. In summary, except for the phase loop of the MC, the controller bandwidth gain of the other loops must be maintained at smaller values; however, the cost is that the system feedback response speed may not keep up. Therefore, the placement of the loop controller in Region II should be considered.
Increasing the gain and bandwidth of the feedback loop of the HHC increased the stability margin of the system. This is clearly observed in the Nyquist plot in Fig. 16. There were two different circles near the unit circle, which corresponded to the amplitude-phase loops of the MC and HHC. Increasing the parameters of the HHC loop decreased the size of the corresponding circle, and the intersection with the real axis entered the unit circle. Based on the above discussion, the parameters of the loop controller can be adjusted to fall within the frequency domain of Region II. At this time, part of the loop in the Nyquist curve will be inside the unit circle, which has no effect on the system stability.
Summary
This study proposed a new mathematical method based on the Pedersen model for the first time to analyze the stability of a double RF system. The original model typically uses the Routh stability criterion to analyze the coupling between a single RF cavity and the loop. After adding a HHC, the system becomes relatively complex, and the order of the open-loop and closed-loop TFs increases. The Nyquist stability criterion can be used to analyze the system more clearly and quickly, and it clearly describes the impact of each variable parameter on system stability.
The amplitude–frequency characteristic curve of the double RF system has two peak values, corresponding to the synchronous frequency (S mode) and HHC detuning frequency (D mode). Taking HALF as an example, after incorporating the parameters into the time-frequency domain model and conducting tracking simulations, the instability of the D mode was quantitatively studied. The conclusions regarding the mode-zero Robinson instability from the model and beam dynamics perspectives were generally consistent. However, the growth rates of the D-mode instabilities obtained using the Pedersen model were generally lower. It is speculated that this is because the growth rates derived from the model cannot completely exclude the influence of S-mode instabilities, and the steady-state working point cannot accurately simulate the entire dynamic process. Future research can focus on further optimizing the beam TF Bs to obtain more accurate results.
A large gain of DRFB within a certain range and the offset angle between -180° and -300°, or the loading angle at a smaller negative value, is beneficial for stability. As the bandwidth gain of the AVC in the MC LLRF increased, the frequency corresponding to the impact area of the entire spectrum of the system also increased, and the above conclusions were confirmed in an SSRF experiment. This study also divided the system frequency domain into three parts and analyzed the parameter settings of the amplitude-phase loop, indicating the parameter setting required to reduce the coupling with the S and D modes in the frequency domain of the feedback loop. However, the results derived from the model tended to be more stable than those obtained in real situations. In addition to the inherent reasons for the model mentioned in Section 3, approximating the amplitude-phase loop as a low-pass filter introduces errors. To describe the effects of loop controllers on the amplitude and phase frequency responses of the system more accurately, further exploration and confirmation are required.
Moreover, this model was theoretically extended to the ASHC from the PSHC. After proposing a typical structure for this complex system, the steps for solving its open-loop TF were clarified. The accuracy of the model was validated through the solutions of the characteristic equation and the MATLAB Simulink time-domain model. When the ASHC remained in the optimal stretching state, the conclusions of each system parameter for the MC still held. At this time, the D mode was not evident in the Bode plot, and only Regions I and II existed. When the controller affected the frequency domain in Region I, only a small gain and bandwidth could maintain stability, which often fails to satisfy the feedback performance requirements. The good news is that, when in Region II, the feedback loops of the MC and HHC are more likely to contribute to system stability.
Intra-beam scattering and beam lifetime in a candidate lattice of the soft X-ray diffraction-limited storage ring for the upgraded SSRF
. Nucl. Sci. Tech. 32, 83 (2011). https://doi.org/10.1007/s41365-021-00913-yLifetime increase using passive harmonic cavities in synchrotron light sources
. Phys. Rev. ST Accel. Beams. 4(3),Influences of harmonic cavities on single-bunch instabilities in electron storage rings
. Nucl. Sci. Tech. 32, 89 (2021). https://doi.org/10.1007/s41365-021-00926-7Effective improvement of beam lifetime based on radiofrequency phase modulation at the HLS-II storage ring
. Nucl. Sci. Tech. 32, 1 (2021). https://doi.org/10.1007/s41365-020-00836-0Simulation studies on two-frequency RF gun
. Nucl. Sci. Tech. 25,Development of a control system for the fourth-harmonic cavity of the HLS storage ring
. Nucl. Sci. Tech. 29, 153 (2018). https://doi.org/10.1007/s41365-018-0497-7Landau cavities at MAX II
. Nucl. Instrum. Meth. A. 416, 465-474 (1998). https://doi.org/10.1016/S0168-9002(98)00667-6Improving Touschek lifetime and synchrotron frequency spread by passive harmonic cavity in the storage ring of SSRF
. Nucl. Sci. Tech. 28, 108 (2017). https://doi.org/10.1007/s41365-017-0259-yStudy of Touschek lifetime in SSRF storage ring
. High Energy Phys. Nucl. Phys. 30, 693-698 (2006).Radio-frequency system of the high energy photon source
. Radiat. Detect. Techno. 7, 159-170 (2023). https://doi.org/10.1007/s41605-022-00366-wDesign and low-power measurement of 1.5 GHz TM020-type harmonic cavity for KEK future synchrotron light source
. Nucl. Instrum. Meth. A. 1053,Equilibrium electron beam parameters of the High Energy Photon Source
. Radiat. Detect. Techno. 7, 279-287 (2023). https://doi.org/10.1007/s41605-022-00374-wRobinson instabilities with a higher-harmonic cavity
. Phys. Rev. ST Accel. Beams. 4(7),Beam Loading Effects in the CERN PS Booster
. Ieee. T. Nucl. Sci. 22(3), 1906-1909 (1975). https://doi.org/10.1109/TNS.1975.4328024Study of the beam-cavity interaction in the CERN PS 10 MHz cavities and investigation of hardware solutions to reduce beam loading
. Ph.D. thesis,Heavy beam loading in storage ring radio frequency systems
. Nucl. Instrum. Meth. A. 376(3), 301-318 (1996). https://doi.org/10.1016/0168-9002(96)00180-5Passive higher-harmonic rf cavities with general settings and multibunch instabilities in electron storage rings
. Phys. Rev. Accel. Beams. 21(11),Multi-port cavity model and low-level RF systems design for VHF gun
. Nucl. Sci. Tech. 31, 8 (2020). https://doi.org/10.1007/s41365-019-0711-2A transient model for RF cavity analysis under beam loading
. Nucl. Instrum. Meth. A. 615(2), 143-157 (2010). https://doi.org/10.1016/j.nima.2010.01.070Novel method to measure unloaded quality factor of resonant cavities at room temperature
. Nucl. Sci. Tech. 29, 50 (2018). https://doi.org/10.1007/s41365-018-0383-3Transient beam loading effects in harmonic rf systems for light sources
. Phys. Rev. ST Accel. Beams. 5,Tuning control system of a third harmonic superconducting cavity in the Shanghai Synchrotron Radiation Facility
. Nucl. Sci. Tech. 30, 157 (2019). https://doi.org/10.1007/s41365-019-0669-0An evaluation of the stability of concrete by Nyquist criterion
. Cement. Concrete. Res. 29, 1689-1692 (1999).https://doi.org/10.1016/S0008-8846(99)00141-6Instability analysis of an active higher-harmonic cavity
. PAC1997. vol. 1, 301-318 (1997). https://doi.org/10.1109/PAC.1997.749862Suppression of longitudinal coupled-bunch instabilities with RF feedback systems in CEPC main ring
. Radiat. Detect. Techno. 7(2), 210-219 (2023). https://doi.org/10.1007/s41605-023-00382-4Mode-zero Robinson instability in the presence of passive superconducting harmonic cavities
. Phys. Rev. Accel. Beams. 26(6),Parameters optimization considering intra-beam scattering in HALF lattice design
. High-power laser and particle beams. 34,Design and comparison of hybrid multi-bend achromat lattices for HALF storage ring
. Nucl. Sci. Tech. 34, 107 (2023). https://doi.org/10.1007/s41365-023-01252-wStability analysis of rf accelerating mode with feedback loops under heavy beam loading in SuperKEKB
. Phys. Rev. Accel. Beams. 25(10),Modeling the interaction of a heavily beam loaded SRF cavity with its low-level RF feedback loops
. Nucl. Instrum. Meth. A. 894, 57-71 (2018). https://doi.org/10.1016/j.nima.2018.03.046Graphics-processing-unit-accelerated simulation for longitudinal beam dynamics of arbitrary bunch trains in electron storage rings
. Phys. Rev. Accel. Beams. 24,Frequency sensitivity of the passive third harmonic superconducting cavity for SSRF
. Nucl. Sci. Tech. 31(3), 31 (2020). https://doi.org/10.1007/s41365-020-0732-xImproving Touschek lifetime and synchrotron frequency spread by passive harmonic cavity in the storage ring of SSRF
. Nucl. Sci. Tech. 28(8), 108 (2017). https://doi.org/10.1007/s41365-017-0259-yLow level radio frequency controller for superconducting third harmonic cavity at SSRF
. Nucl. Tech. 45(12),Simulation of longitudinal beam dynamics with the third harmonic cavity for SSRF Phase II Project
.The authors declare that they have no competing interests.

