Introduction
In recent years, there have been significant concerns over the performance degradation of electronic devices caused by radiation, along with various reinforcement measures aimed at avoiding these adverse effects. As microelectronics continue to advance towards greater complexity and miniaturization, the failure mechanisms of space electronic systems induced by natural radiation environments have also become more complex and severe [1-4]. Currently, the main effects of radiation-induced performance degradation in electronic systems that have been identified are: total ionizing dose effects (TID) [5], displacement damage effects [6, 7], and single-event effects (SEE) [8]. Space missions have indicated that SEEs are an important cause of anomalies and failures in spacecraft operations [9]. Satellites from various countries have suffered from the harm caused by SEE, which originates from ionizing cosmic rays with high energy [10], leading to two types of errors in spacecraft electronics. Soft errors are mainly caused by a single-event upset (SEU) [11], single-event transient (SET) [12], and single-event function interrupt (SEFI), which can change the logical state of a storage unit and lead to device dysfunction. However, the disorder is always temporary and can be restored. Hard errors include single-event latch-up (SEL) [13], single-event burnout (SEB) [14], and single-event gate rupture (SEGR), etc., which can lead to permanent component damage and system failure. Consequently, various methods have been adopted to conduct radiation tests and enhance the radiation resistance of ICs used in spacecraft [15-18].
A common approach for SEE testing is to use heavy-ion beams generated by accelerators on the ground to irradiate electronic devices. This irradiation approach is always employed to assess the overall radiation resistance of devices rather than to evaluate the response of specific areas or modules to heavy-ion impacts. To reinforce a device more effectively against radiation, it is necessary to identify the affected parts that trigger SEE and evaluate their sensitivity to SEE. For the real-time localization of SEE, the capability to promptly and effectively pinpoint the impact of radiation particles on electronic devices under radiation exposure is an important research direction. Therefore, it is imperative to deploy a swift and proficient particle-trajectory tracking algorithm.
Research on tracking algorithms in high-energy physics began quite early and continues to this day [19-22]. In terms of traditional algorithms, Günther et al. [23] enhanced the event processing capacity of the “forward tracking” algorithm by incorporating single instruction multiple data (SIMD), including the Hough transform and cluster search into crucial components, and ultimately improved the algorithm's event throughput by 60% for CERN's Large Hadron Collider beauty (LHCb) experiment. Hennequin et al. [24] and others proposed a parallel reconstruction algorithm for use in the vertex detectors of the LHCb experiment, achieving ultrafast trajectory reconstruction and tracking and meeting the goal of real-time data processing. In addition, machine-learning-based tracking algorithms have been extensively applied in high-energy physics [25-28]. Ai et al. [29] proposed a deep learning approach to reconstruct the location and orientation of multiple heavy-ion tracks in gaseous drift chambers for a Cooler Storage Ring External Target Facility Experiment (CEE) [30, 31]. Hu et al. [32] proposed a fast multitrack location method based on deep learning to fit each track of the incident heavy ions to SEE terminals at the Heavy Ion Research Facility in Lanzhou (HIRFL).
A series of studies on retina tracking algorithms have already been conducted. The retina algorithm [33-36] was designed to locate curved trajectories of charged particles in barrel-shaped track detectors under strong magnetic fields. The results indicate that the tracking efficiency of the retina reaches 95%, and a fixed 2.5 μs is required to process a
Among the studies on SEE localization fields, our previous work [37] proposed a method for directly locating SEE by capturing the projected track of heavy ions using a silicon pixel sensor in a gas detector. One of the key issues to be addressed is the requirement for real-time reconstruction algorithms for heavy ions. Considering that the fast particle trajectory reconstruction capabilities of the retina algorithm and MAPS chips are becoming prevalent in high-energy physics for precise particle track measurements [38-42], the retina algorithm was applied to SEE localization. The primary goal is to explore the applicability of the retina algorithm for tracking linear trajectories within the two-dimensional (2D) space of pixel array sensors and assess the performance of the algorithm by applying it to the reconstruction of simulated heavy-ion tracks before its implementation on FPGAs in a realistic environment.
In the simulation, 25 MeV/u Kr ions were chosen to pass through a gas chamber composed of Ar:CO2 (70:30) at 0.8 atm and 300 K, resulting in the production of ionized electrons along the trajectory. An electric field of 300 V/cm was applied perpendicular to the pixel sensor plane in the gas chamber to generate electrons that drift onto the pixel anode of a Topmetal sensor [43-45]. Subsequently, the collected electrons form a linear particle trajectory of the incident particles, which serve as input samples for the algorithm. This study introduces two variations of the retina algorithm designed for tracking both single and multiple trajectory samples, referred to as the original retina algorithm and the iterative retina algorithm. The performance of the algorithm was assessed by fine-tuning the granularity of the algorithm and other parameters to optimize reconstruction accuracy and tracking efficiency.
The results demonstrate that the iterative retina algorithm achieves a remarkable slope resolution of 0.015° and position resolution of 22.89 μm. These values are comparable to those obtained using the noniterative retina algorithm. Moreover, the iterative retina algorithm exhibited a tracking efficiency of over 97%. These results confirm that the retina and iterative retina algorithms effectively fulfill the task of tracking linear particle trajectories obtained by pixel sensors in SEE localization.
Principle of retina algorithm for linear trajectory tracking
The retina algorithm is inspired by the recognition characteristics of the biological retina, and is a pattern recognition algorithm invented to mimic the visual system of living organisms. Theoretically, the retina algorithm can recognize patterns using multiple parameters. In this study, the algorithm was used to recognize straight-line trajectories projected onto a 2D plane for SEE localization.
The principle of tracking linear trajectories is as follows. First, the 2D parameter space of the straight-line patterns is divided into several small units based on the set granularity. Accordingly, a 2D parameter space array is generated. Each unit in the array is called a retina cell in the algorithm. The corresponding parameters are denoted by (i, j). The elements from the target sample are then input into the divided retina cell array. In each retina cell cellij, the similarity weight value
As inferred from the principle of the retina algorithm, the calculation of
The algorithm is divided into four steps as shown in Fig. 1.
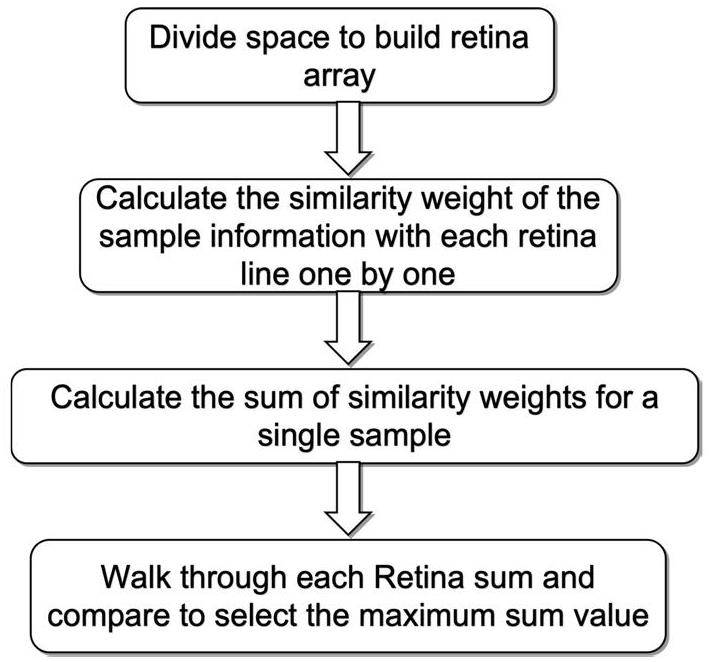
Step 1: Partition space to establish retina cell array. Initially, the boundary conditions were set for the large square array in both the horizontal and vertical directions of the parameter space, pre-determining the array range of values. Within this confined parameter space, the 2D space is divided into I × J small square retina cells along both directions. Consequently, the retina cell array comprised I rows and J columns of computational cells, known as retina cells, with the total count defining the granularity of the algorithm. The horizontal array dimension comprises cells
Step 2: Individually input sample information into the algorithm framework. For each sample, the similarity weight was calculated in relation to each retina cell within the algorithm.
Step 4: Scan all retina cells to obtain the value distribution of Sumij. Finally, the retina cell with the maximum value of the sum is identified as the linear particle trajectory, and the corresponding position (i, j) is referred to as the parameter reconstructed by the retina algorithm.
To describe the use of the retina algorithm to track the heavy-ion trajectory in 2D space, a detailed example is presented as follows.
In 2D space, a line in the Cartesian coordinate system is represented by
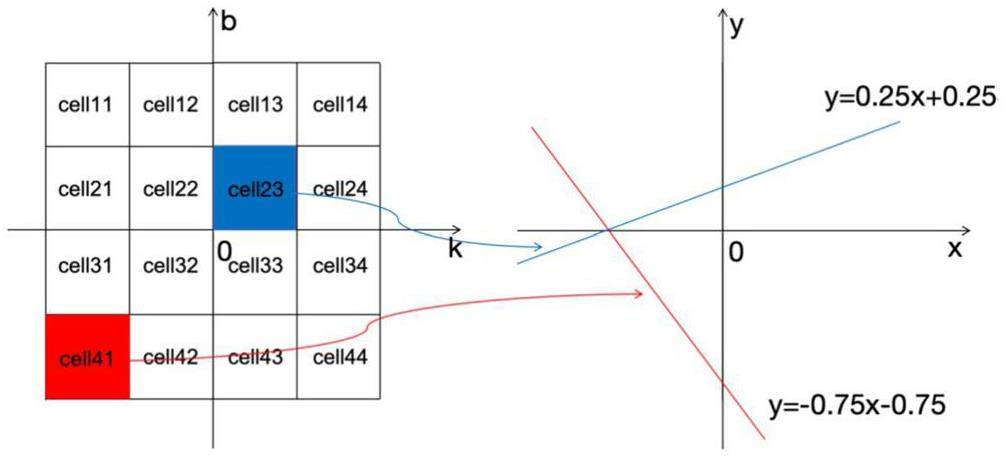
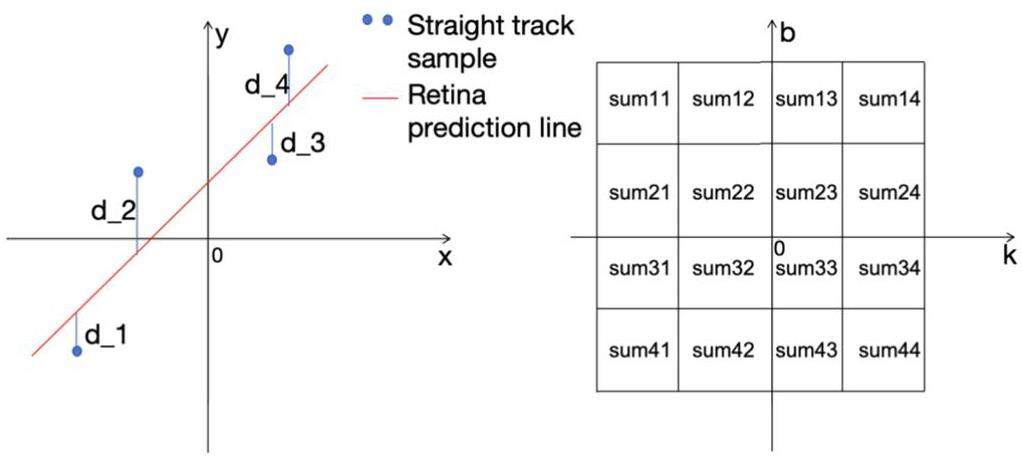
From the example, a “slope-intercept” 2D parameter space is generated and shown on the left side of Fig. 2. In the parameter space, the cell23 and cell41 correspond to lines in the “x-y” 2D physical space, which are shown on the right side of Fig. 2 as lines L23 and L14, respectively. The lines Lij corresponding to these cellij are referred to as retina prematched lines, and their corresponding linear expressions are y = jx + i. After Lij and cellij are defined, the sample line trajectory is in the manner shown on the left side of Fig. 3, which comprises the coordinates of the gray points. The vertical distances between these coordinate points and the retina-predicted line L23 are denoted by
Based on the aforementioned example, a simulation was conducted to test the tracking function of the retina algorithm. In the simulation, 2000 linear track samples were generated each time, and the ranges of values for the parameters k and b were set to [0, 10]. In addition, the granularity of the retina algorithm was set to four different values: 10 × 10, 20 × 20, 49 × 49, and 99 × 99. The results of the slope and intercept resolutions of the line trajectories reconstructed by the retina algorithm under the four different granularities are listed in Table 1, where σk represents the standard deviation for parameter k and σb represents the standard deviation for parameter b. As the table shows, the precision of the reconstructed parameters increases with the granularity of the retina array. When the granularity of the algorithm was increased to 99 × 99, the slope and intercept resolution reached 0.03 and 0.14, respectively. These results are quite precise and indicate the feasibility of the retina algorithm for tracking linear trajectories.
| Granularity | σk | σb |
|---|---|---|
| 10 × 10 | 0.31 | 1.38 |
| 20× 20 | 0.16 | 0.7 |
| 49× 49 | 0.06 | 0.27 |
| 99× 99 | 0.03 | 0.14 |
After obtaining preliminary results from the above simulation, two types of tracking algorithms with fixed parameters were designed for track fitting with heavy iron particles. One is a simple retina for tracking a single-track event, and the other is an iterative retina for tracking multiple-track events. The two algorithms are described in detail in the following section.
Retina algorithm implementation for single-particle track fitting
This section focuses on the experimental study of single-particle trajectory tracking. Building on the foundational steps of the retina algorithm, two novel parameters were incorporated: a distance threshold and a pixel value weight. These additions aimed to provide a more comprehensive assessment of the tracking accuracy achieved using the retina algorithm. For the analysis, single-track sample data derived from a 5000-frame simulation via the Topmetal sensor were utilized as the input for the algorithm.
Single-track event samples
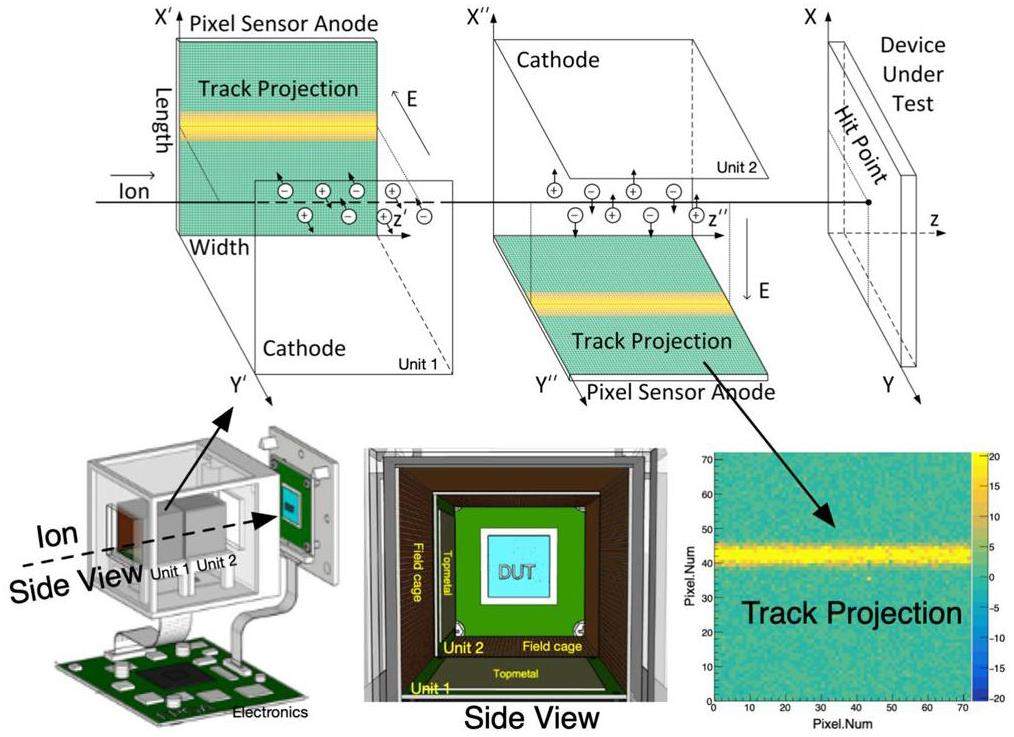
When charged particles pass through a gas detector, a certain number of electron-ion pairs are generated along the particle track. Electrons and ions drift in opposite directions under the influence of an electric field. The electrons are then collected by the pixel array of a Topmetal sensor, which serves as the anode, thereby converting the generated electrical signal into a track image of the incident particles. When placed on a single plane, the Topmetal sensor is capable of providing one-dimension (1D) position information of incident particles. When two Topmetal sensors are strategically placed on two orthogonal planes, 2D position information of incident particles can be acquired.
The principle of using a Topmetal sensor to locate a single heavy ion is illustrated in the upper part of Fig. 4. The positioning module of the tracking detection device consists of two identical positioning units, each of which has a flat cathode and a silicon pixel sensor that acts as both an anode and for track imaging. A 3D schematic of the device and the internal structure of the unit are shown on the left side of the lower part of Fig. 4. The device under test (DUT) for SEL testing was placed on the right side of the second unit. To minimize the edge effects of the electric field, a cage structure composed of thin metal strips was added to both sides of the electrodes. This addition aims to reduce electric field distortion at the edges. Furthermore, the pixel sensor was placed away from the boundaries of the unit to minimize the impact of electric field edge effects as much as possible. When high-energy heavy ions pass through the units, the electrons produced along the track drift towards the pixel array under the influence of the electric field. During the drift process, electrons diffuse, ultimately forming a straight projected track of heavy ions on the pixel sensor. The pixels with high brightness (yellow pixels) represent the track of the heavy ion projected onto the x-z plane, as shown on the right side of the lower part of Fig. 4. The position between the positioning unit and the DUT was carefully calibrated before testing. One positioning unit can provide 1D positional information for a single heavy ion; therefore, two units can provide 2D coordinates of the heavy ion hitting the DUT. During the track simulation, 25 MeV/u Kr ions were used as incident particles with a gas composition of
| Parameter | Value | Parameter | Value |
|---|---|---|---|
| Particle types | Kr26+ | Height of incidence (mm) | 1.5∼5 |
| Particle energy (MeV/u) | 25 | Electric field (V/cm) | 300 |
| Gas | Ar:CO2(70:30) | Drift speed (cm/μs) | 0.7 |
| Gas density (mg/cm3) | 1.714 | Diffusion coefficient (μm/cm1/2) | 150 |
| Ionized energy WI (eV) | 28.4 | Pixel pitch (μm) | 83 |
| Energy loss (keV/μm) | 3.06 | pixel array | 72 × 72 |
| Range of ions in gas (mm) | 513 |
Retina algorithm parameter design
Based on the principle of the retina algorithm introduced in Sect. 2 and combining the features of the particle linear trajectory samples, the basic parameters of the retina algorithm can be determined. The 2D parameter space of the retina algorithm is (k, b). Here, k represents the slope of the line, and the value range is set between -1 and 1. b represents the y-intercept of the line, with values ranging from 0 to 72 times the pixel pitch. To conduct a detailed evaluation of the algorithm, multiple levels of granularity were set for the retina algorithm, ranging from 31 × 31 to 95 × 95.
To enhance the computational accuracy of the retina algorithm, three new influencing factors were next incorporated in the process of calculating the weight value W of the retina cell. These factors were the pixel value, pixel threshold, and distance threshold.
First, based on the existing formula for calculating the weight value W, the pixel value An of each input sample coordinate point n is introduced as an influencing factor. This implies that the pixel value of each coordinate point in the input data contributes to the calculation of the weight value W, which is likely to be a factor determining the importance or influence of that particular point in the processing of the algorithm. The pixel value An of each input sample's coordinate point n was first incorporated as an influencing factor into the original formula to calculate the weight value W. With this change, the formulas for calculating W and Sum are expressed as Eq. (2). This resulted in pixels with higher brightness in the trajectory sample having a higher matching weight for the predicted line L, represented by the corresponding cell. This improved the tracking accuracy of the retina algorithm.
Performance results of tracking of single-track event samples
After setting the parameters of the retina algorithm, a complete simulation test was conducted to evaluate its ability to track single-trajectory samples. Three parameters were used as criteria for measuring the accuracy of the algorithm: slope resolution, intercept resolution, and comprehensive position resolution of the reconstruction.
For single-track sample data, each frame contains one track, assuming that the number of frames obtained from the Topmetal sensor is N, and the slopes of the N original straight-line samples are
During the process of reconstructing the single-track samples, we explored the impact of varying the granularity parameters on the reconstruction accuracy of the retina algorithm. This relationship is illustrated in Fig. 5a and b presents the detailed distributions of the algorithm's reconstruction resolution of the slope, resolution of the intercept, and position resolution at different granularities. The results indicate that, as the granularity of the algorithm increases, there is a corresponding enhancement in the tracking accuracy, which is particularly noticeable in the improvement of the intercept and position resolutions. However, beyond a certain granularity level, further increases do not significantly enhance tracking accuracy, which tends to stabilize at a certain value. At this point, the accuracy of the reconstructed linear trajectory predominantly depends on the precision of the trajectory samples and the intrinsic properties of the detector, aligning with the theoretical expectations of the algorithm.
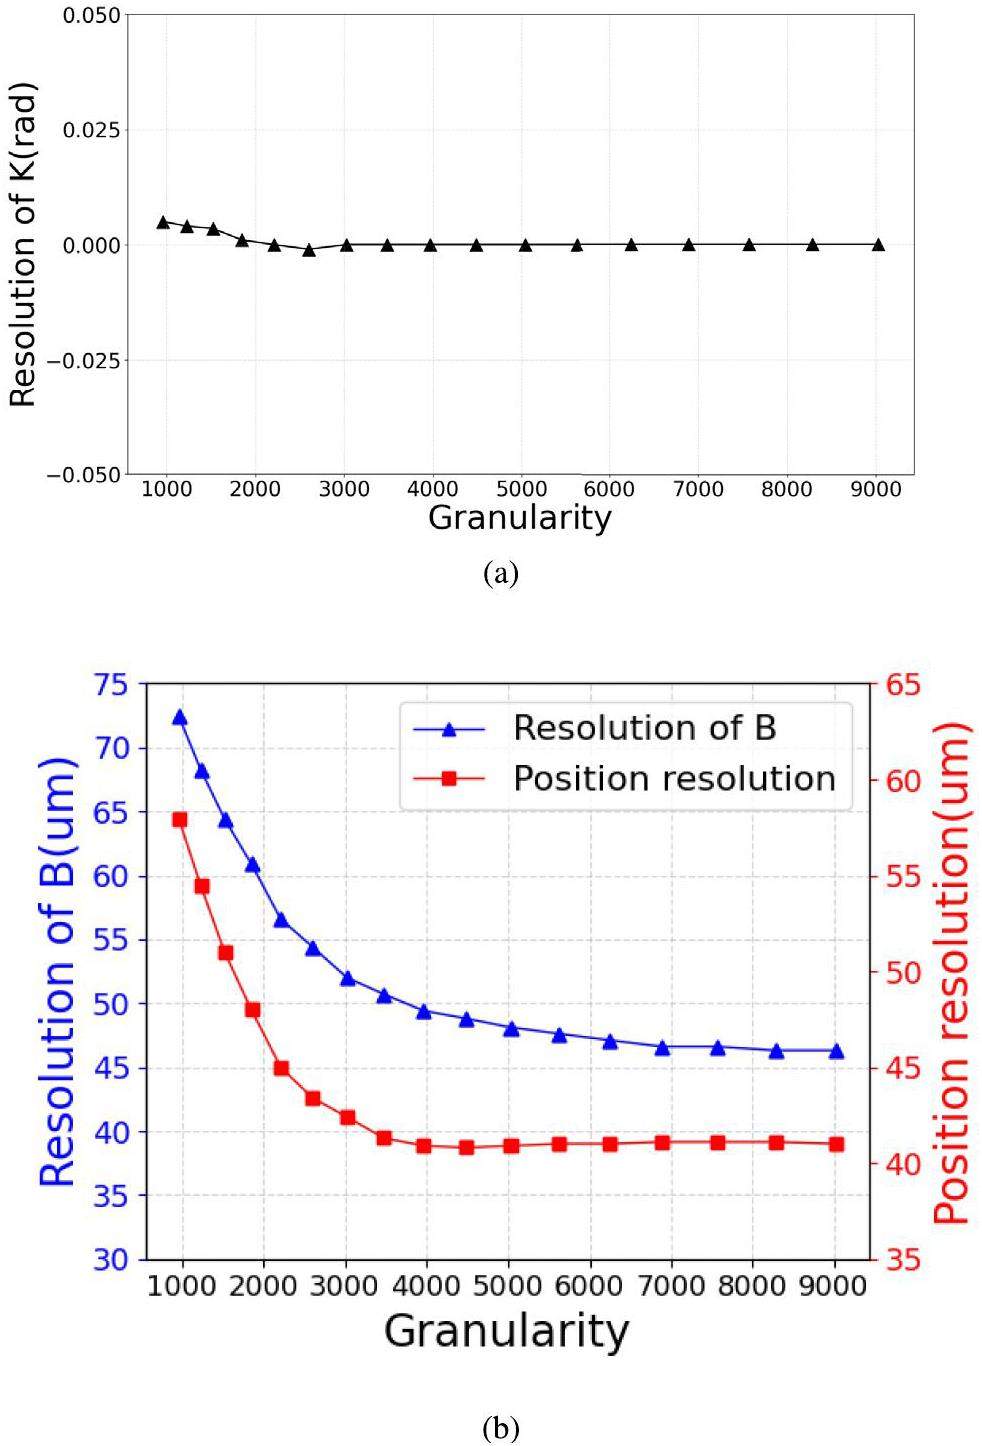
In practical applications of the algorithm, it is crucial to strike a balance between granularity and accuracy. The goal was to minimize the algorithm granularity to reduce the computational load while still satisfying the resolution required for recognition. For the single-track reconstruction detailed in this study, a set of algorithm parameters was optimized, as listed in Table 3. Specifically, the variance σ was set to 0.8, the distance threshold was set to 0.4 pixels, and granularity was set to 72 × 100. The resulting calculations yielded an angular resolution σk of 0.573° and longitudinal resolution σb of 25 μm, as shown in Fig. 6a. These results demonstrate that the algorithm maintains an angular error within 0.6° and a longitudinal error within 1/3 of the pixel pitch (83 μm), thereby confirming its accuracy in track reconstruction.
| Granularity | σ | Ath | Number of Samples | dth | σk (°) | σb (μm) | Position resolution (μm) |
|---|---|---|---|---|---|---|---|
| 72 × 72 | 0.8 | 10 pixels | 5500 | 0.4 pixel | 0.573 | 25 | 23 |
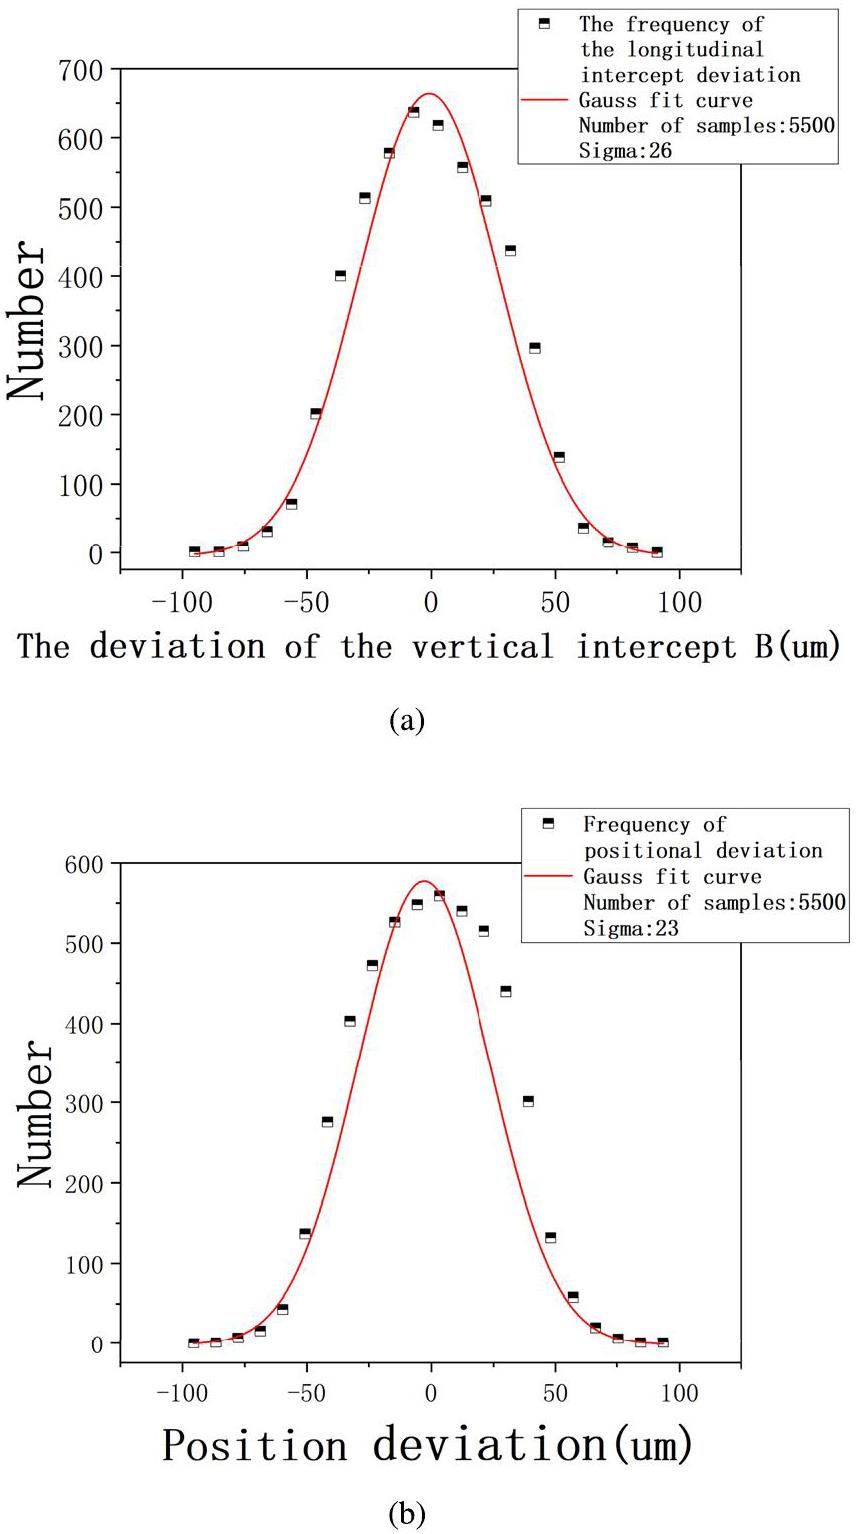
Furthermore, by applying the retina algorithm with the established parameters, a distribution graph illustrating the position resolution was obtained from 5500 single-track samples, as depicted in Fig. 6b. The solid black line in the figure illustrates the actual distribution of the resolution deviation, and the red curve was obtained via Gaussian fitting. This distribution reveals that, under these conditions, the final positional resolution of the retina algorithm is approximately 23 μm, which is notably less than 50% of the pixel pitch (83 μm). This resolution level indicates that the algorithm preliminarily meets the resolution requirements of Topmetal sensors for tracking the linear trajectories of heavy ions and is expected to achieve a higher positional resolution at higher pixel densities.
Implementation of iterative retina algorithm for multitrack event fitting
The retina algorithm performs well by reconstructing the trajectories generated from single-track event samples. The retina algorithm needs to evolve to handle multiple event samples. To meet the practical requirements, an iterative retina (IR) algorithm was proposed and applied to track multiple trajectories. Samples based on multiple trajectory events (referred to as multitrack events) were used as inputs for the IR algorithm. The efficiency and resolution of the IR algorithm are discussed at the end of this section.
Multitrack event samples
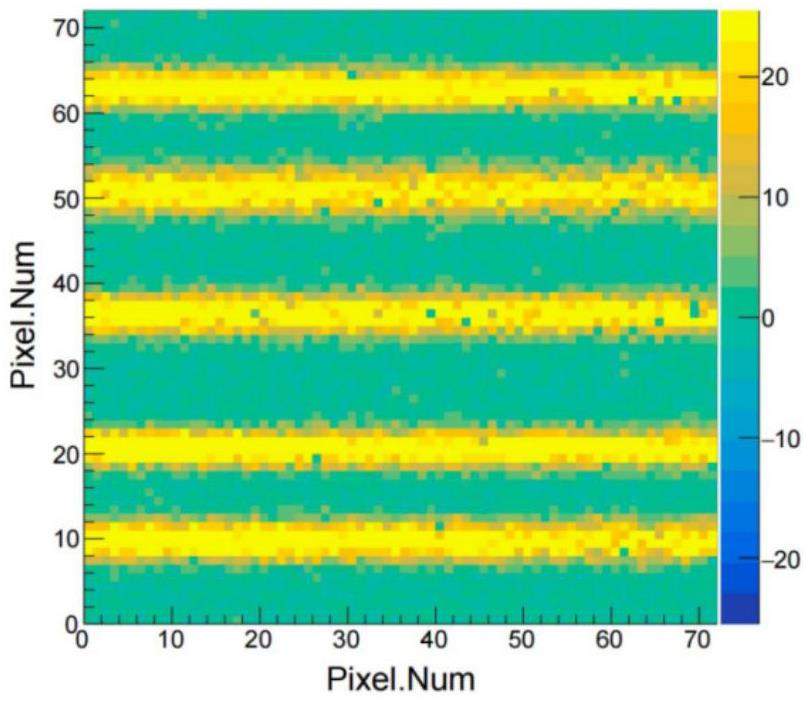
Under the same conditions and environment as when generating single-track event samples, multiple Kr ion beams were inserted during multitrack event generation. In this manner, the Topmetal sensor can obtain data samples formed by multiple straight-line trajectories each time, as shown in Fig. 7. These data samples were multitrack event samples used as the input for the IR algorithm. The simulation parameters of the multitrack event samples were the same as those of the single-track event samples in Sect. 3.1. For multitrack positioning, the beam should be uniformly distributed in the cross-section, and the beam size can be adjusted to cover the area of the DUT by a collimating orifice, while the beam width should be smaller than the detectable width of the positioning module. The experiment showed that the maximum beam flux of the Kr ions was 103 ions/(cm2·s) under room conditions, corresponding to approximately five tracks in each frame. At higher fluxes, the tracks overlap significantly and cannot be distinguished effectively [37]. Considering the pixel size of the Topmetal sensor, during the event generation process, the number of incident Kr heavy ions in a single-event sample was set between three and seven.
Principle of iterative retina algorithm
Compared with the single-track event tracking case, in the multitrack event case, all particle trajectories present in the event must be identified simultaneously. This requires the algorithm to determine the ability to find maximum sum values. According to the principle of the retina algorithm, only one retina cell with the maximum sum value in a given 2D parameter space is found each time. Therefore, an additional IR algorithm was designed to satisfy the requirement of determining the maximum sum values in a given region.
The main concept of the IR algorithm is to run the retina algorithm iteratively. Consider the two-iteration retina algorithm as an example (shown in Fig. 8. In the first iteration, the full parameter space is divided into I × J retina computing units, and these computing units are referred to as super retina cells (supercells). Scanning using the first retina algorithm enables the sum of the samples to be obtained for each supercell. Supercells with sum values exceeding the threshold
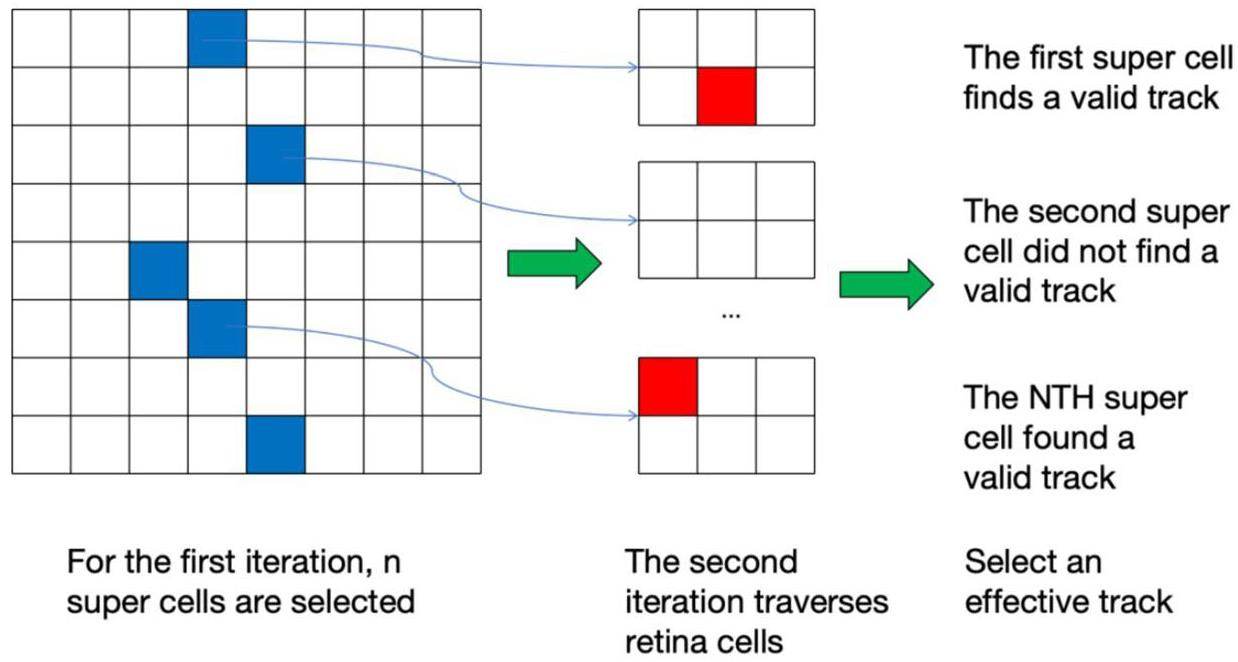
This study employs a second-order iterative retina algorithm for tracking trajectories in multitrack event samples. The granularity is set to Z × Z in the first iteration and Q × Q in the second iteration. The settings for the pixel and distance thresholds in both iterations aligned with the rules established for the ordinary retina algorithm, as described in the previous section. Furthermore, two additional filtering thresholds, Sumth1 and Sumth2, were implemented to identify the retina cell units where the maximum values were located, thereby facilitating the completion of the tracking task. The algorithmic process designed for this purpose is illustrated in Fig. 9.
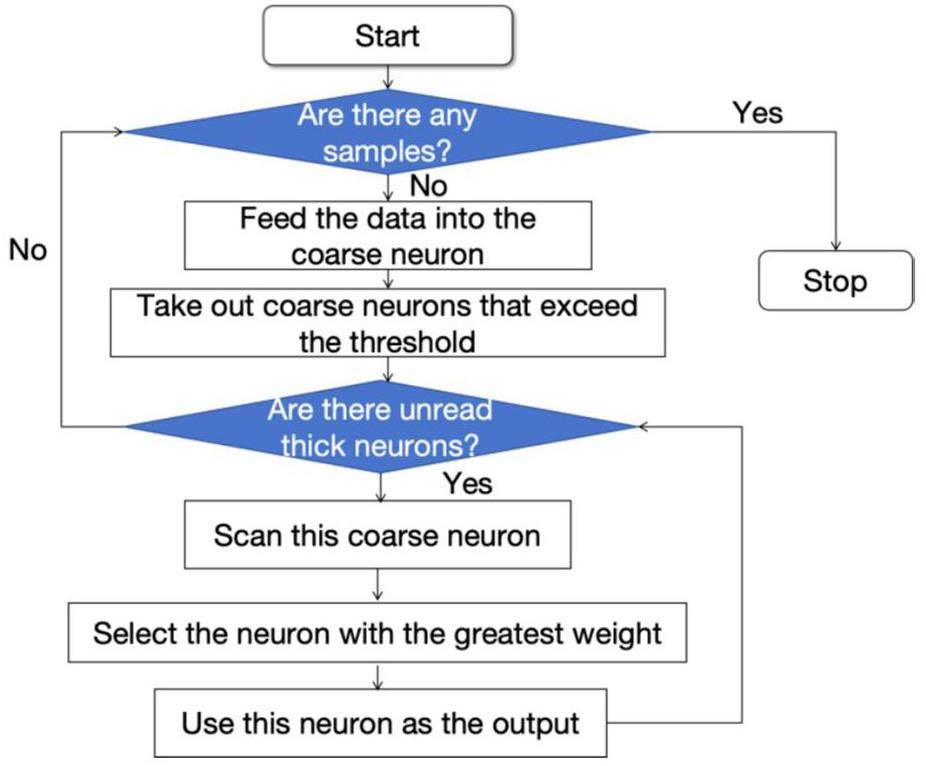
In addition, compared to the simple retina algorithm, the IR algorithm can reduce the computational load of the entire algorithm when the scanning granularity is the same. Assuming that the IR algorithm selects H supercell units in the first iteration, the total number of retina computation units that must be calculated is (
Efficiency calculation of IR track algorithm
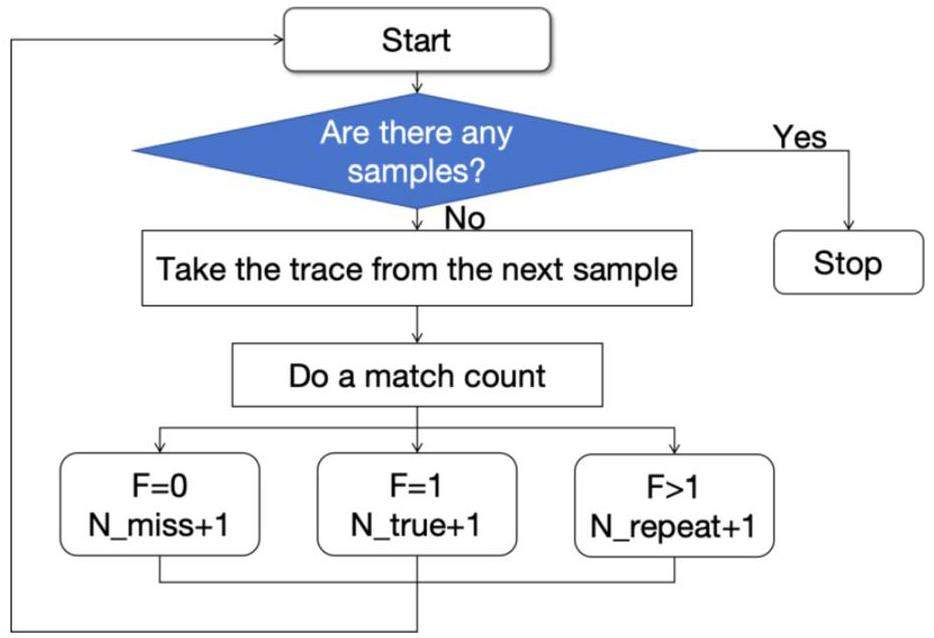
In addition to the resolution of the reconstruction parameters, the efficiency of the algorithm is an important factor in determining its performance in the case of multitrack event samples. According to the trajectory results identified by the IR algorithm, the matching patterns of the identified trajectories can be classified into three main categories, defined as follows.
• Perfectly matched trajectory: The trajectory identified by the algorithm is uniquely identical to the trajectory in the multitrack event samples.
• Over-matched trajectory: Identified trajectories are the same as those in the multitrack event samples, but more than one exists.
• Unmatched trajectory: A trajectory that exists in the multitrack event samples but is not present in the identified results of the IR algorithm.
The trajectories belonging to the first two cases are valid tracks reconstructed by the IR algorithm, whereas the trajectories belonging to the third case are missing tracks that the IR algorithm does not find. For example, the IR algorithm can be used to trace N multi-trajectory samples and identify M heavy-iron trajectories. In the resulting analysis, these M trajectories must be classified individually according to the matching pattern defined above. The classification and statistical processes for the three matching patterns (
Performance of the IR algorithm for tracking multitrack event samples
The performance of the IR algorithm was tested according to the methods introduced in the previous subsections. During testing, IR algorithms with different granularities were configured to comprehensively evaluate the performance of the algorithm. The results also provide detailed parameter references for implementing the IR algorithm in real-time FPGA devices. The tracking results of the IR algorithm are presented in the following figures.
Resolution results for the reconstructed parameters are shown in Fig. 11a and b show the distribution of the reconstruction resolutions of the slope, intercept, and position under different granularities of the IR algorithm. In the figure, a parameter loop is used instead of the granularity of the two-iteration retina algorithm. The relationship between the loop and the granularity of the two iterations is given by Loop = Z × Q, where the granularity of the first iteration of the retina algorithm is Z × Z, and the granularity of the second iteration is Q × Q. Ten different granularities were set from loop = Z × Q = 8 × 10 to loop = Z × Q = 19 × 11 in the IR retina result analysis. As the graph shows, under different granularity situations, the reconstruction parameter resolution of the algorithm remains stable. This differs from the case of using the retina in a single-track event, where the smallest granularity (loop = Z × Q = 8 × 10) in the IR algorithm is already sufficiently high to reconstruct tracks accurately. Therefore, with other parameters set reasonably, the IR algorithm can accurately match the positions of the lines, achieving a high level of tracking accuracy that meets the basic requirements for tracking.
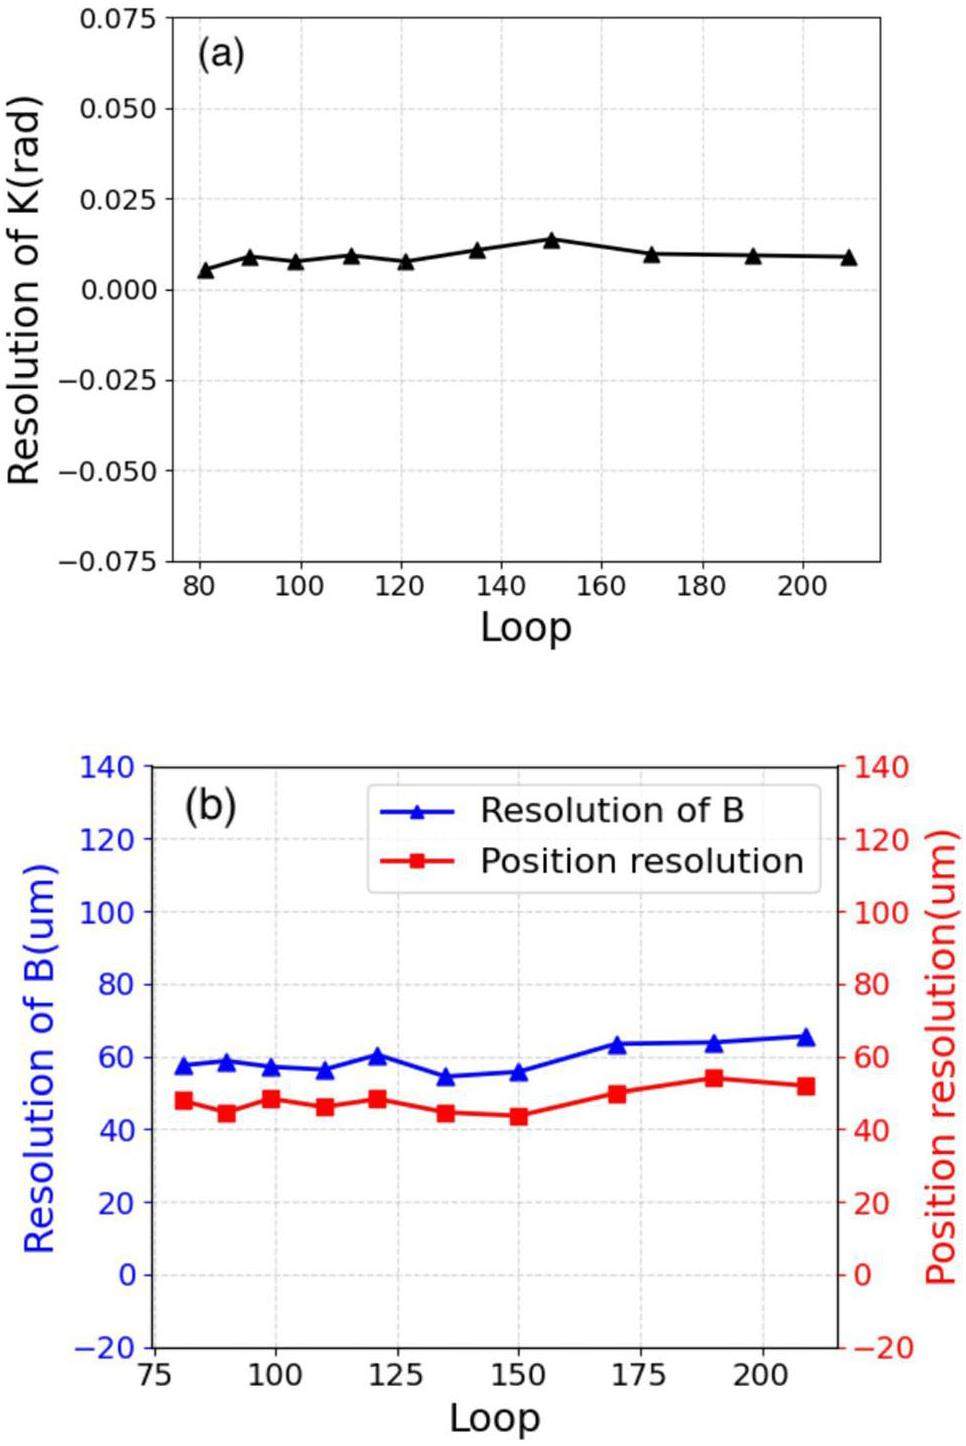
In addition, compared with the single-track event case, the position resolution in the multitrack event case is degraded from 40 to 50 µm on average under the same granularity. This is because, compared to the retina algorithm, in the case of the IR algorithm, we appropriately lowered the threshold-setting standard during the two iteration scans to maintain the efficiency of the IR algorithm at over 90%. Approximately 8% of the overmatched trajectories were generated by the IR algorithm. The overmatched trajectories have a lower position resolution than the perfectly matched trajectories; they reduce the overall position resolution of the IR algorithm. In our future study, an additional judgment process will be added after the IR algorithm to remove those overmatched trajectories and turn them into perfectly matched trajectories.
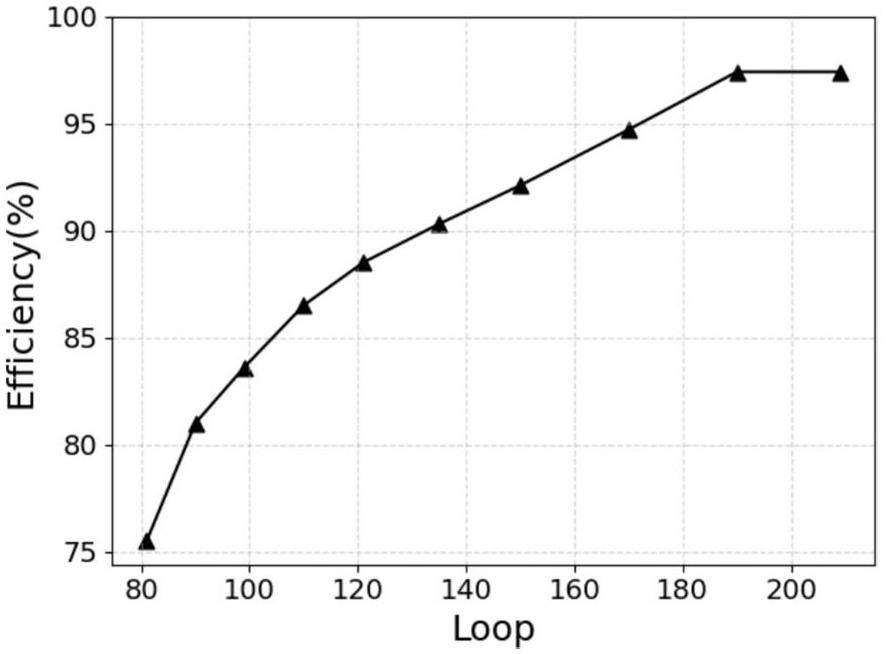
The tracking efficiency of the IR algorithm is presented in Fig. 12. The figure shows that a finer granularity can significantly improve the tracking efficiency of the IR algorithm. The main reason for this is that in the case of lower granularity, the parameter space covered by each supercell in the first iteration of the algorithm is too large. This significantly increases the probability of two or more original lines from different samples falling into the same supercell space. After the second calculation, the IR algorithm will only find one of these original lines, leading to the omission of the others and resulting in lower efficiency. When the granularity loop is greater than 140, the efficiency of the IR algorithm can exceed 90%, making the algorithm reliable and suitable for multitrack event sample tracking. In addition, due to the multi-event sample used in this study, no crossing cases occurred between the trajectories in the 72 × 72 silicon pixel detector space. During the simulation, we found that the algorithm recognized only fake trajectories when there were intersections between the trajectories. Under these conditions, the IR algorithm provided a purity of 100%. All tracks found by IR can be matched with the tracks existing in the multi-event sample.
Finally, the optimal combination of granularity and parameters was determined. A total of 30,000 straight-line reconstructed trajectories obtained from 5,000 multiparticle trajectory samples were counted and analyzed. The tracking performance of the IR algorithm for this combination is listed in Table 4. From the table, the granularity of the IR algorithm was set to loop = Z × Q = 10 × 19, and the efficiency of the IR algorithm reached over 97% with a position resolution of 53 μm. The performance results indicate that the IR algorithm presents a high tracking efficiency for multitrack heavy-ion samples while providing acceptable reconstruction accuracy. This meets the requirements for SEE located in 2D space on the Topmetal pixel detector platform.
| Parameter | Value | Parameter | Value |
|---|---|---|---|
| 19 × 19 | Nall | 30000 | |
| 10 × 10 | Ntrue | 26806 | |
| σ | 9.5 | Nrepeat | 2415 |
| σI | 0.4 | Nmiss | 779 |
| Pixel threshold | 10 pixel | Efficiency | 97.4% |
| d_threshold | 3.4 pixel | Variance k | 0.009 rad |
| d_threshold_I | 0.25 pixel | Variance b | 63 μm |
| Position resolution | 53 μm |
Conclusions
In this study, a tracking algorithm based on the retina algorithm was developed to recognize and reconstruct linear trajectories in 2D space for SEE localization. For the gas detector, a Topmetal sensor with a 72 × 72 pixel array and a pixel pitch of 83 μm was selected to simulate single and multiple linear track event samples of 25 MeV/u heavy ions under the gas condition of Ar:CO2 (70:30) at 0.8 atm and 300 K. The retina algorithm then processed single-track samples, whereas the iterative retina algorithm handled multitrack events. The simulation results showed that the algorithm achieved a track position resolution of 40 μm for both single- and multitrack events. In addition, the iterative algorithm achieved a tracking efficiency exceeding 97%. These results indicate that the retina algorithm is highly effective at tracking the linear trajectories of heavy ions using a pixel detector. Furthermore, its high parallel-scanning computing capability is promising for online tracking applications. Efforts are being made to implement the retina algorithm in FPGA devices to achieve rapid online track fitting for SEE localization, targeting processing times of 5~8 μs per event.
Review–Radiation damage in wide and ultra-wide bandgap semiconductors
. ECS J. Solid State Sci. Technol. 10,Investigating the effects of cosmic rays on space electronics
. Front. Phys. 8, 318 (2020). https://doi.org/10.3389/fphy.2020.00318Extreme atmospheric radiation environments and single event effects
. IEEE Trans. Nucl. Sci. 65(1), 432-438 (2017). https://doi.org/10.1109/TNS.2017.2761258Single event effect and its hardening technique in nano-scale CMOS integrated circuits
. Acta Electron. Sin. 46(10), 2511-2518 (2018). https://doi.org/10.3969/j.issn.0372-2112.2018.10.027Total ionizing dose effects in bipolar devices and circuits
. IEEE Trans. Nucl. Sci. 50, 539-551 (2003). https://doi.org/10.1109/TNS.2003.813133Displacement damage effects in irradiated semiconductor devices
. IEEE Trans. Nucl. Sci. 60, 1740-1766 (2013). https://doi.org/10.1109/TNS.2013.2261316Assessment of neutron irradiation effects via PKA spectra, displacement damage, and gas production: Application to reactor pressure vessel
. Nucl. Mater. Energy 37,Destructive single-event effects in semiconductor devices and ICs
. IEEE Trans. Nucl. Sci. 50(3), 603-621 (2003). https://doi.org/10.1109/TNS.2003.813137Comparison of cubesat and microsat catastrophic failures in function of radiation and debris impact risk
. Sci. Rep. 13, 385 (2023). https://doi.org/10.1038/s41598-022-27327-zThe impact of space radiation environment on satellites operation in near-earth space
. Satel. Miss. Technol. 73-90 (2020). https://doi.org/10.5772/intechopen.90115Experimental study of Single Event Upsets on deep submicron and nano devices in space
.Impact of heavy ion particle strike induced single event transients on conventional and π-Gate AlGaN/GaN HEMTs
. Semicond. Sci. Technol. 36(3),Study of single event latch-up hardness for CMOS devices with a resistor in front of DC-DC converter
. Electronics 12(3), 550 (2023). https://doi.org/10.3390/electronics12030550Experimental and simulation studies of radiation-induced single event burnout in SiC-based power MOSFETs
. IET Power Electron. 14(9), 1700-1712 (2021). https://doi.org/10.1049/pel2.12147Accelerator simulation test technology and its application for single event effect evaluation in space
. Nucl. Tech. (in Chinese) 46(08), 89-94 (2023). https://doi.org/10.11889/j.0253-3219.2023.hjs.46.080008Pulsed-laser testing for single-event effects investigations
. IEEE Trans. Nucl. Sci. 60(3), 1852-1875 (2013). https://doi.org/10.1109/tns.2013.2255312Development of single-event-effects analysis system at the IMP microbeam facility
. Nucl. Instrum. Methods Phys. Res. Sect. B 404, 250-253 (2017). https://doi.org/10.1016/j.nimb.2017.02.012Radiation-induced failures for integrated circuits in space and design philosophy
.Track reconstruction–from bubble chambers to the LHC
. Nucl. Instrum. Methods Phys. Res. Sect. A 535, 57-64 (2004). https://doi.org/10.1016/j.nima.2004.07.112A quantum algorithm for track reconstruction in the LHCb vertex detector
. J. Instrum. 18(11),Performance of the reconstruction of large impact parameter tracks in the inner detector of ATLAS
. Eur. Phys. J. C 83, 1081 (2023). https://doi.org/10.1140/epjc/s10052-023-12024-6Electron and photon reconstruction and identification with the CMS experiment at the CERN LHC
. J. Instrum. 16(05),LHCb's Forward Tracking algorithm for the Run 3 CPU-based online track-reconstruction sequence
. arXiv preprint arXiv:2207.12965 (2022). https://doi.org/10.48550/arXiv.2207.12965A fast and efficient SIMD track reconstruction algorithm for the LHCb Upgrade 1 VELO-PIX detector
. J. Instrum. 15,The data-driven future of high-energy-density physics
. Nature 593, 351-361 (2021). https://doi.org/10.1038/s41586-021-03382-wHigh Energy Physics computing for the next decade
. Nucl. Instrum. Methods Phys. Res. Sect. A 1043,High-energy nuclear physics meets machine learning
. Nucl. Sci. Tech. 34, 88 (2023). https://doi.org/10.1007/s41365-023-01233-zA deep learning approach to multi-track location and orientation in gaseous drift chambers
. Nucl. Instrum. Methods Phys. Res. Sect. A 984,Conceptual design of the HIRFL-CSR external-target experiment
. Sci. China Phys. Mech. Astron. 60,Design and tests of the prototype beam monitor of the CSR external target experiment
. Nucl. Sci. Tech. 33, 36 (2022). https://doi.org/10.1007/s41365-022-01021-1An online fast multi-track locating algorithm for high-resolution single-event effect test platform
. Nucl. Sci. Tech. 34, 72 (2023). https://doi.org/10.1007/s41365-023-01222-2Numerical optimization for Artificial Retina Algorithm
. J. Phys. Conf. Ser. 898,Study of track reconstruction using Retina algorithm for charged particles in magnetic field
.Study of the retina algorithm on FPGA for fast tracking
. Nucl. Sci. Tech. 30, 127 (2019). https://doi.org/10.1007/s41365-019-0643-xIterative retina for high track multiplicity in a barrel-shaped tracker and high magnetic field
. IEEE Trans. Nucl. Sci. 68, 1937-1943 (2021). https://doi.org/10.1109/TNS.2021.3086272A new method for directly locating single-event latchups using silicon pixel sensors in a gas detector
. Nucl. Instrum. Methods Phys. Res. Sect. A 962,Advances in nuclear detection and readout techniques
. Nucl. Sci. Tech. 34, 205 (2023). https://doi.org/10.1007/s41365-023-01359-0Monolithic CMOS Sensors for high energy physics–Challenges and perspectives
. Nucl. Instrum. Methods Phys. Res. Sect. A 1056,Developments of stitched monolithic pixel sensors towards the ALICE ITS3
. Nucl. Instrum. Methods Phys. Res. Sect. A 1049 (2023):Beam test of a 180 nm CMOS Pixel Sensor for the CEPC vertex detector
. Nucl. Instrum. Methods Phys. Res. Sect. A 1059,Simulation study of BESIII with stitched CMOS pixel detector using ACTS
. Nucl. Sci. Tech. 34, 203 (2023). https://doi.org/10.1007/s41365-023-01353-6Topmetal-II-: a direct charge sensor for high energy physics and imaging applications
. J. Instrum. 11(01), C01053-C01053 (2016). https://doi.org/10.1088/1748-0221/11/01/c01053Topmetal-M: A novel pixel sensor for compact tracking applications
. Nucl. Instrum. Methods Phys. Res. Sect. A 981,Design and preliminary characterization of a novel silicon charge sensor for the gaseous beam monitor at the CSR external-target experiment
. Nucl. Instrum. Methods Phys. Res. Sect. A 1047,The authors declare that they have no competing interests.

