Introduction
The 2016 Paris Climate Accords set the goal of limiting the increase of global temperature 1.5~22 ℃ higher than pre-industrial levels [1], which calls for rapid action in carbon-emission curtailment. Nuclear-power generation is crucial for achieving net-zero emission goals [2, 3]. Advanced reactors and small modular-reactor technologies, including molten salt reactors (MSRs), are being pursued globally to overcome the economic issues associated with large conventional nuclear reactors [2, 4]. Molten fluoride or chloride salts are used as the primary coolants in MSRs, providing improved safety and thermal characteristics [5, 6].
In liquid-fueled MSRs, fissile and fertile materials (235U, 233U_232Th, and Pu from spent fuel) are dissolved in fuel salt and circulated in the primary loop [7-10]. Several types of moderators have been considered for thermal-spectrum MSRs, including graphite [11], liquid sodium hydroxide [12], and heavy water [13, 14]. The flowing fuel salt in MSRs enables unique features, such as intrinsic safety against core melting, passive reactor shutdown through the frozen valve, online refueling, and the online removal of fission products [15]. Online refueling and fission-product removal features can enable the flexible operation of MSRs, which will become increasingly valuable as intermittent generation increases on the grid [11, 16, 17]. The flexible operation of MSRs is facilitated by xenon removal. 135Xe is the major thermal neutron poison produced during reactor operations, whereas other unstable xenon isotopes (mainly 133Xe and 131mXe) are important radioactive sources [18, 19]. Xenon and its relatively insoluble gaseous fission products readily escape from the fuel salt at the salt–gas interface. In the MSRE, the salt–gas interface includes the free surface and droplets in the pump bowl, as well as bubbles circulating through the primary loop [11, 20].
For the flexible operation of MSRs, efficient and robust control schemes are required to minimize the engagement of control rods during frequent power variations. Such a control scheme should ideally incorporate nonlinear feedback effects from temperature, flow, voids, and xenon transport in the reactor. However, because of the differences between MSRs and solid-fueled reactors, conventional system-analysis codes are not readily applicable for studying coupled effects in MSRs [21-25]. Major problems arise from the circulation of delayed neutron precursors (DNPs) for short-term simulations [25] and the behavior of fission products for long-term calculations [26, 27]. For system analysis, the neutron kinetics of MSRs can be described by the modified point-kinetics equations1 (mPKEs) [25, 28, 29]. The studies by Dulla et al. [30] and Wooten and Powers [25] provide a rigorous derivation of the mPKEs for liquid-fueled reactors. The separation of noble gases and metals from fuel salts must be considered in long-term simulations [31].
In earlier studies, the authors developed a coupled xenon-transport model to study xenon behavior and xenon-removal systems in MSRs using Simulink/MATLAB [11, 32]. The model was validated using xenon-poisoning data from the MSRE [18]. The coupled model tracked the transport of isotopes, heat, and momentum in typical MSRs. In addition, neutron kinetics in the reactor were modeled using mPKEs. In this study, the coupled model was extended and validated against various dynamic testing data from the MSRE [33-35] to demonstrate its capability for plant dynamic simulations. Compared with existing dynamics studies, the current model adds the capabilities of void transport and xenon transport. This feature is exploited to study the influence of xenon transport, void transport, and decay heat generation on the dynamic characteristics of the MSRE. Furthermore, the plant responses during unique operational events are investigated.
Review on MSR Dynamic Simulations
As discussed in the previous section, the differences between MSRs and solid-fueled reactors prevent the direct application of the existing system-analysis codes. Sustained efforts have been made in recent years to extend the existing system-analysis codes or develop alternative codes to study the plant dynamics of MSRs. Selected studies are reviewed in this section.
Krepel et al. [36, 37] developed the DYN1D-MSR and DYN3D-MSR codes to study MSR dynamics. In the DYN1D-MSR code, the multigroup neutron-diffusion equations are solved in the core using nodal-expansion techniques, whereas the one-dimensional (1D) transport equations of the DNPs are solved in the entire primary loop. The thermal hydraulics of the reactor were also modeled. The reactivity data during the pump startup and coast-down in the MSRE zero-power experiment were used to validate the neutronics predictions [38]. The coupled model was validated against the thermal-convection test in the MSRE [39]. In the DYN3D-MSR code, the 3D neutron flux is solved using nodal-expansion techniques, whereas the DNPs are treated using 1D transport equations.
Cammi et al. [40] studied the dynamics of the Molten-Salt Breeder Reactor using COMSOL multiphysics code. Two-group neutron-diffusion equations are used for the neutronics. The distribution of DNPs inside the core was resolved, and their decay outside the core was estimated using an exponential function with a fixed loop transit time. They subsequently studied MSRE plant dynamics using mPKEs with 1D lumped DNP transport equations [41]. In the 1D DNP transport equations, the axial distribution of DNPs inside the core was calculated using the prescribed neutron-flux profile, which was then linearly integrated to yield the total number of DNPs for use in the mPKEs. The responses of the MSRE plant following reactivity insertion and its power-to-reactivity frequency response are presented. Zanetti et al. [42] coupled the COMSOL multiphysics model with mPKEs solved in Simulink. The mPKEs were used to provide power and DNP sources, whereas the multiphysics model solved the neutron-diffusion equation in the reactor to produce the shape function, which was used to update the weighted mPKE parameters. The simulation and experimental results were in good agreement for the reactivity insertion transient and power-to-reactivity frequency responses. He et al. [43] developed a 3D thermal-hydraulics model of a graphite-moderated channel-type MSR with mPKEs and 1D DNP transport equations using COMSOL.
Diniz et al. [44] studied the dynamics of a conceptual 1D reactor with coupled neutron diffusion and mPKEs. The multigroup neutron-diffusion code was used to update the importance-weighted parameters in mPKEs. The results of the coupled and noncoupled simulations were compared with the theoretical results. The coupled simulation can better capture reactor oscillations resulting from flowrate changes because changes in the importance profiles of DNPs were captured.
Zhang et al. [29] and Guo et al. [45] studied the dynamics of the MOSART reactor using mPKEs with in-house code. The lumped DNP transport equations for the in-core and out-core volumes were solved. The pump startup and coast-down transients in the MSRE were used for validation [38]. Subsequently, Zhang et al. [46] developed a spatial-kinetics model, in which 2D two-group neutron-diffusion equations were solved together with DNP transport equations. The decay of DNPs outside of the core was approximated using an exponential function. The results were compared with the standard PKEs and mPKEs using weighted parameters obtained from a 2D neutronics simulation.
Zhuang et al. [47] developed an in-house code, MOREL, to study the neutronics in the MSRE. The code includes 3D neutron multigroup diffusion equations with transport equations for DNPs. The decay of the DNPs outside the core was modeled using an exponential decay function. The pump startup and coast-down transients in the MSRE were used for validation [38]. Subsequently, the code was extended to study the dynamics of TMSR-LF [48]. Zhou et al. [49] studied the 1D distribution of fission products and the associated radioactivity in the primary loop of TMSR-LF using the in-house code MSRFP.
He [50] modified TRACE to study the dynamics of the MSRE. The mPKEs are implemented using the so-called “circuit-solver” method. The model was applied to simulate the reactivity insertion transients in the MSRE. Notably, the “circuit solver” tends to cause numerical instability. Hanusek and Juan [51] applied TRACE to study power and temperature distributions in the MSRE, and mPKEs were included using the method proposed by He [50].
Shi et al. [52] extended the RELAP5/MOD4.0 code to include mPKEs with reference to the formulation by Guo et al. [45]. The extended code was validated against pump startup and coast-down transients [38] as well as the thermal-convection test in the MSRE [39]. Chen et al. [17] used modified RELAP5 code to study the load-following characteristics of a conceptual MSR. Li et al. [53] improved mPKE modeling in the modified RELAP5 code by including 1D DNP transport equations, where the DNP distributions inside the core were resolved. The improved model could better capture the reactivity change during pump startup and coast-down transients in the MSRE [38]. Comparisons were also made using reactivity insertion [34] and thermal-convection tests [39].
The advanced system-analysis code SAM, developed by Argonne National Laboratory, is under active development and has been coupled with other codes for MSR applications [54, 55]. A 2D model of the MSRE was built, and its coupled solution capability was demonstrated [56]. In the MSRE model, the neutron-transport equations were solved by Griffin, whereas the transport equations of the DNPs, energy, and momentum were solved by SAM. Salko et al. [57] added a gas-transport model to SAM, and the drift-flux model was used to account for the slip velocity between the phases. Yang et al. [58] coupled the PROTEUS neutronics code with SAM using the MOOSE framework. The results were compared with the pump startup and coast-down transients [38] and the thermal-convection test in the MSRE [39].
In addition to in-house and traditional system-analysis codes, Simulink/MATLAB has been actively used to model MSRs, owing to its extensibility and comprehensive built-in libraries. Singh et al. [59-62] utilized Simulink to perform a series of modeling studies on the dynamics of MSRs. The mPKEs used by Kerlin et al. [28] were adapted for the model, and thermal hydraulics were considered using customized lumped-parameter models. The dynamic model was validated against the frequency response and reactivity insertion data from the MSRE [59]. Pathirana et al. [63, 64] extended the Simulink model to include decay heat generation and considered the influence of fuel depletion using a predefined depletion table. Dunkle et al. [65, 66] studied the effect of xenon removal on the load-following performance of the NERTHUS reactor design with an open-loop control scheme. The general plant dynamics of NERTHUS were studied using an established Simulink model. Price et al. [67-69] used Simulink to study the behavior of xenon in MSRs, together with plant dynamics. Huang et al. [70] used Simulink to study the dynamics of an MSR coupled with an air-steam combined cycle.
Modelica-based codes were utilized for similar reasons to Simulink/MATLAB. A Modelica-based library for MSRs, called TRANSFORM, was developed by the Oak Ridge National Laboratory [71]. The library was used by Greenwood et al. [71] to model the Molten-salt Demonstration Reactor. The model included the general thermal–hydraulics components of the primary and secondary systems. The transport of fission products and DNPs was included using the “trace-substance approach,” and the reactor dynamics were modeled using mPKEs. A simplified model of the off-gas system was also included, in which the concentrations of the fission products in the system were calculated. A code-to-code comparison between the Simulink and Modelica models of the MSRE was made by Pathirana et al. [72]. Fischer and Bures [73] applied Modelica and the TRANSFORM library to study the MSRE dynamics. The core neutronics were modeled using mPKEs, whereas the axial power distribution was modeled using a predefined profile. The 1D DNP transport equations were solved, and their contribution to the mPKEs was evaluated using the steady-state adjunct flux. The model predictions were validated against the pump transient, reactivity insertion, and frequency response of the MSRE [34, 38].
Description of the Coupled Model of the MSRE
In a previous study, the authors [32] developed a Simulink/MATLAB model to study the behavior of xenon in the MSRE. Lumped-parameter models were constructed for the pipes, heat exchangers, xenon-removal-system components, and reactor cores. The conservation equations for the void, heat, momentum, and fission products were solved using the coupled model. The reactor dynamics were modeled using mPKEs [28]. In this study, the forementioned MSRE model was extended and modified as follows.
• The secondary loop of the MSRE is included to model the plant response.
• Model parameters for 233U fuel are added.
• The decay heat generation across the primary loop is modeled.
• The void reactivity effect is added. The feedback effects are calculated using nuclear importance-weighted parameters.
• The implementation of mPKEs is overhauled. The effect of fuel circulation on delayed neutron generation is considered by explicitly modeling the transport of DNPs.
General Description of the Simulink Model
The general structure of the model is based on a previously developed model [32]. The model was open-source on GitHub, where the exact implementation can be obtained. In this subsection, a brief introduction is provided to the major governing equations, constitutive relations, and changes made to the previous models. The important system parameters used in the MSRE model are summarized in Table 1.2 The components of the coupled model are illustrated in Fig. 1.
| Terms | Specifications | Ref. | |
|---|---|---|---|
| Salt Specifications | 235U fuel salt composition | 7Lif- Bef2- ZrF4- UF4 |
[8] |
| 233U fuel salt composition | 7LiF- BeF2- ZrF4- UF4 |
[75] | |
| Density | [76] | ||
| Viscosity | [77] | ||
| Specific heat capacity | [8] | ||
| Thermal conductivity | [78] | ||
| Reactor | In-core fuel volume | 0.708 [m3]; 25 [ft3] | [79] |
| Graphite heat capacity | [28] | ||
| Plenum, downcomer & flow distributor volume | 0.8552 [m3] | [79] | |
| Fission energy in salt | 93.4% | [80] | |
| Graphite-fuel overall heat-transfer coef. | [28] | ||
| Fuel Pump | Discharge rate | [79] | |
| Bypass to pump bowl | [79] | ||
| Pump bowl volume | 60% filled | [31] | |
| Pump volume | [79] | ||
| PHX | Nominal fuel inlet temperature | [79] | |
| Nominal coolant inlet temperature | [79] | ||
| Nominal power | [79] | ||
| Fuel volume | [79] | ||
| Piping | Total volume | [79] | |
| Coolant Loop | Total coolant volume | [33] | |
| Coolant heat capacity | [81] | ||
| Coolant salt density | [81] | ||
| Flow rate | [79] |
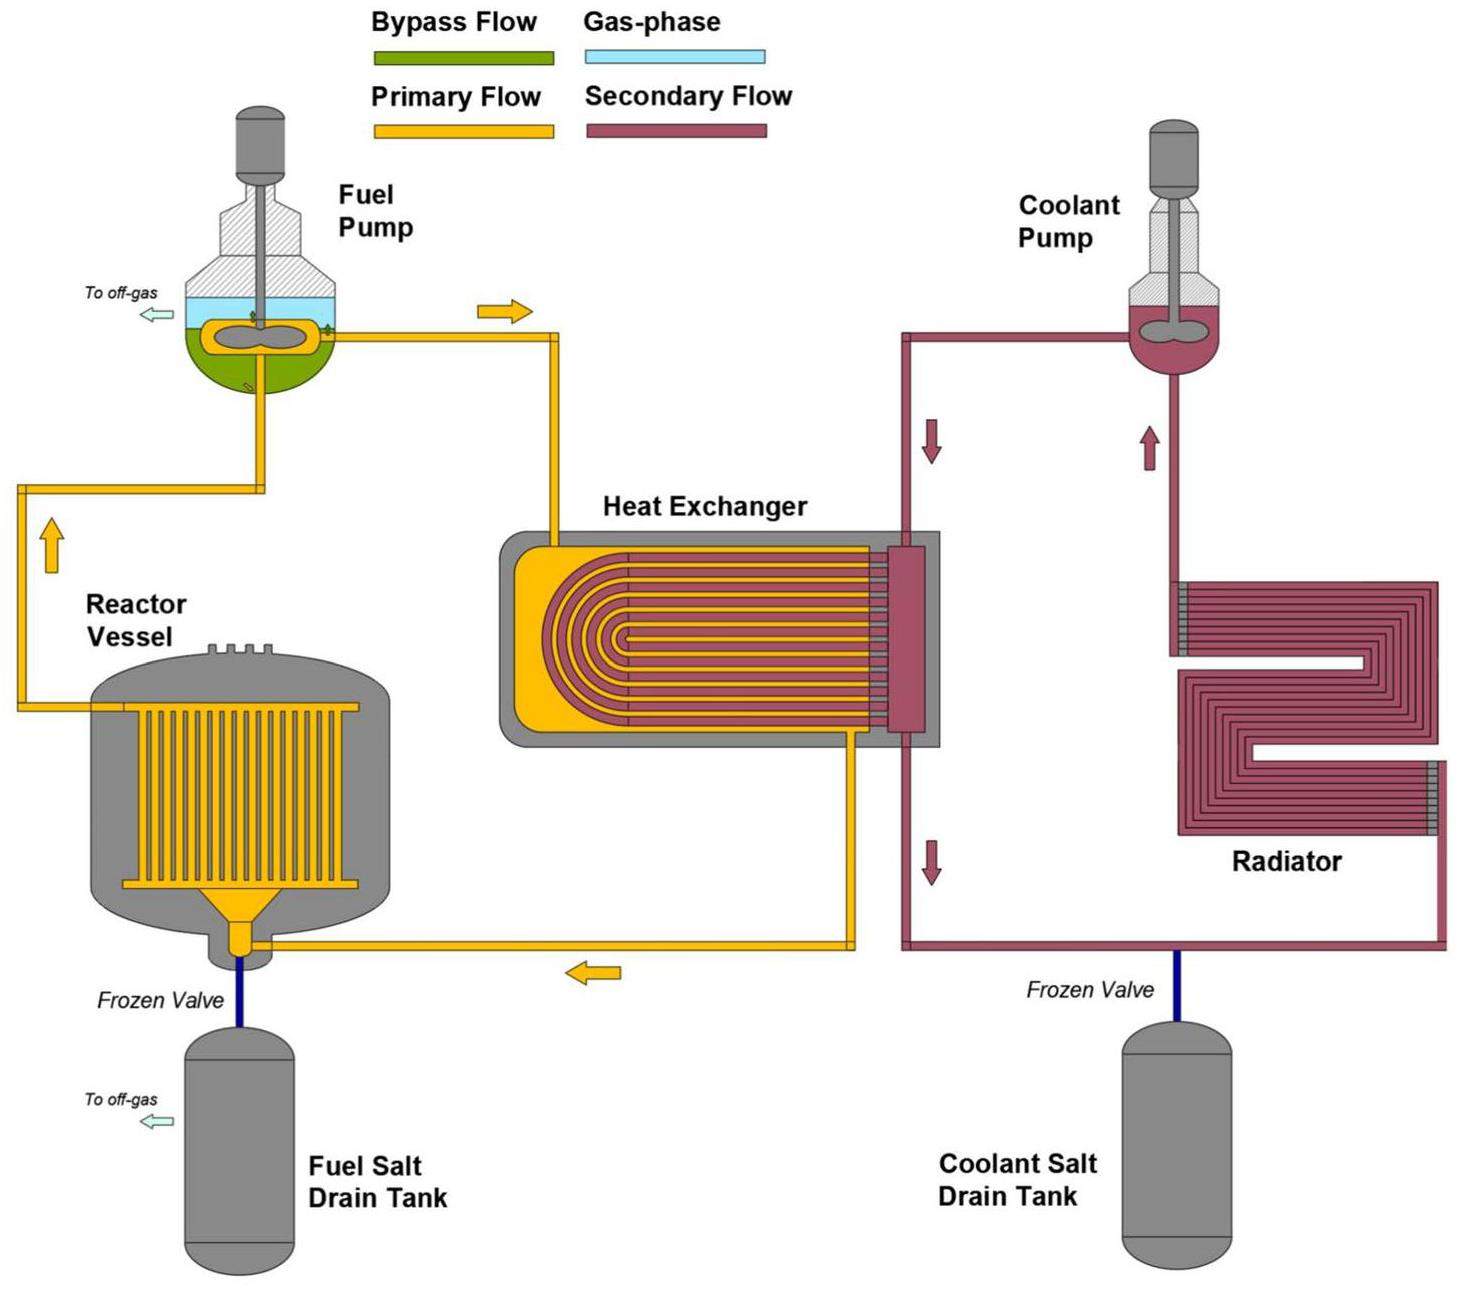
The Simscape toolbox in Simulink was used to provide building blocks for the thermal-hydraulics modeling of the reactor. Descriptions of the Simscape components are readily available in the Simulink/MATLAB documentation. Therefore, a detailed discussion of the individual components is omitted. The overall decay heat-generation rate was modeled using three decay heat-precursor groups with reference to the study by Pathirana et al. [63], and the heat generation in each lumped volume was explicitly calculated.
The transport models for xenon and void fractions were developed in a previous work [32]. The complex xenon and void-transfer processes in theMSRE pump bowl were modeled using semi-empirical equations. The diffusion of xenon inside the core graphite, transfer of xenon between the phases, and dissolution of entrained bubbles were described using theoretical and semi-empirical models. The xenon balance equations for a general lumped volume are as follows:
The gas/void transport is based on volume conservation and the homogeneous equilibrium model. The gas and fuel salts were assumed to move at the same velocity. The solubility of the inert gas bubbles was considered using an algebraic model based on experimental data obtained during the MSRE [20, 32].
Modified Point-kinetics Equations, Core Nodes, and Feedback Effects
In the current model, the implementation of mPKEs and the calculation of reactivity feedback effects are modified in comparison with the previous study [32]. The modifications are discussed in this subsection. The neutronics and feedback parameters used for different fuel types are summarized in Table 2.
| Parameters | 233UFuel | 235UFuel | |
|---|---|---|---|
| PKE | Decay constant, |
[0.0126, 0.0337, 0.139, 0.325, 1.13, 2.5] | [0.0142, 0.0305, 0.111, 0.301, 1.14, 3.014] |
| Yield, |
[2.3, 7.9, 6.7, 7.3, 1.3, 0.9] | [2.23, 14.57, 13.07, 26.28, 7.66, 2.3] | |
| Generation time, |
4×10⁻⁴ | ||
| Feed. | Graphite temp., |
-5.814×10⁻⁵ | -6.66×10⁻⁵ |
| Fuel temp., |
-11.034×10⁻⁵ | -8.712×10⁻⁵ | |
| Core void, |
-0.45 | -0.18 |
In MSRs, fuel salt circulates in the primary loop. Thus, the DNPs were transported out of the core. Thus, some of the delayed neutrons were lost during the transit time across the primary loop. Moreover, the physical and adjunct neutron fluxes and DNP-concentration profiles varied under the fuel-salt flow. Therefore, a modification of the point-kinetics equation derived for solid-fueled reactors is required. A rigorous derivation of mPKEs can be found in Dulla et al. [30, 85]. However, such a rigorous approach can only be realized by coupling a neutronics code to the system-analysis model, which significantly increases the simulation time. Instead, in the current study, the classical model by Kerlin et al. [28] is selected as the starting point. The model was developed during the MSRE and has been calibrated using various dynamics testing data obtained from the experiments. Therefore, even though this model was derived without considering the importance of DNP, it was in good agreement with the experiments. The original model proposed by Kerlin et al. [28] is
In this study, Eq. (6) is replaced with a series of lumped conservation equations for DNPs. For each lumped volume, the following equation is solved:
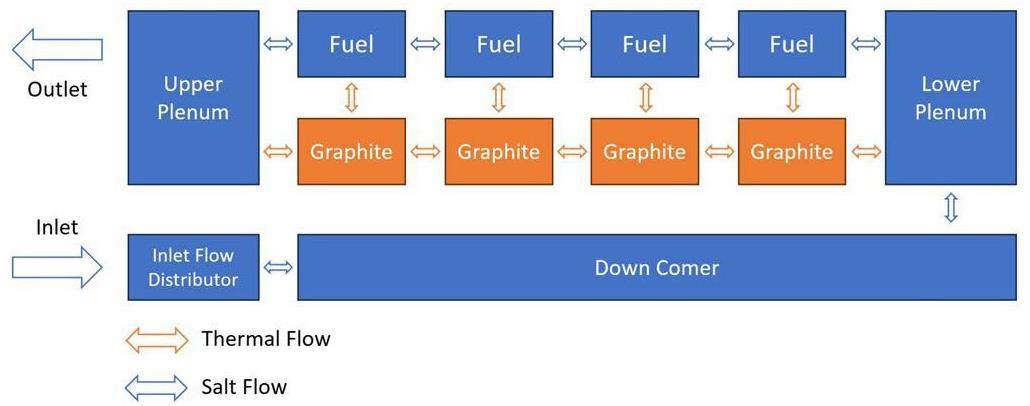
The thermal-hydraulics nodal diagram of the reactor is shown in Fig. 2, which includes the upper plenum, lower plenum, downcomer, inlet-flow distributor, and four linear core nodes. The axial heat conduction between the graphite nodes and plenums was included, whereas the radial conduction was neglected. The axial-power profile and nuclear-importance profile used to calculate the feedback effects were taken from Haubenreich et al. [80].
Model Validation against MSRE Dynamics Tests
In this section, the coupled model is validated against various dynamics-testing datasets from the MSRE. The frequency and transient responses of the coupled system model are investigated.
Frequency Response
The frequency response of a dynamic system is its response to a sinusoidal input signal in the frequency domain. The different frequency responses of the system can be defined based on the selected input and output signals. The frequency response can be measured experimentally, which provides valuable information for controller design and stability analysis [86]. Moreover, frequency analysis is useful for the experimental determination of reactivity-related parameters [38, 86, 87]. During the MSRE operation, multiple dynamics-testing experiments were conducted to obtain the frequency responses of the reactor power to reactivity disturbances [33, 34]. These tests were conducted at different steady-state power levels for both 235U and 233U fuels.
Because the coupled MSRE model is highly nonlinear, the frequency response cannot be obtained from a derived transfer function, as in a linearized model. Numerical experiments are conducted to determine the frequency response of the coupled MSRE model. For each condition, the simulation was first run for three days to reach steady-state xenon distributions, while the reactor was maintained at a critical condition using a PI controller. The PI controller was disabled, the final reactivity insertion was recorded, and the steady-state solution was saved. Using the steady-state solution as the starting point, sinusoidal reactivity signals of different frequencies were introduced into the system, and the simulations were run for a minimum of ten cycles or 1500 s. The cross-power spectral density between the neutron density and reactivity signals was calculated and divided by the power spectral density of the reactivity signals. The outcome is a function in the frequency domain owing to the finite simulation time. The values of the signal frequencies form the frequency responses of the system.
For the 235U fuel, the simulated frequency responses at three different power levels are presented and compared with the experimental data [33] in Fig. 3 and Fig. 4. Different methods were used to obtain the frequency response in the dynamics-testing experiments. The results from the different methods are not distinguished in the current study, and the spread of data points may be considered as experimentally uncertain. Based on the results, a general agreement was reached between the simulation and experiment, which suggests that the coupled MSRE model can capture the reactor behavior under small reactivity disturbances. Cammi et al. [88], Guerrieri et al. [89], and Henderson and Ragan [90] performed theoretical analyses of circulating fuel reactors from a transfer-function perspective using mPKEs. The conclusions and equations from these studies are used to aid in further discussions on the results.
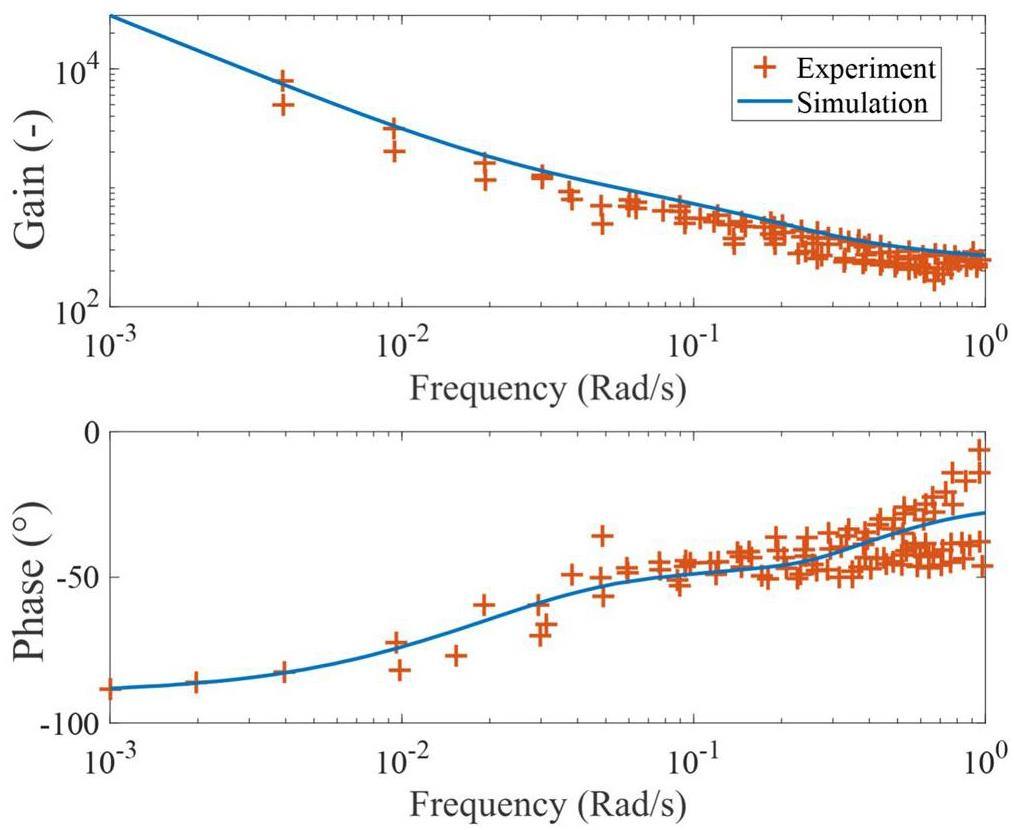
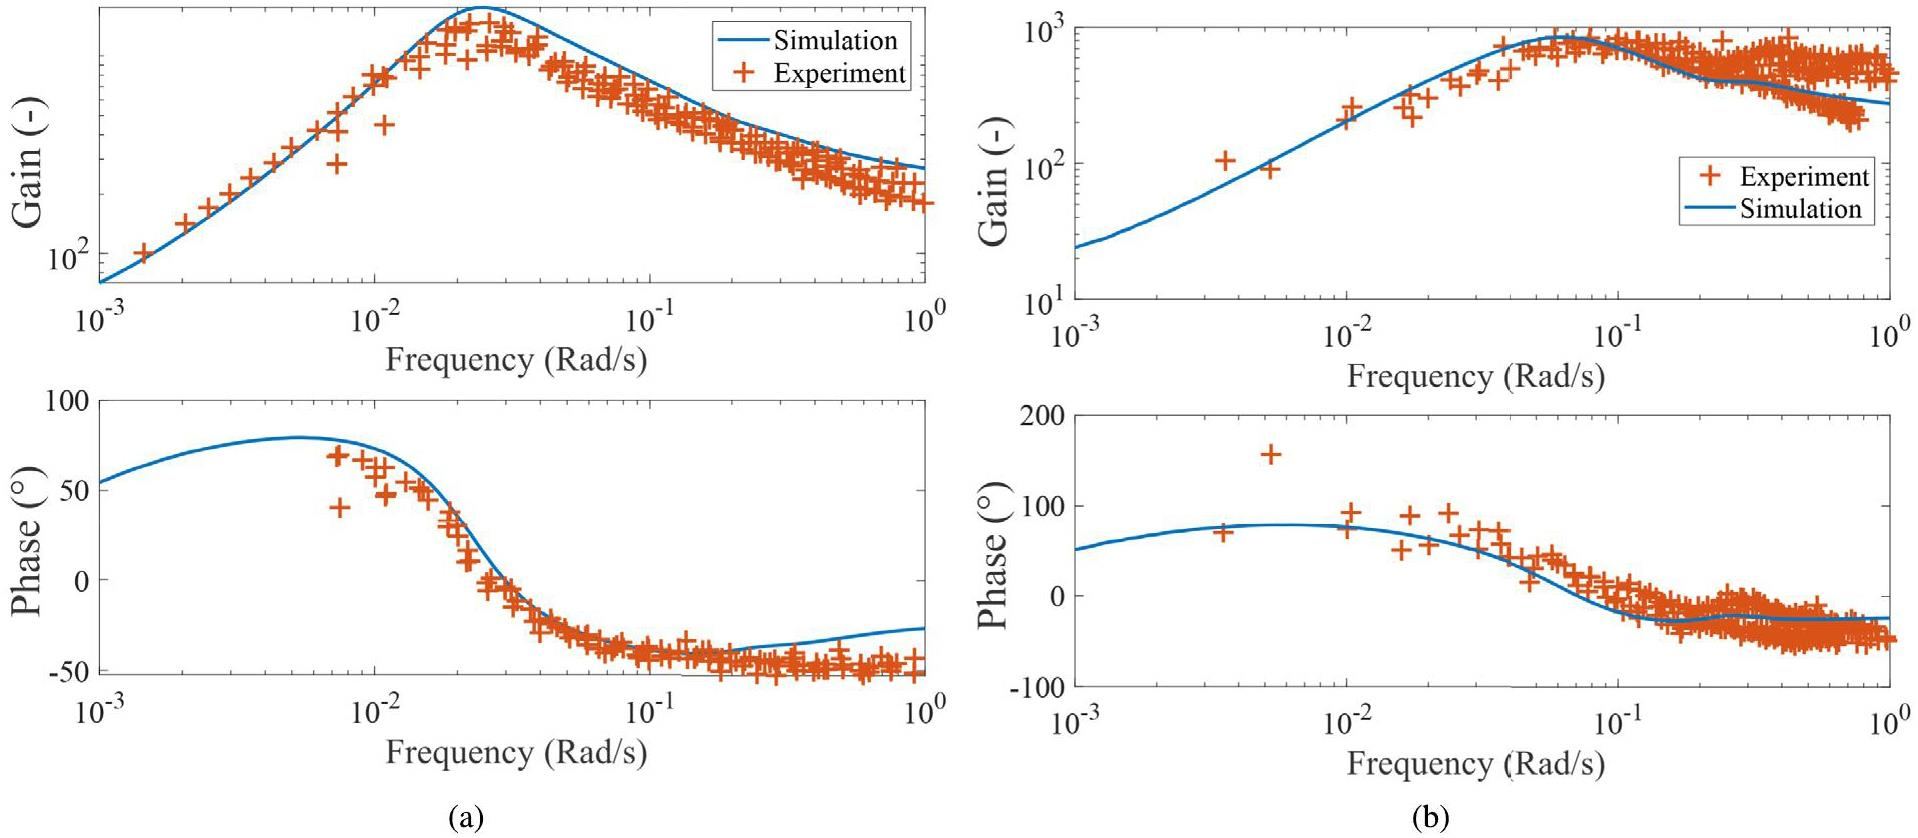
Figure 3 illustrates the reactor response at zero power. This condition is of special interest because the thermal and poisoning feedback effects are absent. For solid-fueled reactors, the frequency response at zero power is dominated by neutronics models. For MSRs, the flowrate in the reactor also plays a significant role. For low frequencies, the response of the reactor G(jw) is approximated by
When the reactor is powered, feedback effects from temperature and xenon poisoning occur, and the frequency response of the reactor is complicated. When considering only the thermal feedback with an averaged core temperature, the neutron-temperature feedback transfer function can be defined as
Another characteristic of the frequency response can be observed by rearranging Eq. (11) as follows:
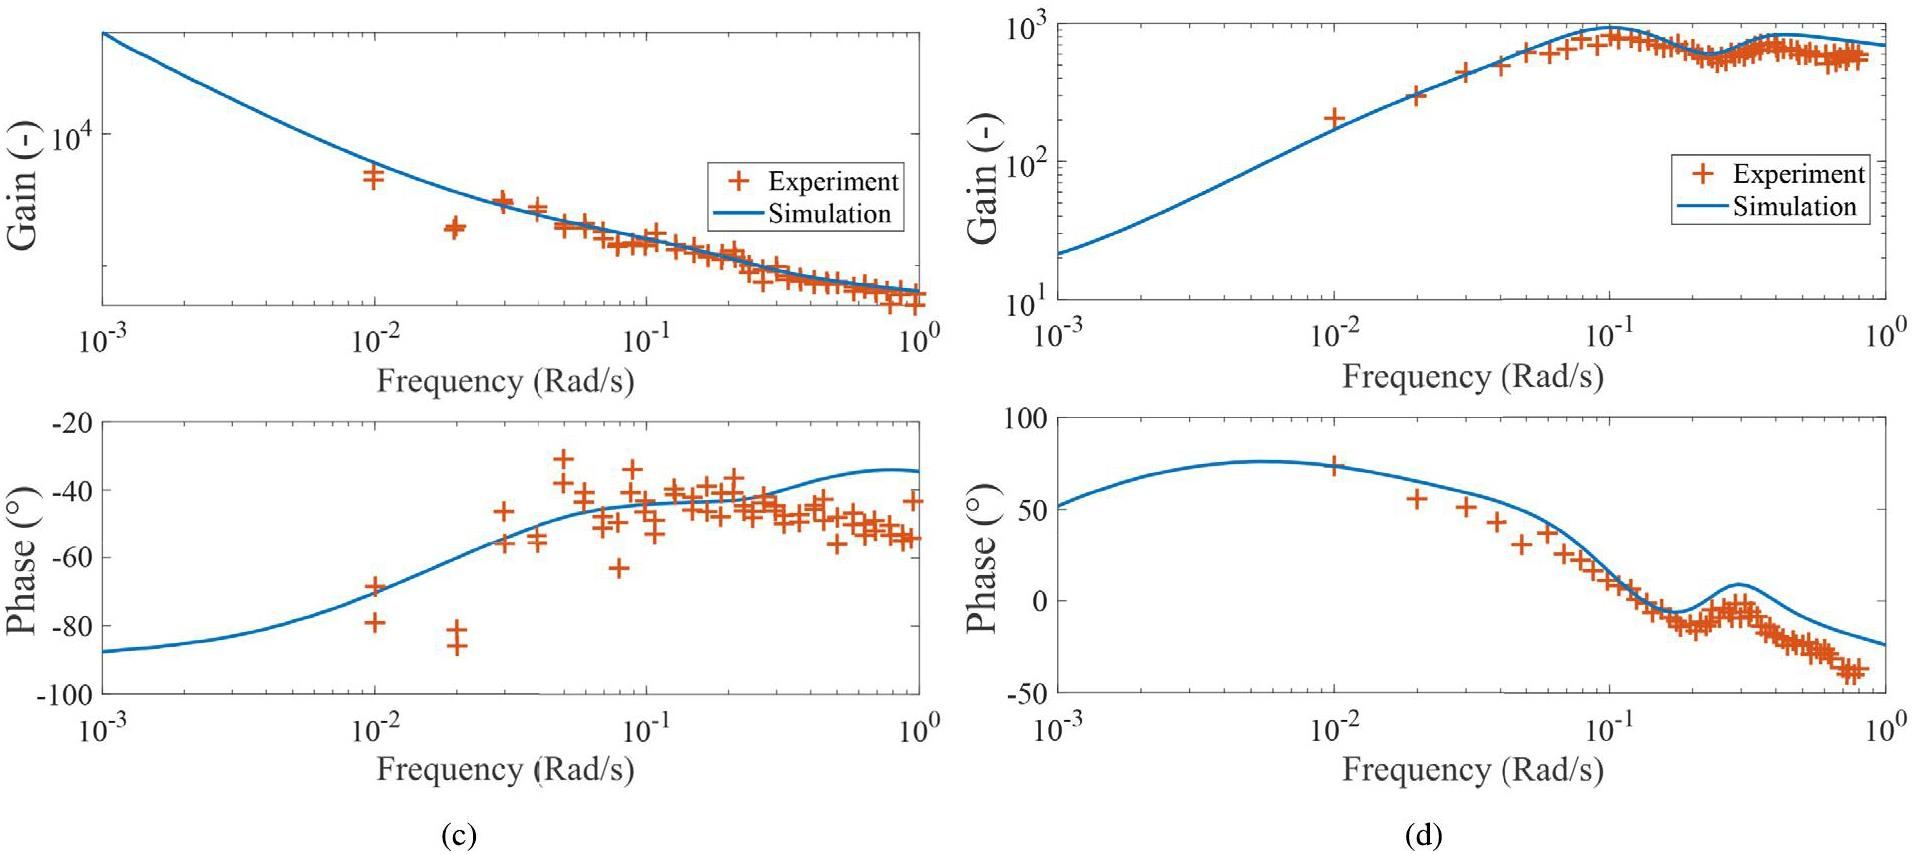
In Fig. 5, the frequency response for the 233U fuel is shown, which possesses shapes similar to the frequency response for 235U fuel. Again, good agreement is observed between the simulation and experiment. The gain of the reactor is generally increased for the 233U fuel compared with the 235U fuel, indicating that it is less stable. Moreover, a dip near 0.23 rad/s is again observed and is more prominent than that with the 235U fuel.
In Fig. 6, the frequency responses of core-outlet-temperature to rector-power from the simulations and experiments are presented. The frequency response obtained directly using the core-outlet temperatures deviated from the experimental data, especially at higher frequencies. The same problem was noted in the report by Steffy [34], in which the dynamic model used during MSRE could not capture the result. The larger deviation at higher frequencies suggests that the source of disagreement is the temperature measurement itself. Thermocouples were used during the MSRE for temperature measurements, which has non-negligible response times. The response time mainly originates from the thermal inertia and heat-transfer conditions in the measurement system. A heuristic transfer function between the thermocouple measurement and surrounding flow temperature is derived from the one-dimensional heat-conduction equation in the Appendix as follows:
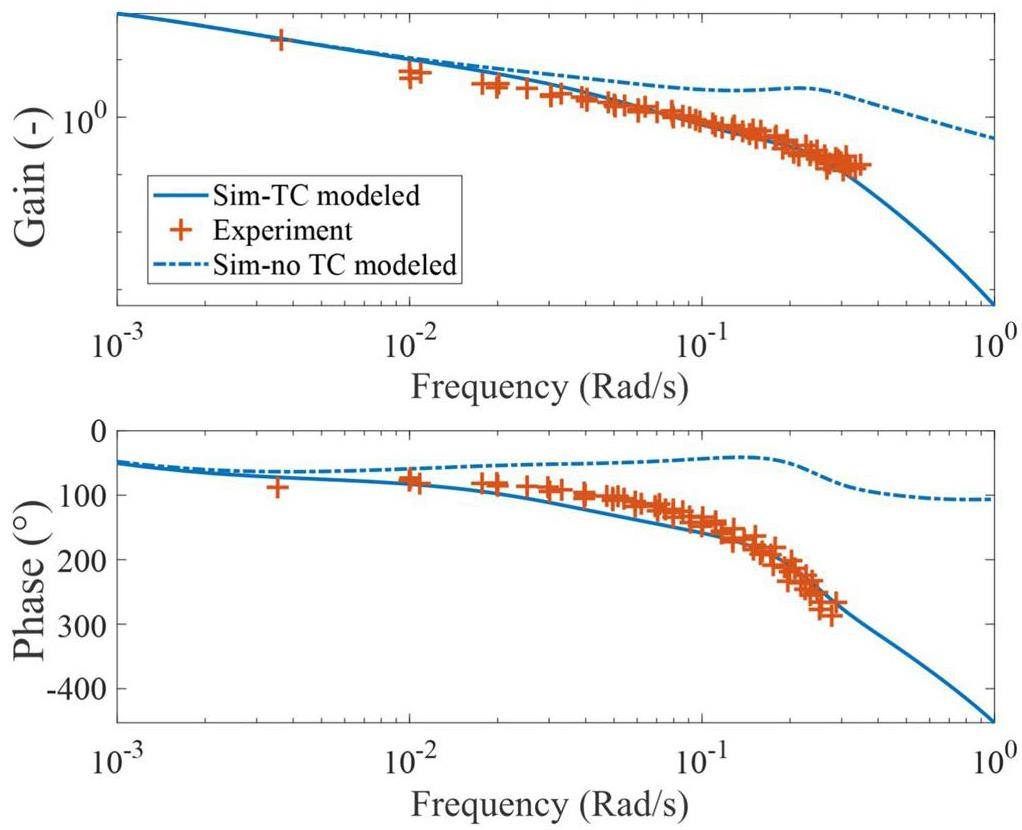
The thermocouple-sheath material used in the MSRE is Inconel, and the thermocouple is placed in the fuel salt using the so-called “INOR-8” lug [92]. The properties of Inconel 718 are used in Eq. (13). The heat-transfer coefficient is estimated using the following empirical correlation [93]:
In conclusion, the current coupled model can generally predict the frequency response of the MSRE at zero power and elevated power levels for both the 235U and 233U fuels. No significant difference was observed between the two fuel types in terms of system frequency responses. The good agreement at zero power validates the neutronics model. Moreover, the thermal-hydraulics modeling adopted in this study was validated using the temperature-to-power frequency response.
Transient Response
In the previous subsection, the system frequency responses obtained from the experiments and simulations were compared. Although the frequency response is a useful representation of system behavior, it does not have a direct link to the transient response of the reactor. In this subsection, the coupled model is validated against multiple transient experiments in the MSRE.
In the zero-power physics experiment of the MSRE, the transient responses during pump startup and pump coast-down are measured [38]. At zero power, feedback effects from thermal and fission product poisoning are absent, and the system response is dictated by the neutronics and hydraulics characteristics of the reactor system.
In the pump-startup experiment, the reactor was initially critical, whereas the pumps were idle. At the start of the experiment, the pumps were turned on and a salt flow was established. This procedure was reversed in the pump coast-down experiment. An automatic reactivity-control system was used to maintain the criticality of the reactor. The control-rod locations, pump speeds, and coolant flowrate were recorded. Unfortunately, the fuel-salt flowrate was not available. In the simulation, a hyperbolic tangent function was used to approximate the flowrate in the primary loop.
The simulations of the pump transients are compared with the experimental data in Fig. 7. Two simulation approaches are applied. In the first approach, depicted by the blue line, the reactor is assumed to remain perfectly at criticality, and the neutron density does not change. In the second approach, indicated by the purple line, a simple proportional controller is introduced as an approximation of the automatic control system employed in the MSRE. A sampling frequency of 40 Hz is used for the neutron-density measurement. The proportional parameter is set as -50 pcm percent neutron fraction. The maximum reactivity-change rate was limited to 25 pcm/s, matching the control-rod specifications in the MSRE [94].
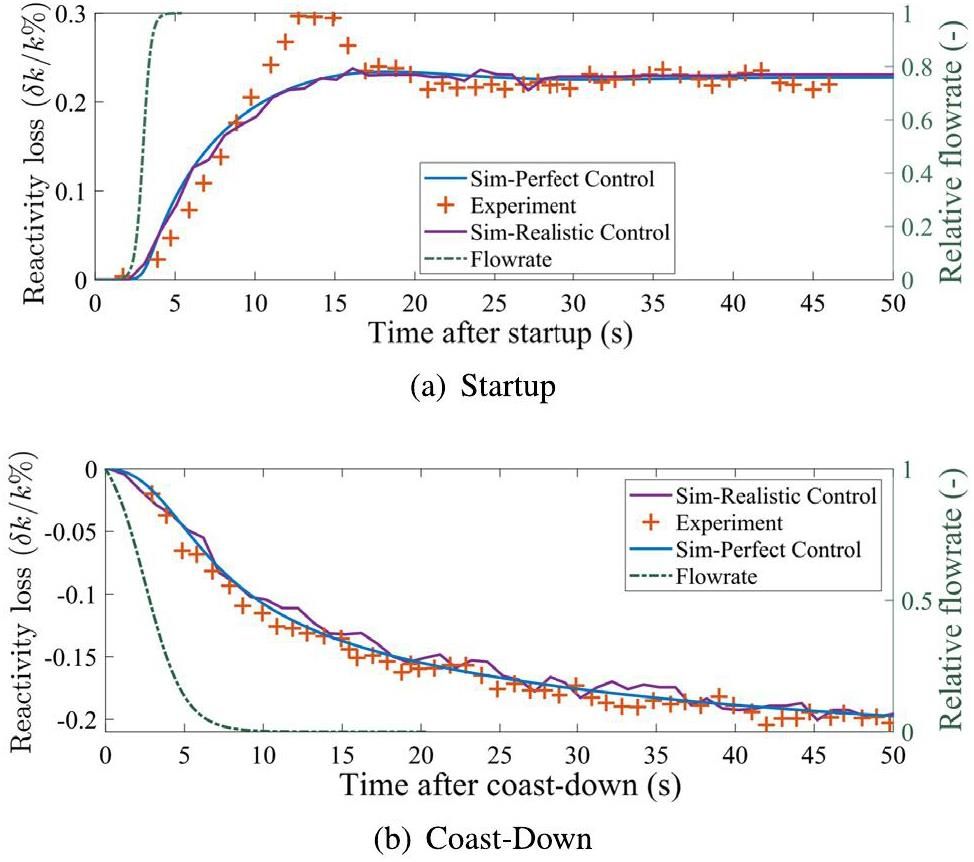
Figure 7a presents the simulation results for the pump-startup transient. Both simulation approaches predict the steady-state reactivity loss accurately but fail to predict the initial reactivity peak. The peak observed at approximately 15 s is related to the out-of-core circulation time. The simulation with the proportional controller exhibits the fluctuating behavior observed in the experiment, suggesting that such fluctuations may be related to the control system in the MSRE. Fig. 7(b) shows a comparison of the pump coast-down transient. Both simulation approaches capture the general trend of the reactivity change, whereas the PI controller helps reproduce short-period fluctuations.
Both simulation approaches failed to capture the reactivity peaks shown in Fig. 7(a), which requires further discussion. In studies by Guo et al. [45] and Shi et al.[52], the simulated reactivity loss also failed to match the reactivity peak. In these studies, mPKEs were used with a homogeneous DNP distribution in the core, as in the current study. In contrast, in the work by Fischer and Bureš [73], the mPKEs were solved together with 1D DNP-transport equations, and the delayed neutron-generation term was weighted using the steady-state adjunct flux and power profile. Consequently, a long-period fluctuating behavior in the startup transient is observed. Considering the differences in the models, the disagreement between the current simulation and experiment during the startup transient may be related to the homogeneous treatment of DNPs inside the core. This smears the sharp reintroduction of delayed neutrons to the core center, where neutron importance is highest.
Figure 8 shows the reactor power following a 19 pcm reactivity insertion at an initial power of 5 MW. The reactor power quickly increases after reactivity insertion in the first few seconds. Subsequently, as the temperature of the core increases, the feedback effect offsets the added reactivity. The net steady-state result shows a slight increase in reactor power. The simulation results generally agree with the experimental data. In the simulation, the initial power peak is slightly overestimated, and slow fluctuations in the power profile are not observed. Notably, during the experiments with the 233U fuel, notable neutron noise is observed owing to the circulating bubbles. Circulating bubbles are considered as the major source of the observed fluctuations [34], which are not modeled in the current study.
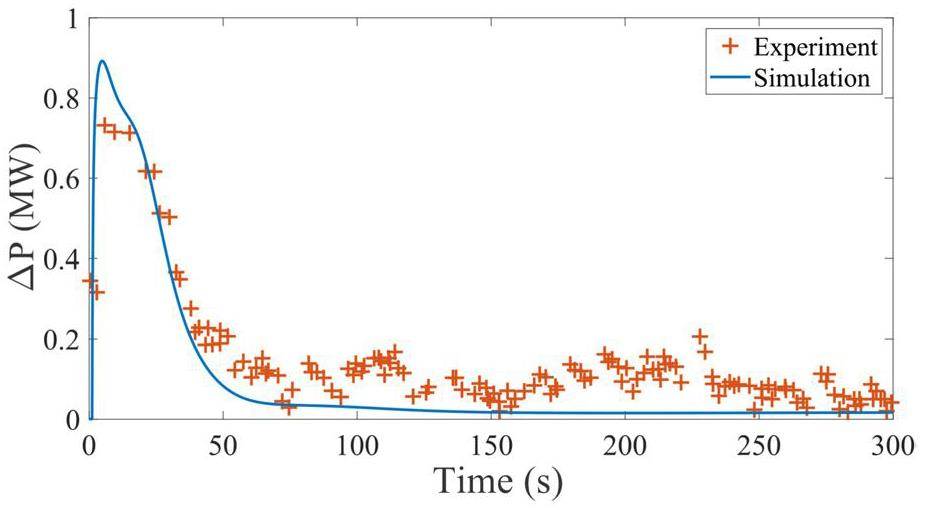
In conclusion, the current coupled model could predict the transient response of the MSRE under both zero-power and operational conditions. However, the mPKEs employed in the current study may require improvements to capture sharp transient behaviors and short-period fluctuations.
Model Applications
In the previous sections, the coupled model was validated against the experimental dynamic data from the MSRE. In this section, the model is applied to study the unique dynamic characteristics of the MSRE. Moreover, a sensitivity study of the frequency response to the plant parameters is performed.
Power-to-flowrate and Void Frequency Reponses
In the previous section, the power-to-reactivity frequency response of the MSRE, which is of general interest in reactor control and stability analysis, was thoroughly investigated. In this section, two other types of frequency responses unique to MSRs are investigated.
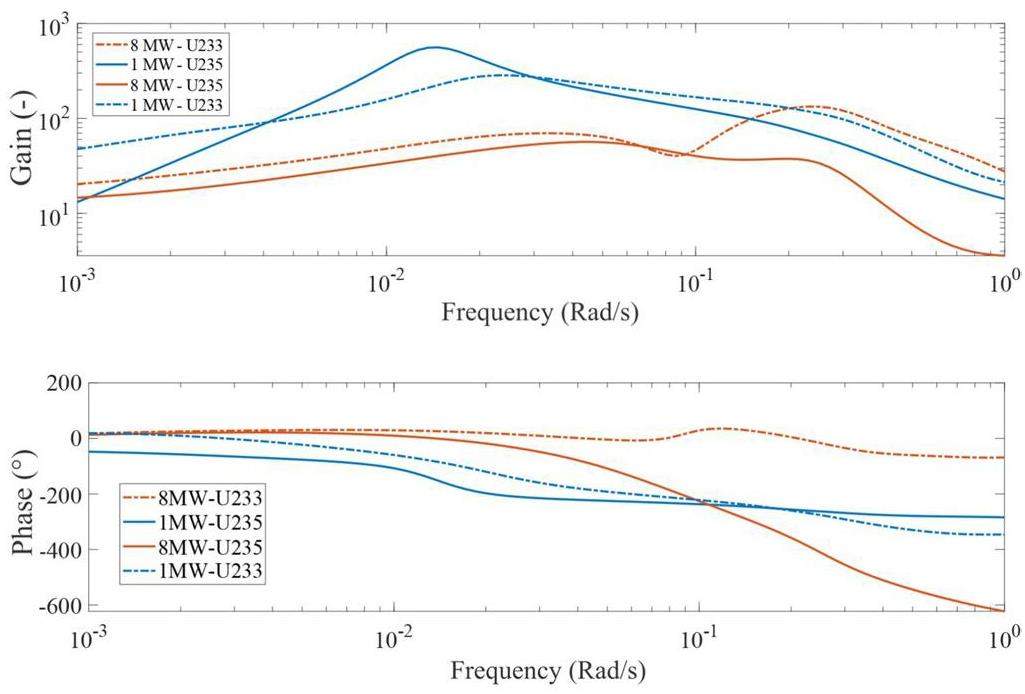
Figure 9 shows the power-to-flowrate frequency responses at different reactor-power levels and fuel types. The gain and flowrate are normalized to the operational parameters. The gain in Fig. 9 exhibits two peaks. The first peak corresponds to the resonant or natural frequency of the reactor, and is related to the heat transfer and thermal feedback of the reactor. The second peak is only observed at higher powers, which corresponds to the circulation of DNPs in the primary loop. The peak frequency is at approximately 0.23 rad/s, corresponding to the loop time of the reactor. The gain is larger at lower reactor powers, indicating reduced stability.
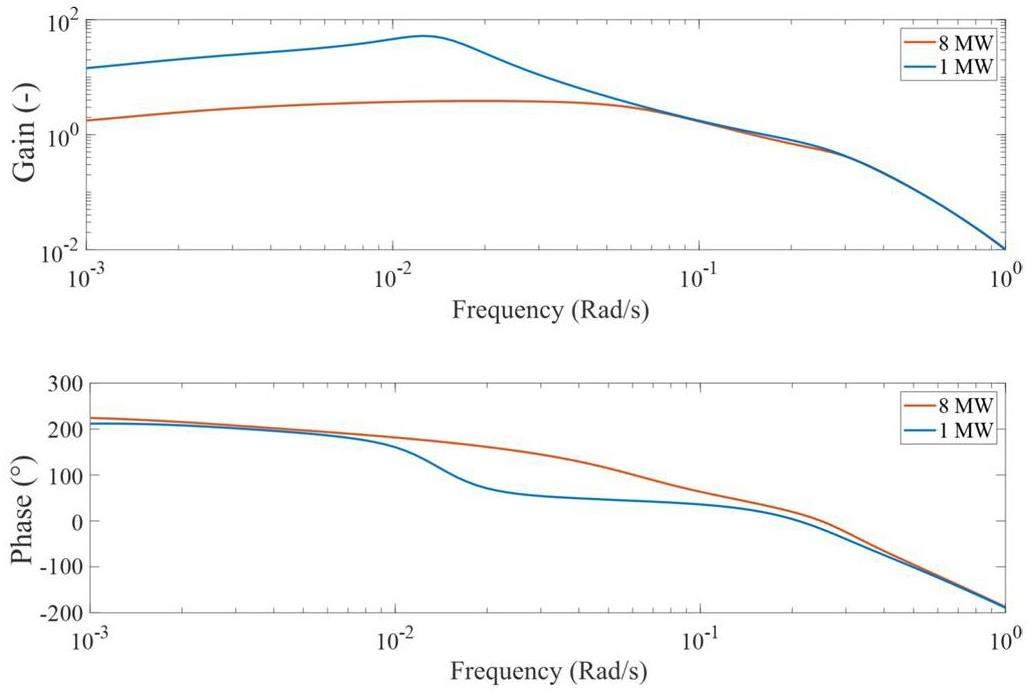
In Fig. 10, the power-to-core void-fraction frequency responses with the 235U fuel are plotted at two different powers. The disturbance is initiated at the pump bowl by changing the entrained void fraction. The results show that the reactor is relatively insensitive to small disturbances in the circulating void fraction at 8 MW. Both lines are nearly identical at frequencies higher than 0.1 rad/s, corresponding to the timescale of the void-feedback effect. The frequency response at lower frequencies is also related to xenon removal and xenon poisoning in the reactor. This effect is comparable to that of the delayed neutron fraction when the reactor is powered. The reason that such a large reactivity effect is not reflected in the observed frequency response is the difference in the characteristic times. The change in xenon poisoning occurs within hours, whereas the change in the effective delayed neutron fraction has a timescale of seconds. The slow reactivity change associated with the circulating void fraction may be used for the shim control of MSRs.
Plant Response During Unique Initiating Events
In this subsection, plant responses during two unique initiating events in MSRs are investigated. The first is a blockage in the off-gas system. When the off-gas system is blocked, xenon cannot be removed from the system and accumulates in the reactor. This results in a slow reduction in the reactivity. The second event is the loss of the circulating void fraction owing to a change in the condition of the pump bowl. During this event, the reactivity of the reactor first increases because of the removal of the core-void fraction. However, because the xenon removal is hindered by the removal of the void fraction, the reactivity decreases in the long term. The simulation of plant responses in these two unique scenarios was made possible by the xenon and void-transport capabilities of the coupled models.
Figure 11 shows the normalized power, core temperature, and xenon-poisoning levels following a blockage in the off-gas line at different powers. The blockage in the off-gas line prevents the removal of xenon from the pump bowl. The reactor power and core temperature slowly decrease as the xenon poisoning level increases after the initiating event. The reactor power is more stable when the reactor operates at a higher power, although the corresponding increases in xenon poisoning are larger. The operating temperature at 1 MW is slightly increased to separate the temperature lines. The temperature variation is more significant at 8 MW, compensating for the higher xenon-poisoning level. The temperature of the fuel increases as the fuel travels through the reactor, whereas the temperature of graphite is highest at the third node owing to the power-density profile. The large temperature variation at higher powers suggests that active control is required during this type of event to maintain a sufficient margin over the solidification temperature. However, limited intervention is required when the reactor is operating at a lower power.
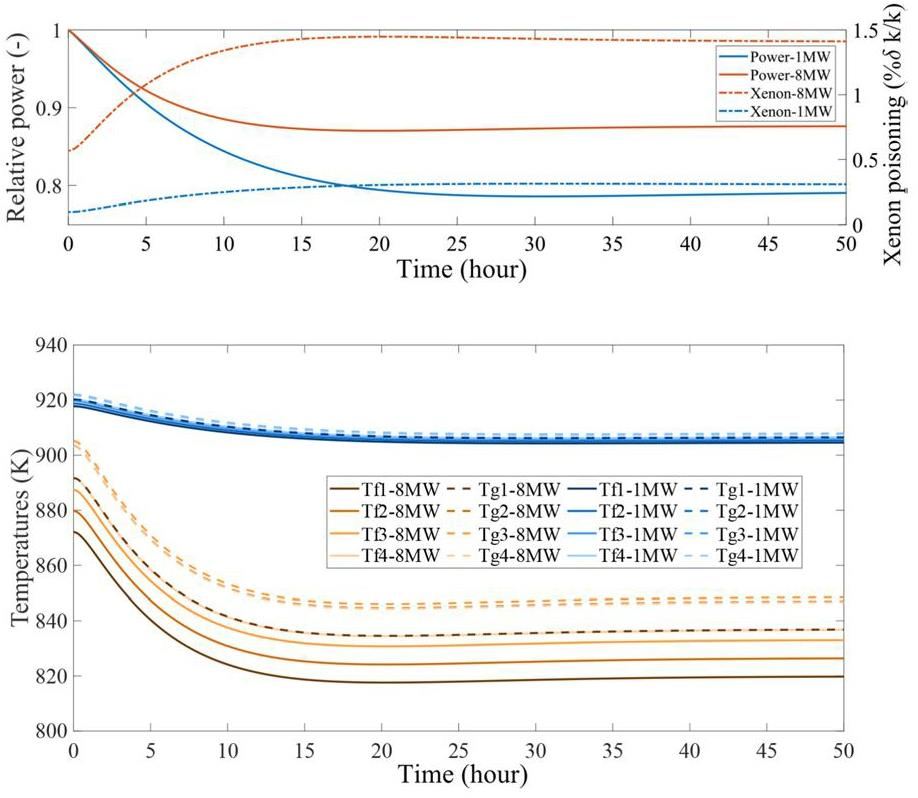
Figure 12 and Fig. 13 show the plant response following the loss of the circulating bubbles in the pump bowl. The responses during the first hour are presented in Fig. 12. The core void-fraction lines are almost identical during this event. The reactor power increases as the core void fraction decreases. The increase in reactivity due to the loss of the core void fraction is countered by the increase in the core temperature. At a higher reactor power, this thermal feedback occurs faster, and the resulting power peak is significantly lower. The xenon-poisoning level only slightly increases in the first hour and does not contribute significantly to the plant response.
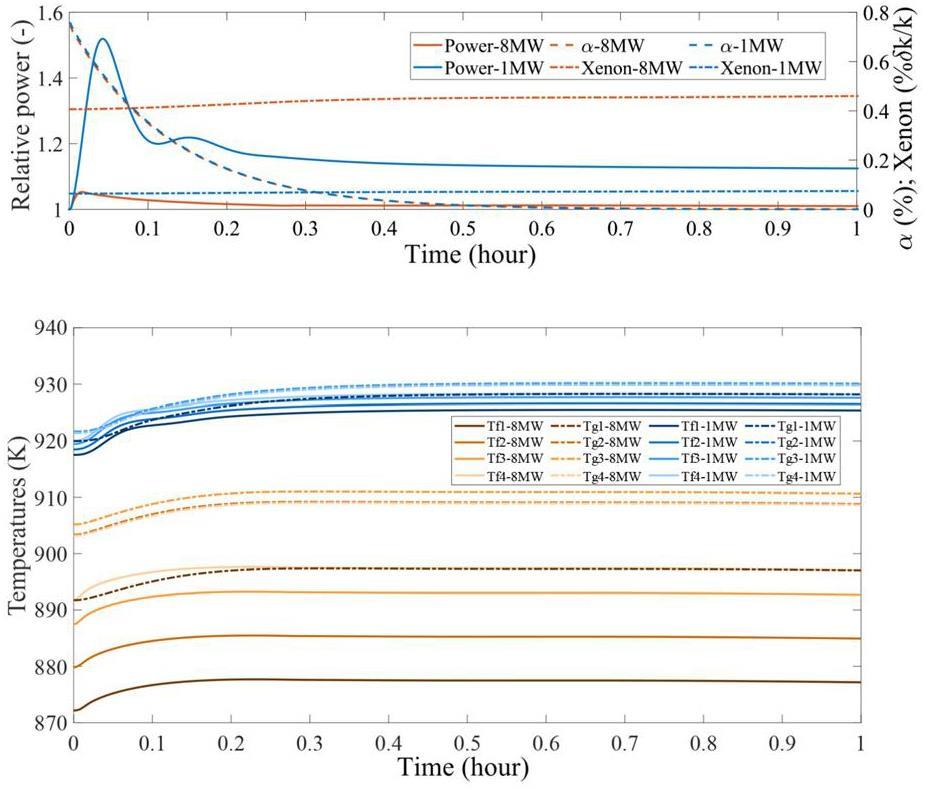
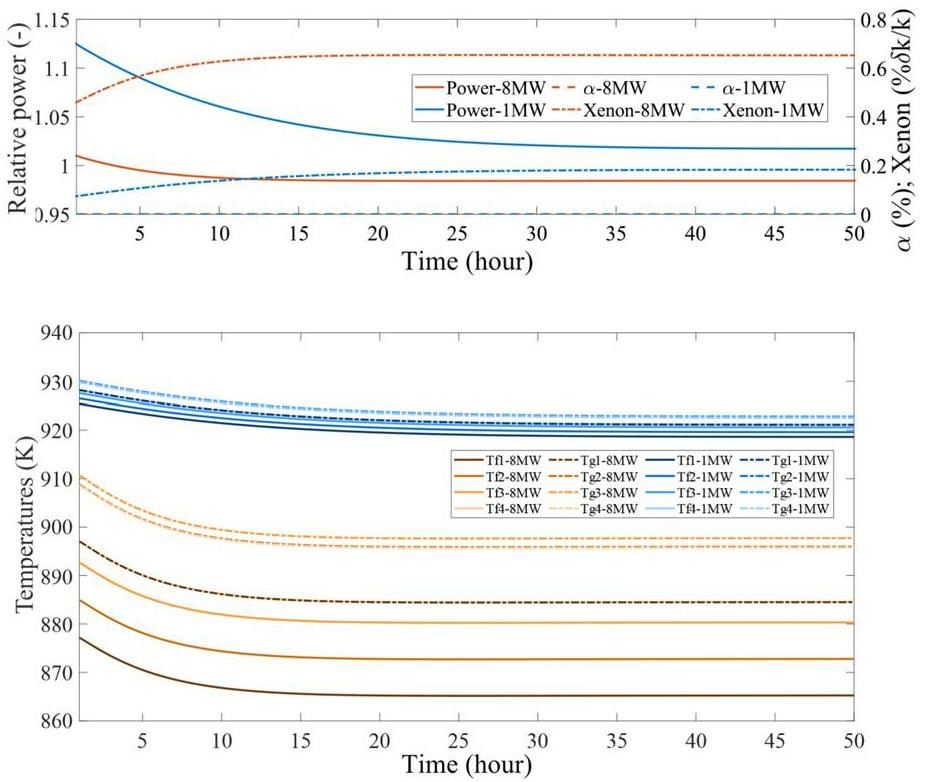
Figure 13 shows the plant response in the first 50 hours after the loss of the circulating void. The plant response during this period is solely controlled by the increase in xenon inventories owing to the absence of circulating bubbles. The plant reaches a steady-state within approximately 30 h. For the reactor at 8 MW, the final reactor power is slightly lower than that before the event, whereas the opposite is observed for the reactor at 1 MW. Notably, the loss of circulating bubbles does not lead to a complete loss of xenon removal because the spray in the pump bowl is still in operation.
Frequency-Response Sensitivity Study
In this subsection, a sensitivity study of various parameters of the power-to-reactivity frequency response is presented. Most of the frequency responses included in this subsection are obtained in a different manner from those in the other parts of the study. Instead of using sinusoidal reactivity signals with different frequencies in multiple simulations, a single band-limited white-noise signal is applied. The frequency response is obtained by dividing the cross-spectral power density by the spectral power density. This approach is analogous to the experimental method adopted in the dynamics-testing experiments during the MSRE [33].
The validity of the numerical method adopted in this study is illustrated in Fig. 14. In Fig. 14a, the frequency response obtained using the sinusoidal signals is compared with that obtained using the band-limited white-noise signal. The results obtained from both methods are identical at high frequencies. However, at lower frequencies, fluctuations are observed in the responses obtained using white noise. This fluctuation is due to insufficient sampling at lower frequencies. Fig. 14b illustrates the effect of the sample time 3. The fluctuating behavior is dampened when the sample time is reduced. Although they are not under the same conditions, the white noise shown in Fig. 14(a) is four times longer than that in Fig. 14b. Moreover, the extended sampling time significantly dampens the fluctuation at lower frequencies. In Fig. 14c, the effects of DNP nodes are presented. In terms of the frequency responses, no difference is observed between the uses of 20 and 10 nodes for out-of-core DNP transport.
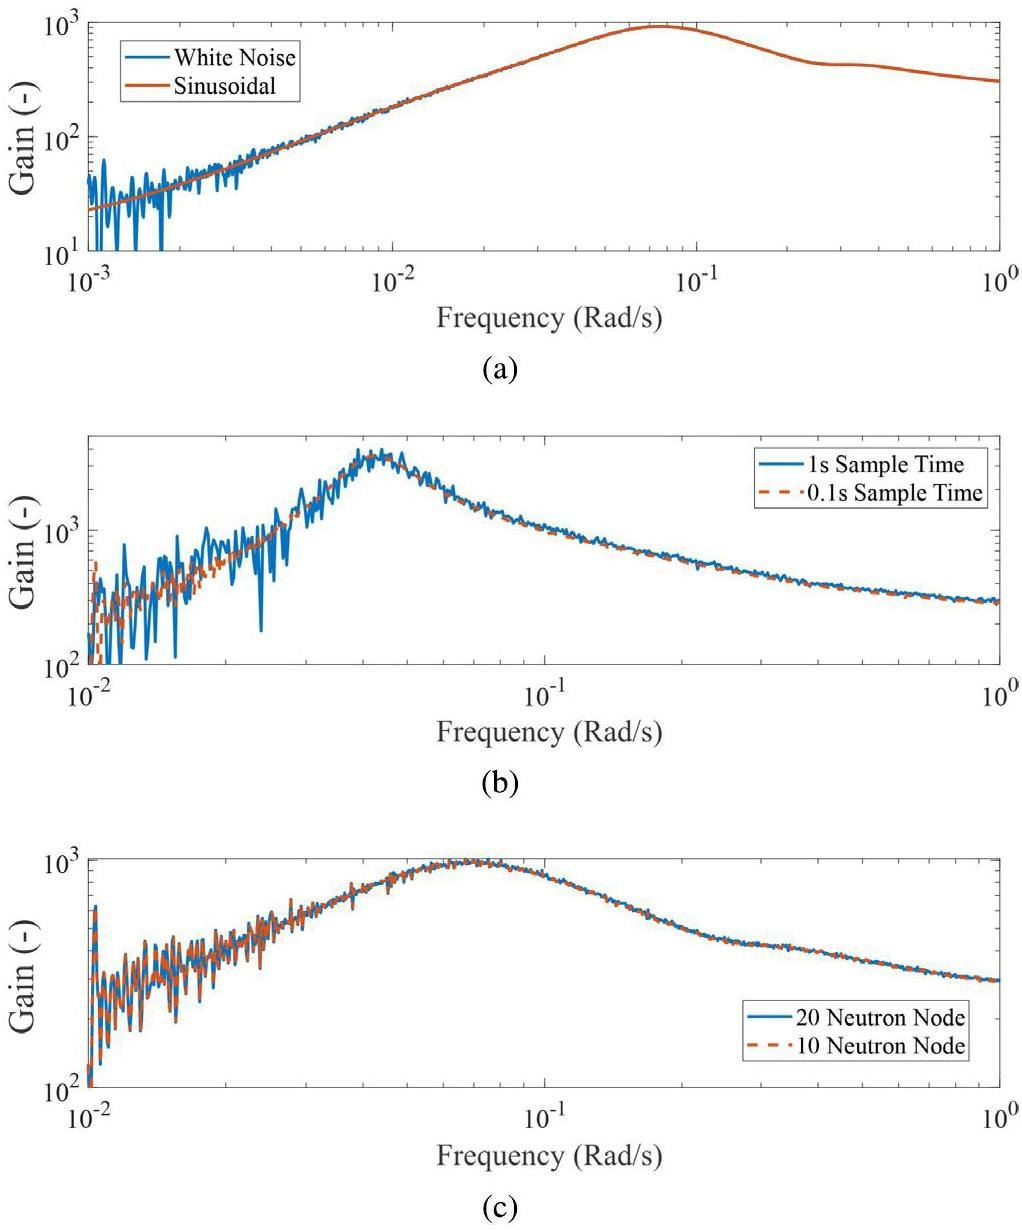
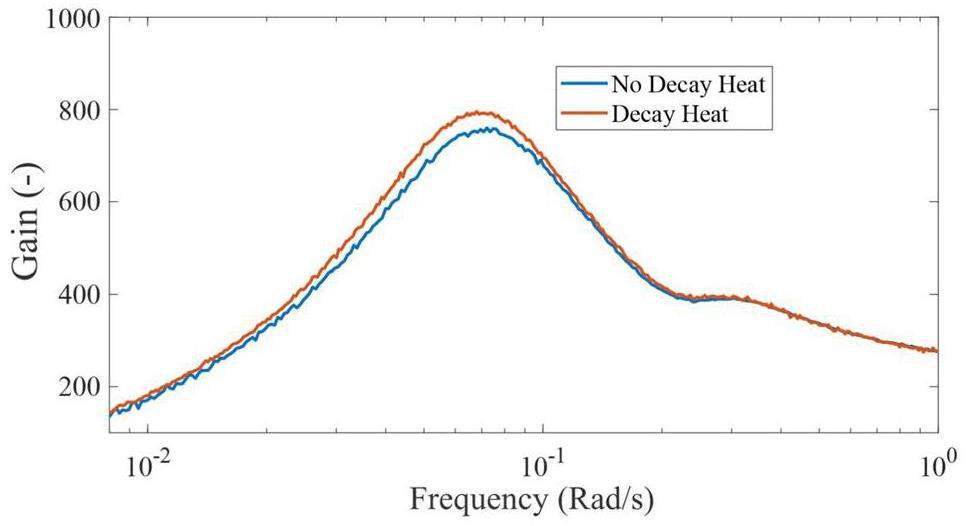
Figure 15 presents the effect of decay heat generation on the frequency response. In both the cases, the total reactor power is maintained at 8 MW. The decay heat model shifts the resonant peak slightly to a lower frequency while increasing the power-to-reactivity gain overall.
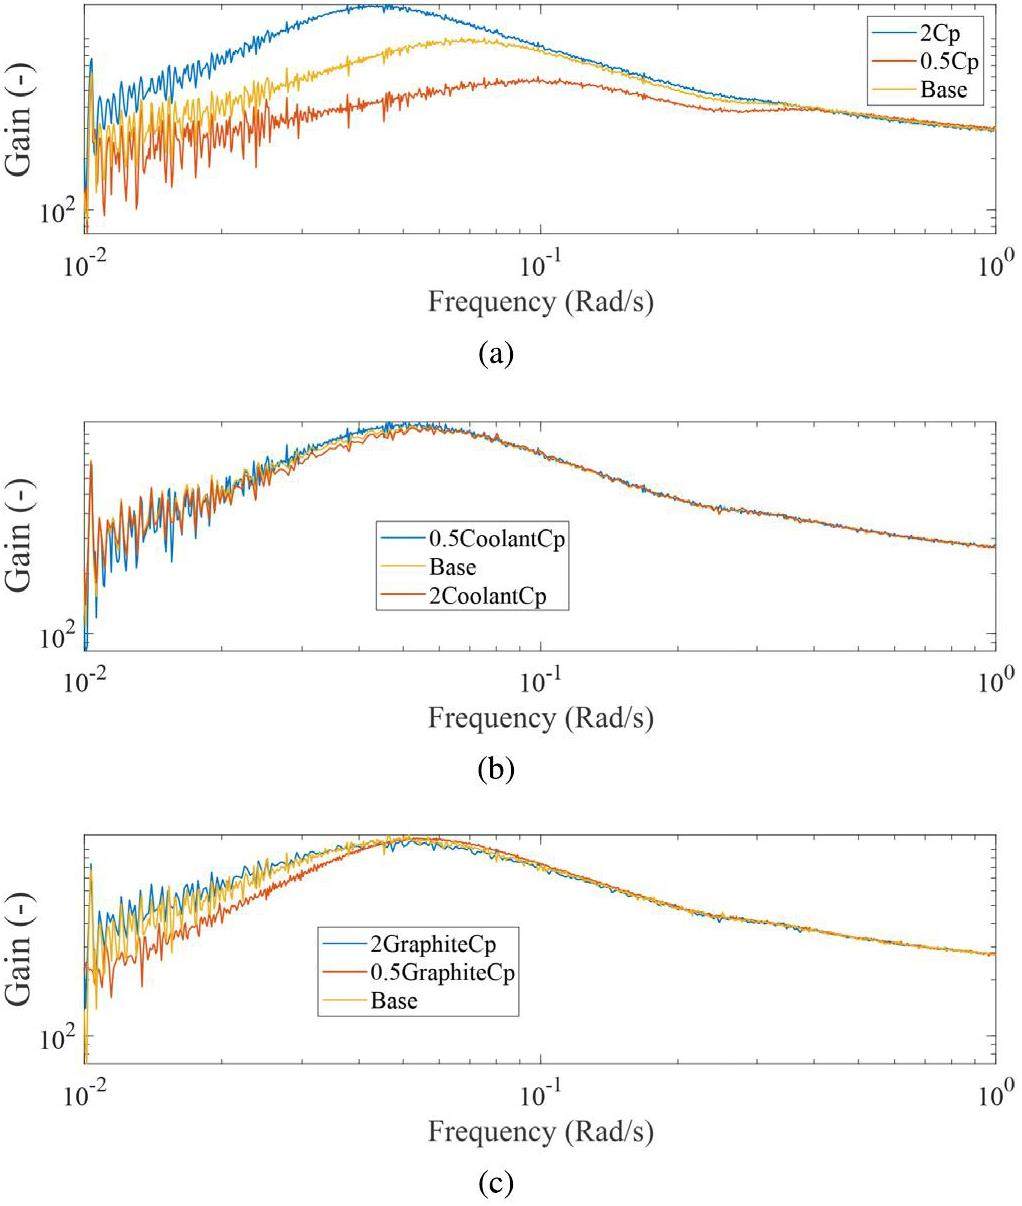
The effect of heat capacity on the frequency response is shown in Fig. 16. As shown in Fig. 16a and b, the heat capacities of the fuel salt and graphite significantly influence the frequency response of the reactor. Because most of the thermal power is deposited in the fuel salt, its heat capacity has a significant impact on the characteristic time of the thermal-feedback effect. A higher fuel–salt heat capacity shifts the resonance peak to the left and increases its magnitude. However, although a higher graphite heat capacity shifts the resonance peak to lower frequencies, it does not significantly change the height of the resonance peak. A relatively small effect on the coolant capacity is observed, as shown in Fig. 16c. The increase in the coolant heat capacity reduces the peak height and shifts the peak to higher frequencies. The change in the coolant heat capacity increases the overall heat capacity of the reactor, which tends to reinforce the oscillation. However, it improves the heat transfer at the heat exchanger and radiator, which should help suppress oscillations.
The effects of different heat-transfer coefficients are shown in Fig. 17. Figure 17a and b show that the salt–graphite and radiator heat-transfer coefficients have negligible effects on the frequency response. The temperature difference between the graphite and fuel salt is small, and only a limited fraction of the thermal power is deposited in the graphite. Moreover, heat transfer between the fuel and graphite involves heat conduction, and the convective heat-transfer coefficient is not the controlling parameter. Similarly, the heat transfer in the MSRE radiator is controlled by the flowrates, temperatures, and heat capacities of the coolant and airflow, whereas the heat-transfer coefficient is not a controlling parameter. However, in the study of the PHX, the overall heat-transfer coefficient varies. The improvement in heat transfer at the PHX dampens the resonance peak, as anticipated.
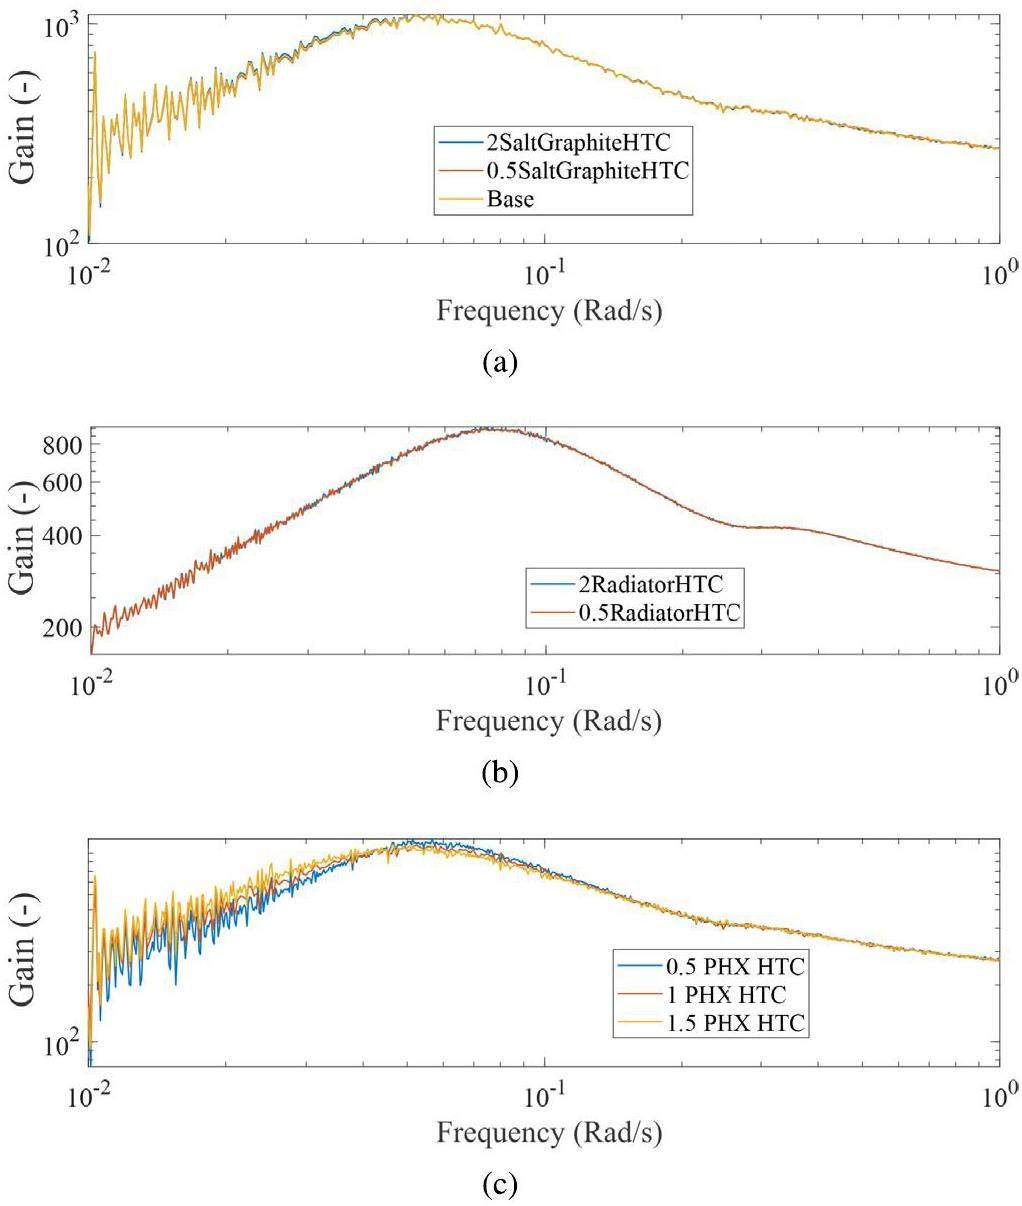
Figure 18 shows the effects of flowrates and fuel volume. A reduced fuel-salt flowrate leads to a reduction in the frequency response. The dominant effect of the reduced fuel flowrate is an increase in the effective delayed-neutron fraction, which helps to slow down the transient response of the reactor, corresponding to an overall dampening in the higher-frequency region, as shown in Fig. 18a. From Fig. 18b, the coolant flowrate has a limited effect on the plant responses in the considered range, suggesting that the heat transfer in the secondary loop primarily depends on the air flow at the radiator. In Fig. 18c, the effect of fuel volume in the reactor core is inspected. This is of practical importance because different values of core-fuel volume have been reported in MSRE documents. Their results indicate that a higher core-fuel volume leads to a lower resonance peak. Two competing mechanisms are at work. An increase in the core-fuel volume leads to a higher effective delayed-neutron fraction owing to a longer core residence time, which helps stabilize the reactor. However, the total fuel heat capacity increases, which tends to enhance the oscillation behavior.
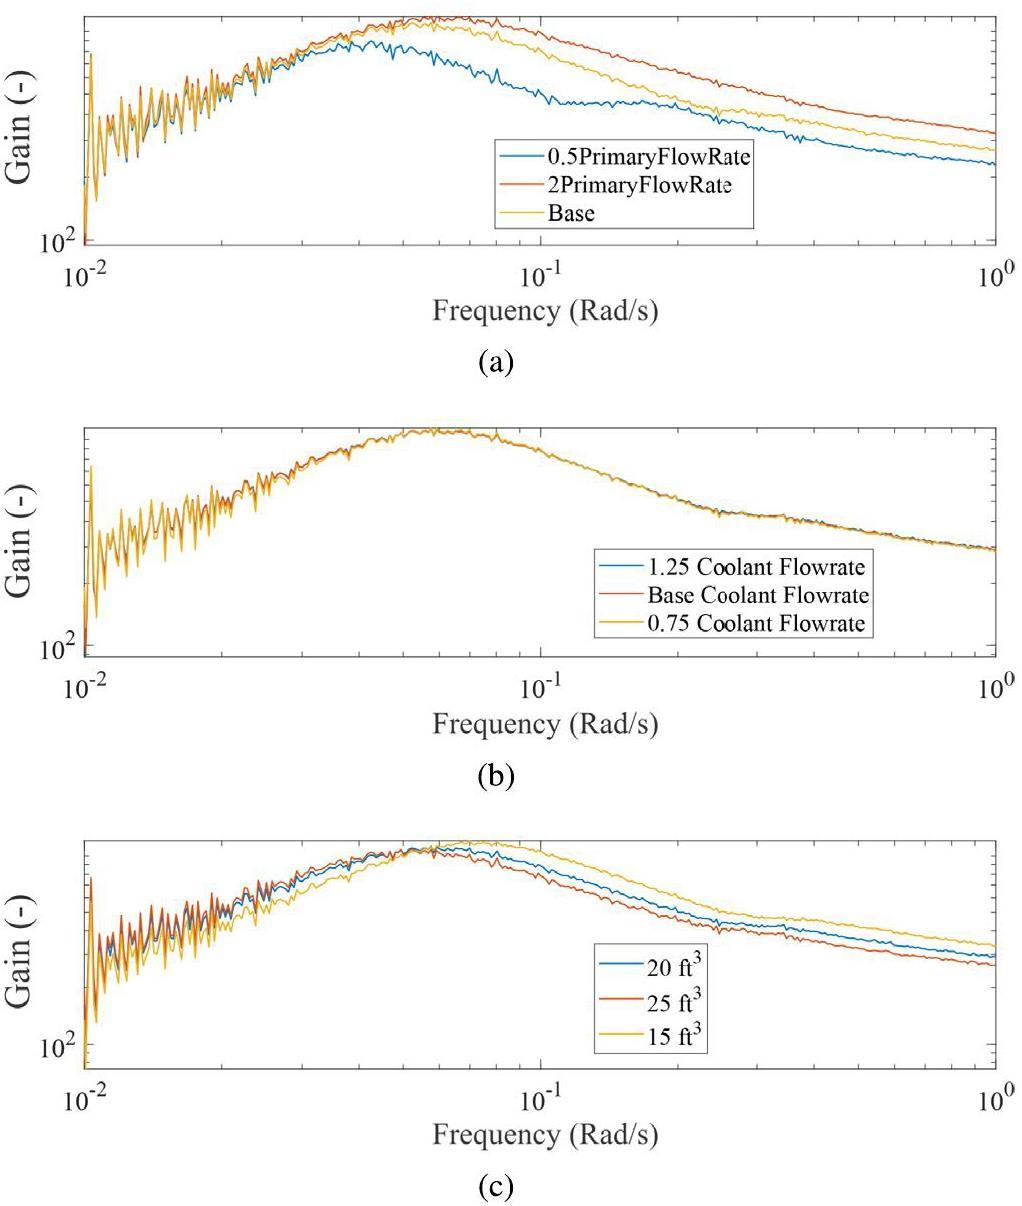
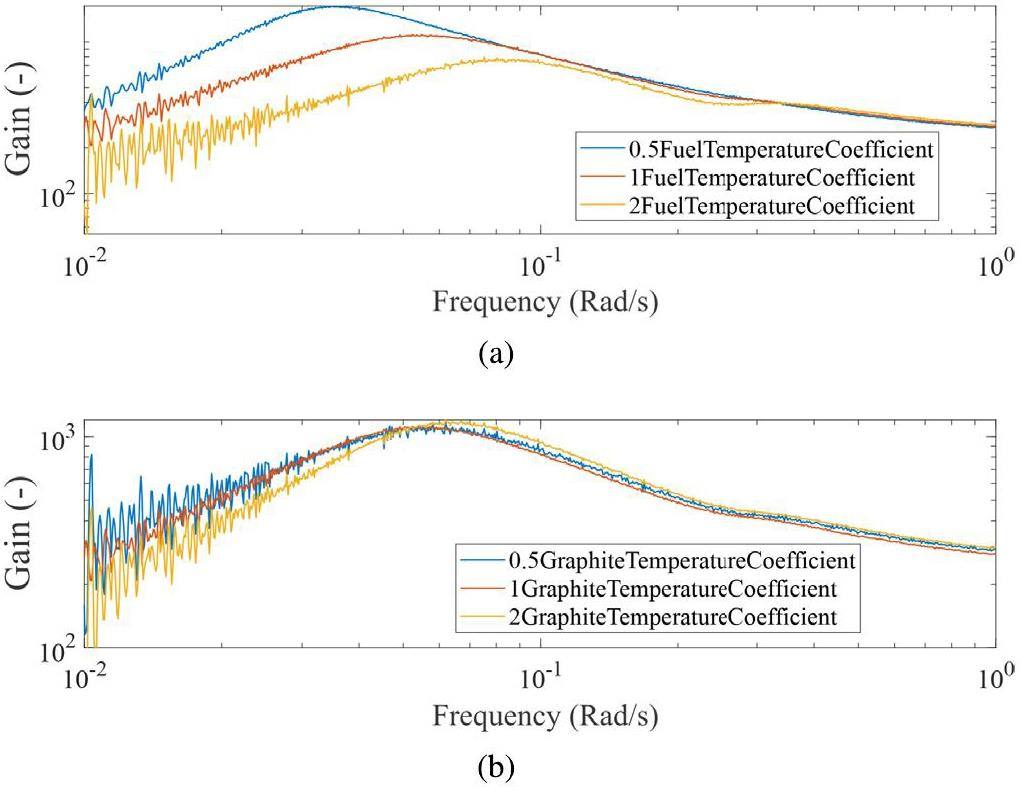
Figure 19 shows the effects of the temperature-feedback coefficients. Increases in the fuel and graphite temperature coefficients both reduce the gain at lower frequencies and shift the resonance peak to the right. The fuel temperature coefficient clearly has a stronger impact on the frequency response than the graphite temperature coefficient because of the direct deposition of fission power. Interestingly, an increase in the graphite temperature coefficient leads to a higher resonance peak, which may be related to the differences in the thermal response times of graphite and fuel salt.
Conclusion
In this study, the coupled Simulink model developed in a previous study is extended to study the dynamic behaviors of the MSRE. The model is improved to include the nuclear parameters of 233U fuel, the transport of DNPs, decay heat generation, and secondary-loop thermal hydraulics.
The model is validated against the power-to-reactivity frequency responses at different powers for the 233U and 235U fuels. The zero-power frequency responses serve to validate the neutronics model, whereas the frequency response at power is used to validate the coupled model. The thermal-hydraulics modeling in the current work is also separated and validated using the temperature-to-power frequency response of the reactor. In addition to the frequency domain, the model is validated using the reactor transient response during the reactivity insertion, pump startup, and pump coast-down experiments. Good agreement was observed for all conditions except for the pump-startup transient. This disagreement in the latter case may be related to the treatment of DNP transport inside the core.
After the validation, the coupled model is applied to study the unique dynamic characteristics of the MSRE. The power-to-flowrate and power-to-void frequency responses of the MSRE are simulated. The MSRE has a smooth power-to-void frequency response, which can be utilized for reactor shim control. In addition, plant responses during the unique initiating events of off-gas system blockage and loss of circulating voids are simulated. The slow reactivity changes related to xenon poisoning during these events do not threaten the reactor stability and safety. However, an immediate reactivity change during a loss-of-void event can cause a significant power peak at low operational powers. Finally, a sensitivity study of various plant parameters and numerical schemes is presented.
Science and policy characteristics of the Paris Agreement temperature goal
. Nat. Clim. Change 6(9), 827-835 (2016). https://doi.org/10.1038/nclimate3096Techno-economic analysis of advanced small modular nuclear reactors
. Appl. Energ. 334,Global zero-carbon energy pathways using viable mixes of nuclear and renewables
. Appl. Energ. 143, 451-459 (2015). https://doi.org/10.1016/j.apenergy.2015.01.006Economics and finance of molten salt reactors
. Prog. Nucl. Energ. 129,Feasibility of an innovative long-life molten chloride-cooled reactor
. Nucl. Sci. Tech. 31(4), 33 (2020). https://doi.org/10.1007/s41365-020-0751-7Molten salt for advanced energy applications: A review
. Ann. Nucl. Energy 169,Experience with the Molten-Salt Reactor Experiment
. Nucl. Appl. Technol. 8(2), 118-136 (1970). https://doi.org/10.13182/NT8-2-118Evaluating the JEFF 3.1, ENDF/B-VII.0, JENDL 3.3, and JENDL 4.0 nuclear data libraries for a small 100 MWe molten salt reactor with plutonium fuel
. Nucl. Sci. Tech. 33(12), 165 (2022). https://doi.org/10.1007/s41365-022-01141-8Plutonium utilization in a small modular molten-salt reactor based on a batch fuel reprocessing scheme
. Nucl. Sci. Tech. 35(4), 68 (2024). https://doi.org/10.1007/s41365-024-01428-yDesign and cost-benefit analysis of the xenon removal system for the molten salt demonstration reactor
. Ann. Nucl. Energy 207,Material attractiveness of irradiated fuel salts from the Seaborg Compact Molten Salt Reactor
. Nucl. Eng. Technol., (2024). https://doi.org/10.1016/j.net.2024.04.045Preliminarysafety analysis for a heavy water-moderated molten salt reactor
. Nucl. Sci. Tech. 35(6), 106 (2024). https://doi.org/10.1007/s41365-024-01476-4Preliminary analysis of fuel cycle performance for a small modular heavy water-moderated thorium molten salt reactor
. Nucl. Sci. Tech. 31(11), 108 (2020). https://doi.org/10.1007/s41365-020-00823-5Molten-salt reactors—history, status, and potential
. Nucl. Appl. Technol. 8(2), 107-117 (1970). https://doi.org/10.13182/NT70-A28619Analysis of load-following operation characteristics of liquid fuel molten salt reactor
. Prog. Nucl. Energ. 150,Pre-conceptual high temperature gas-cooled microreactor design utilizing two-phase composite moderators. Part I: Microreactor design and reactor performance
. Prog. Nucl. Energ. 149,A review of molten salt reactor kinetics models
. Nucl. Sci. Eng. 191(3), 203-230 (2018). https://doi.org/10.1080/00295639.2018.1480182Modeling and simulation of online reprocessing in the thorium-fueled molten salt breeder reactor
. Ann. Nucl. Energy 128, 366-379 (2019). https://doi.org/10.1016/j.anuce.2019.01.030Analysis of burnup performance and temperature coefficient for a small modular molten-salt reactor started with plutonium
. Nucl. Sci. Tech. 34(1), 17 (2023). https://doi.org/10.1007/s41365-022-01155-2Theoretical dynamics analysis of the Molten-Salt Reactor Experiment
. Nucl. Technol. 10(2), 118-132 (1971). https://doi.org/10.13182/NT71-A30920Development of a safety analysis code for molten salt reactors
. Nucl. Eng. Des. 239(12), 2778-2785 (2009). https://doi.org/10.1016/j.nucengdes.2009.08.020Neutron kinetics of fluid–fuel systems by the quasi-static method
. Ann. Nucl. Energy 31(15), 1709-1733 (2004). https://doi.org/10.1016/j.anucene.2004.05.004Modeling of transient and steady state xenon behavior in the Molten Salt Reactor Experiment
. Ann. Nucl. Energy 204,Experiences with Dynamic Testing Methods at the Molten-Salt Reactor Experiment
. Nucl. Technol. 10(2), 103-117 (1971). https://doi.org/10.13182/NT71-A30919DYN1D-MSR dynamics code for molten salt reactors
. Ann. Nucl. Energy 32(17), 1799-1824 (2005). https://doi.org/10.1016/j.anucene.2005.07.007DYN3D-MSR spatial dynamics code for molten salt reactors
. Ann. Nucl. Energy 34(6), 449-462 (2007). https://doi.org/10.1016/j.anucene.2006.12.011Molten-salt reactor program semiannual progress report for period ending february 28, 1969
(A multi-physics modelling approach to the dynamics of Molten Salt Reactors
. Ann. Nucl. Energy 38(6), 1356-1372 (2011). https://doi.org/10.1016/j.anucene.2011.01.037Dimensional effects in the modelling of MSR dynamics: Moving on from simplified schemes of analysis to a multi-physics modelling approach
. Nucl. Eng. Des. 246, 12-26 (2012). https://doi.org/10.1016/j.nucengdes.2011.08.002A Geometric Multiscale modelling approach to the analysis of MSR plant dynamics
. Prog. Nucl. Energ. 83, 82-98 (2015). https://doi.org/10.1016/j.pnucene.2015.02.014Development of a dynamics model for graphite-moderated channel-type molten salt reactor
. Nucl. Sci. Tech. 30(1), 18 (2019). https://doi.org/10.1007/s41365-018-0541-7Neutron point kinetics model with precursors' shape function update for molten salt reactor
. Nucl. Eng. Des. 360,Simulations of unprotected loss of heat sink and combination of events accidents for a molten salt reactor
. Ann. Nucl. Energy 53, 309-319 (2013). https://doi.org/10.1016/j.anucene.2012.09.009Development of a kinetic model for safety studies of liquid-fuel reactors
. Prog. Nucl. Energ. 81, 104-112 (2015). https://doi.org/10.1016/j.pnucene.2015.01.011Studies on the molten salt reactor: code development and neutronics analysis of MSRE-type design
. J. Nucl. Sci. Technol. 52(2), 251-263 (2015). https://doi.org/10.1080/00223131.2014.944240Transient analysis for liquid-fuel molten salt reactor based on MOREL2.0 code
. Int. J. Energ. Res. 42(1), 261-275 (2018). https://doi.org/10.1002/er.3828Study on dynamic characteristics of fission products in 2 MW molten salt reactor
. Nucl. Sci. Tech. 31(2), 17 (2020). https://doi.org/10.1007/s41365-020-0730-zValidation of the TRACE code for the system dynamic simulations of the molten salt reactor experiment and the preliminary study on the dual fluid molten salt reactor
. Dissertation,Analysis of the Power and Temperature distribution in molten salt reactors with TRACE
. Application to the MSRE. Ann. Nucl. Energy 157,Development and application of a system analysis code for liquid fueled molten salt reactors based on RELAP5 code
. Nucl. Eng. Des. 305, 378-388 (2016). https://doi.org/10.1016/j.nucengdes.2016.05.034Improvement of the delayed neutron precursor transport model in RELAP5 for liquid-fueled molten salt reactor
. Nucl. Eng. Des. 394,Development of coupled PROTEUS-NODAL and SAM code system for multiphysics analysis of molten salt reactors
. Ann. Nucl. Energy 168,Nonlinear dynamic model of Molten-Salt Reactor Experiment – Validation and operational analysis
. Ann. Nucl. Energy 113, 177-193 (2018). https://doi.org/10.1016/j.anucene.2017.10.047Dynamics and control of molten-salt breeder reactor
. Nucl. Eng. Technol. 49(5), 887-895 (2017). https://doi.org/10.1016/j.net.2017.06.003Studies on reactivity coefficients of thorium-based fuel (Th-233U)O2 with molten salt (Flibe) cooled pebble
. Nucl. Sci. Eng. 191(2), 161-177 (2018). https://doi.org/10.1080/00295639.2018.1463745Plant-level dynamic modeling of a commercial-scale molten salt reactor system
. Nucl. Eng. Des. 360,Scalable modular dynamic molten salt reactor system model with decay heat
. Ann. Nucl. Energy 154,Depletion dependency of molten salt reactor dynamics
. Ann. Nucl. Energy 168,Effect of xenon removal rate on load following in high power thermal spectrum Molten-Salt Reactors (MSRs)
. Nucl. Eng. Des. 409,NERTHUS thermal spectrum molten salt reactor neutronics and dynamic model
. Nucl. Eng. Des. 411,Molten salt reactor xenon analysis: review and decomposition
. Journal of Nuclear Engineering and Radiation Science 5(4), (2019). https://doi.org/10.1115/1.4043813Xenon in molten salt reactors: the effects of solubility, circulating particulate, ionization, and the sensitivity of the circulating void fraction
. Nucl. Eng. Technol. 52(6), 1131-1136 (2020). https://doi.org/10.1016/j.net.2019.11.026A dynamic model of xenon behavior in the Molten Salt Reactor Experiment
. Ann. Nucl. Energy 144,Dynamic simulation analysis of molten salt reactor-coupled air–steam combined cycle power generation system
. Nucl. Sci. Tech. 35(2), 30 (2024). https://doi.org/10.1007/s41365-024-01394-5Demonstration of the Advanced Dynamic System Modeling Tool TRANSFORM in a molten salt reactor application via a model of the Molten Salt Demonstration Reactor
. Nucl. Technol. 206(3), 478-504 (2020). https://doi.org/10.1080/00295450.2019.1627124Molten salt reactor system dynamics in simulink and modelica, a code to code comparison
. Nucl. Eng. Des. 413,Application of Modelica/TRANSFORM to system modeling of the molten salt reactor experiment
. Nucl. Eng. Des. 416,Diffusion in porous media: phenomena and mechanisms
. Transport Porous Med. 130(1), 105-127 (2019). https://doi.org/10.1007/s11242-019-01262-6Physical properties of molten reactor fuels and coolants
. Nucl. Sci. Eng. 17(2), 200-211 (1963)The quasi-static method revisited
. Prog. Nucl. Energ. 50(8), 908-920 (2008). https://doi.org/10.1016/j.pnucene.2008.04.009Transfer function modeling of zero-power dynamics of circulating fuel reactors
. J. Eng. Gas Turb. Power 133(5), (2010). https://doi.org/10.1115/1.4002880An approach to the MSR dynamics and stability analysis
. Prog. Nucl. Energ. 67, 56-73 (2013). https://doi.org/10.1016/j.pnucene.2013.03.020MSRE design and operations report. Part IIB. Nuclear and process instrumentation
(MSRE design and operations report. Part IIA. Nuclear and process instrumentation
(In this work, the term “modified point-reactor equations (mPKEs)” is universally used for PKEs different from those for solid-fueled reactors. The formulation of these equations differ in the literature. Wooten and Powers [25] attempted to categorize different mPKEs, although their classification did not cover all existing models such as the classical model by Kerlin et al. [28]
For density and viscosity, the temperature dependence is taken from data for uranium-free salt, and the correlation is linearly scaled to match the reported data for the fuel salt.
The sample time refers to the maximum time step used in the simulation. Smaller timesteps are automatically applied by the solver during quick transient.


