Introduction
Molten salt reactors (MSRs) are promising candidates for Generation IV reactor technologies [1-3] owing to their inherent safety [4-9] and economic efficiency [10-14]. In 2011, the Chinese Academy of Sciences (CAS) initiated the Strategic Priority Research Program titled Future Advanced Nuclear Fission Energy, which included a molten salt reactor as one of the key projects. Following this, a small modular molten salt reactor (SM-MSR) was proposed [15]. Safety analysis is crucial in MSR design, both to ensure that the reactor meets the necessary safety requirements set by regulatory authorities and industry organizations and to optimize design features to enhance overall safety performance. One of the most critical scenarios in safety analysis is the loss of forced cooling (LOFC) accident, which helps confirm that the design stays within acceptable limits for radiation doses and releases under various operational conditions.
The use of best-estimate codes combined with uncertainty evaluation, known as BEPU methodologies [16], is recognized by regulatory authorities as a standard approach for deterministic safety analyses. In the late 1980s, the US Nuclear Regulatory Commission began allowing best-estimate methods with uncertainty quantification for safety analysis in place of earlier deterministic methods that used conservative assumptions to account for uncertainties[17]. The BEPU approach calculates the uncertainty associated with the best-estimate code to more realistically assess the safety margin relative to established criteria. When paired with sensitivity studies, BEPU also allows the identification and quantification of critical input parameters.
Several researchers have explored uncertainty and sensitivity analyses in salt reactors. Jiao et al. [18] used RELAP5/MOD4.0 to study the impact of the trip setpoint in a reactivity-initiated accident, identifying sensitivity rankings for these parameters. Jiao et al. [19] also examined the sensitivity of initial conditions during a low-power reactivity-initiated accident in an MSR, finding low sensitivity in accident outcomes to the temperature coefficients of reactivity. Santanoceto et al.[20] investigated the uncertainty and sensitivity of the steady state of a molten salt fast reactor using a polynomial chaos expansion method, showing that the heat exchanger could be a critical component based on analysis across the entire temperature field. J.J. Wang et al. [21] examined the uncertainty in heat transfer in the TMSR-SF0 simulator, finding that the uncertainty propagated to the core outlet temperature is approximately ±10 ℃ within a 95% confidence interval under steady-state conditions. Although previous studies have analyzed uncertainty and sensitivity in salt reactors, most focused on steady-state operations or specific parameters, and comprehensive uncertainty and sensitivity studies of accident scenarios remain limited. This study aims to address this gap by examining the comprehensive uncertainty of LOFC outcomes and the sensitivity of related input parameters.
Description of SM-MSR
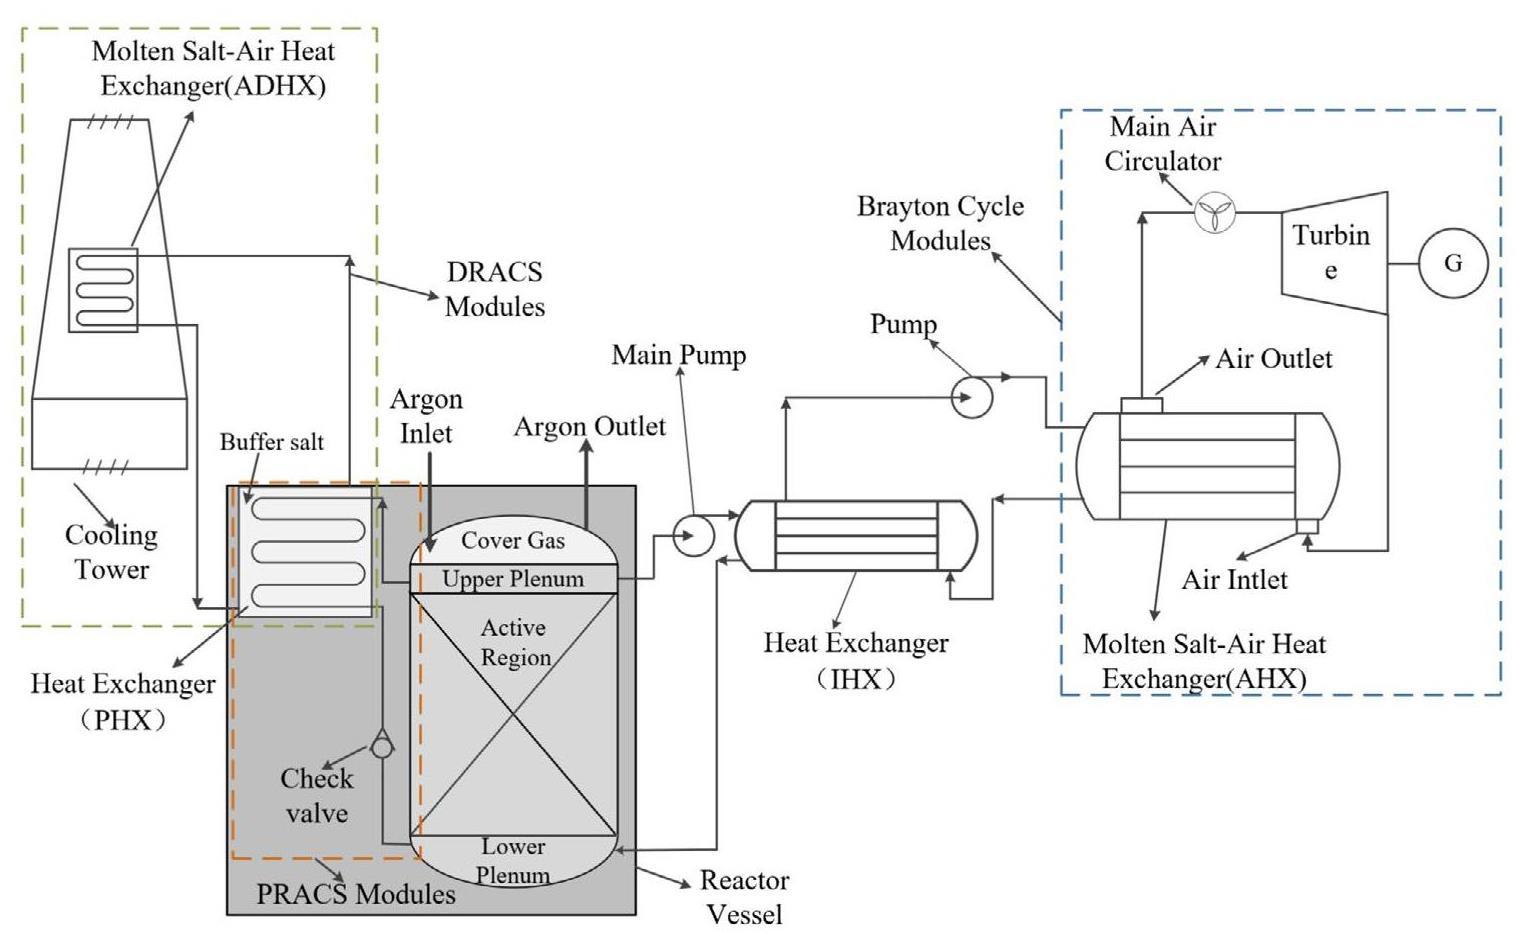
Figure 1 shows the schematic design of an SM-MSR, with its main design parameters listed in Table 1. The reactor utilizes a double-molten salt circuit. The primary circuit comprises a reactor core, intermediate heat exchangers (IHX), control rods, primary pump, and pipelines. The reactor core is made up of open-celled graphite elements, forming 241 molten salt channels and six channels for the control rods. The fuel salt, composed of LiF-BeF2-ZrF4-UF4-ThF4, enters the reactor at about 629 ℃ through the lower plenum, flows upward through the core where nuclear fission occurs, heating the salt, and exits the core at approximately 700 ℃ [15].
| Main parameter | Design Value |
|---|---|
| Thermal power (MWt) | 150 |
| Fuel salt composition | LiF-BeF2-ZrF4-UF4-ThF4 |
| Fuel salt temperature(inlet/outlet) (℃) | 629/700 |
| Diameter × height of reactor body (m2) | 3.54× 3.6 |
| Fuel salt power density (MW/m3) | 66 |
| Lifetime of reactor body (year) | 10 |
| Graphite structure | Hexagonal prism |
| The secondary circuit salt composition | LiF-NaF-KF |
| PRACS salt composition | LiF-BeF2-ZrF4-UF4-ThF4 |
| DRACS salt composition | LiF-NaF-KF |
| Design power of PRACS and DRACS | 2% FP |
| Structure material | Hastelloy-N |
The secondary circuit includes a secondary pump, molten salt-air heat exchangers (AHX), and pipelines. The coolant salt, LiF-NaF-KF, is pumped into the primary heat exchanger's tube side to absorb power from the primary circuit and then transfers the heat to the Brayton cycle system via the molten salt-air heat exchanger, ultimately converting nuclear power into electrical energy through a Brayton cycle turbine.
To mitigate accident consequences, a natural circulation flow loop is incorporated for decay heat removal, forming a pathway between the hot core and the pool reactor auxiliary cooling system (PRACS) heat exchangers (PHX). Under standard operating conditions, the PRACS flow path is partially restricted by a check valve, which has a much higher loss coefficient for reverse flow than for forward flow. The PHX modules transfer heat from the primary salt to a buffer salt, which is then cooled by direct reactor auxiliary cooling system (DRACS) modules. The DRACS facilitates heat transfer from the buffer salt to a molten salt-air heat exchanger (ADHX) via natural circulation, where the heat is finally dissipated by ambient air. All components in contact with molten salt are made from Hastelloy-N.
Methodology
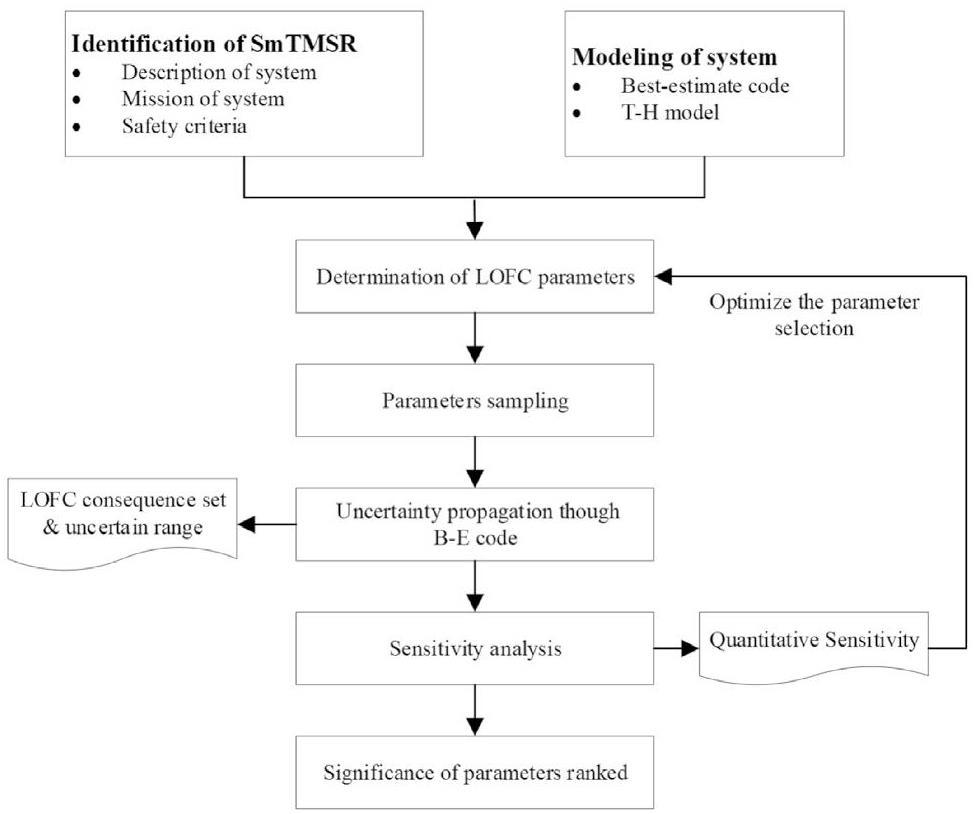
Currently, there are two general approaches to uncertainty analysis: propagation of input uncertainty and extrapolation of output accuracy [22, 23]. The extrapolation of output accuracy requires significant experimental data. Given the limited number of current molten salt reactor experiments, this study adopts the propagation of input uncertainty approach, which is based on Monte Carlo methods. This approach involves two key elements: the association of uncertainty with input parameters and multiple executions of the best-estimate code. A flowchart of the SM-MSR LOFC accident uncertainty and sensitivity analyses is shown in Fig. 2.
Uncertainty Parameters
The uncertainty of the input parameters stems from imprecise knowledge of the actual values, with sources of uncertainty consisting of reactor system data, structural material properties, and B-E code correlations. Uncertain parameters for the LOFC accident were selected using a phenomenon identification and ranking table (PIRT). The primary approaches for quantifying input uncertainty include both probabilistic and deterministic methods. Probabilistic methodologies utilize statistical elements to characterize and combine input uncertainty, whereas deterministic methodologies use reasonable ranges or bounding intervals of uncertainty and combine input uncertainty based on the maximization and minimization of the output value [24-26]. The probabilistic approach is the most widely adopted procedure and is endorsed by industry and regulators. Limited detailed information about certain aspects of SM-MSR is a significant drawback. To minimize the impact of this drawback, a list of input parameters and their associated density functions was adopted using a probabilistic methodology. Quantification of the uncertainty parameters was established based on previous studies, experimental data, and expert judgment. In this study, 30 uncertainty input parameters were identified, and Table 2 lists the parameters and their probability distribution functions used in this study.
| No. | Parameters | Distribution | Range | |
|---|---|---|---|---|
| p-1 | Heat transfer coefficient of tube side | h_tube | Uniform | 75~125% |
| p-2 | Heat transfer coefficient of shell side | h_shell | Uniform | 75~125% |
| p-3 | Heat transfer coefficient of air side | h_air | Uniform | 75~125% |
| p-4 | Viscosity of fuel salt | ν_fuel | Uniform | 90~110% |
| p-5 | Heat conductivity of fuel salt | k_fuel | Uniform | 90~110% |
| p-6 | Coefficient of thermal expansion of fuel salt | b_fuel | Uniform | 90~110% |
| p-7 | Volumetric heat capacity of fuel salt | Cpv_fuel | Uniform | 90~110% |
| p-8 | Isothermal compressibity of fuel salt | e_fuel | Uniform | 90~110% |
| p-9 | Viscosity of FLiNaK | ν_flinak | Uniform | 90~110% |
| p-10 | Heat conductivity of FLiNaK | k_flinak | Uniform | 90~110% |
| p-11 | Coefficient of thermal expansion of FLiNaK | b_flinak | Uniform | 90~110% |
| p-12 | Volumetric heat capacity of FLiNaK | CPv_flinak | Uniform | 90~110% |
| p-13 | Isothermal compressibity of FLiNaK | e_flinak | Uniform | 90~110% |
| p-14 | Thermal conductivity of graphite | k_graphite | Normal | 90~110% |
| p-15 | Volumetric heat capacity of graphite | cpv_graphite | Normal | 90~110% |
| p-16 | Thermal conductivity of Hastelloy-N | k_hn | Normal | 90~110% |
| p-17 | Volumetric heat capacity of Hastelloy-N | cpv_hn | Normal | 90~110% |
| p-18 | Reactor power | P_reactor | Uniform | 95~105% |
| p-19 | Control rod dropping time | t_drop | Uniform | 80~120% |
| p-20 | Reactor shutdown margin | ρ_shutdown | Uniform | 80~120% |
| p-21 | Fuel salt temperature coefficient of reactivity | ρ_f | Uniform | 80~120% |
| p-22 | Graphite temperature coefficient of reactivity | ρ_g | Uniform | 80~120% |
| p-23 | Core Hot Spot Factor | f_hsf | Uniform | 80~120% |
| p-24 | Atmospheric temperature | T_atmo | Uniform | 95~105% |
| p-25 | Local resistance coefficient of reactor core | f_core | Uniform | 80~120% |
| p-26 | Local resistance coefficient of primary circuit (excluding reactor core) | f_primary | Uniform | 80~120% |
| p-27 | Local resistance coefficient of PRACS | f_PRACS | Uniform | 80~120% |
| p-28 | Local resistance coefficient of 2nd circuit | f_second | Uniform | 80~120% |
| p-29 | Local resistance coefficient of DRACS | f_DRACS | Uniform | 80~120% |
| p-30 | Local resistance coefficient of air cooling tower | f_Airtower | Uniform | 80~120% |
Best-Estimate Code
The RELAP5 code is a transient analysis tool designed for light-water reactors and developed by the U.S. Nuclear Regulatory Commission (NRC) for various applications, such as rulemaking, licensing audit calculations, and evaluation of operator guidelines. It uses a one-dimensional two-fluid thermal-hydraulic model. The latest version, RELAP5/MOD4.0, was developed by Innovative System Software (ISS) specifically for the analysis of nuclear power plants [27].
In RELAP5/MOD4.0, an uncertainty analysis package was incorporated following the methodology developed by the Gesellschaft für Anlagen- und Reaktorsicherheit (GRS)[24]. This methodology integrates order statistics and Wilks' formula [28, 29] into the propagation of the input uncertainty approach. Because the heat transfer coefficient correlations and coolants for the SM-MSR are not available in the current RELAP5/MOD4.0, new correlations [30] and coolants applicable to the MSRs were inserted, and the updated code was named RELAP5-TMSR [31-33]. Given that the uncertainty analysis package can only be employed for the partial analysis of light-water reactors, an uncertainty analysis package for molten salt reactor systems was developed in this study. It can propagate uncertainties associated with molten salt properties. Furthermore, it can propagate uncertainties related to the inserted heat transfer correlations, which are applicable to the fuel channels in the reactor core and heater exchangers of the SM-MSR.
Sensitivity Analysis method
Sensitivity analysis assesses the impact of varying the values of the independent variables on a particular dependent variable within the defined assumptions. In other words, it examines how uncertainties in a mathematical model from various sources contribute to the overall model uncertainty.
Linear regression [34-36] uses a straight line to describe relationships between variables. It identifies the best-fit line in a dataset by searching for the regression coefficient(s) that minimizes the total error of the model. The model's equation presents coefficients that clarify the influence of each independent variable on the dependent variables. There are two primary types of linear regression.
1) Simple Linear Regression, the simplest form of linear regression, involves only one independent and dependent variable.
2) Multiple Linear Regression (MLR) involves more than one independent and dependent variables. In this study, multiple linear regression (MLR) method is adopted. The equation for multiple linear regression is shown in Eq. (1), where y is the dependent variable, xi is the independent variable, β 0 is a constant, β i is a coefficient.
Analysis and results
Thermal-Hydraulic Model
Figure 4 presents an overview of RELAP5-TMSR nodalization of the SM-MSR. The system consisted of four parts:
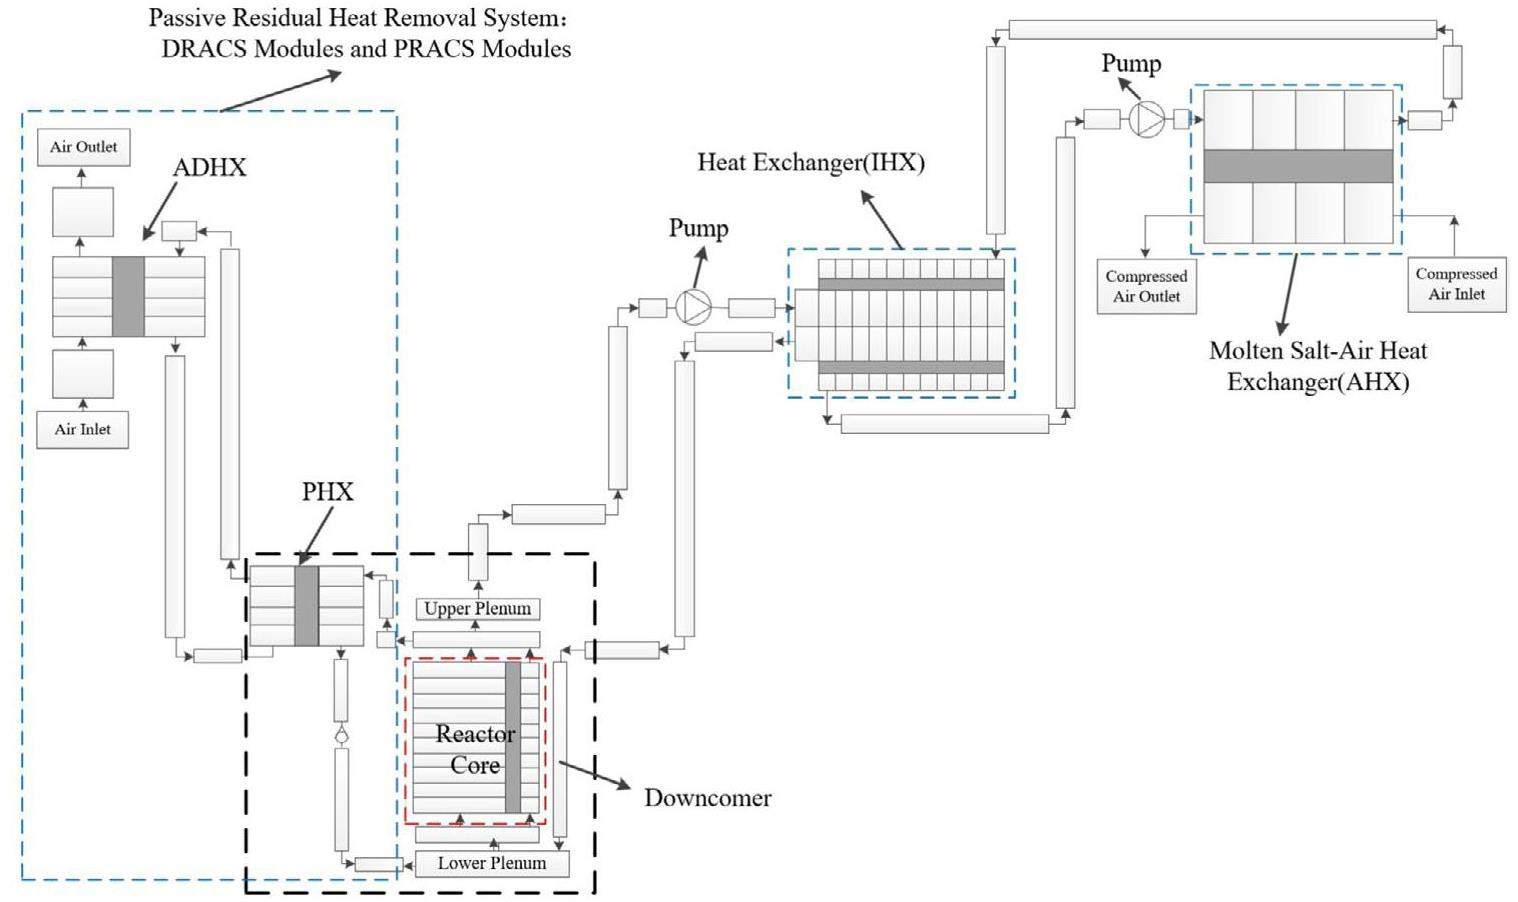
1) The primary circuit includes the downcomer, reactor core, lower plenum, upper plenum, primary pump, pipes, and IHX tube side.
2) 2nd circuit, including pipes, 2nd circuit pump, IHX shell side, and AHX tube side.
3) Brayton cycle modules, including air inlet volume, AHX shell side, and air outlet volume.
4) The passive residual heat removal system, which consists of DRACS and PRACS, includes pipes, PHX, ADHX and an air-cooling loop.
Uncertainties and Sampling
Wilks' formula is frequently used to quantify the minimum computational work required to meaningfully assess model uncertainty by specifying acceptable tolerance limits on the output parameter [39]. A fundamental advantage of using the Wilks' formula is that it has no limit on the number of uncertainty parameters considered in the analysis. The number of code runs required in the uncertainty analysis depends only on the statistical features of the imposed tolerance limits, including the percentile tolerance interval, confidence interval, and order, and is irrelevant to the number of uncertain parameters [28, 29]. The number of code runs for a one-sided tolerance interval can be calculated using Eq. (2), where γ is the percentile tolerance interval, β is the confidence interval, N is the number of input samples(or number of code runs), and m is the order.
| Order | Confidence interval and percentile tolerance | |||
|---|---|---|---|---|
| 0.90&0.90 | 0.95&0.95 | 0.97&0.97 | 0.99 &0.99 | |
| 1st | 22 | 59 | 116 | 459 |
| 2nd | 38 | 93 | 177 | 662 |
| 3rd | 52 | 124 | 231 | 838 |
| 4th | 65 | 153 | 281 | 1001 |
| 5th | 78 | 181 | 330 | 1157 |
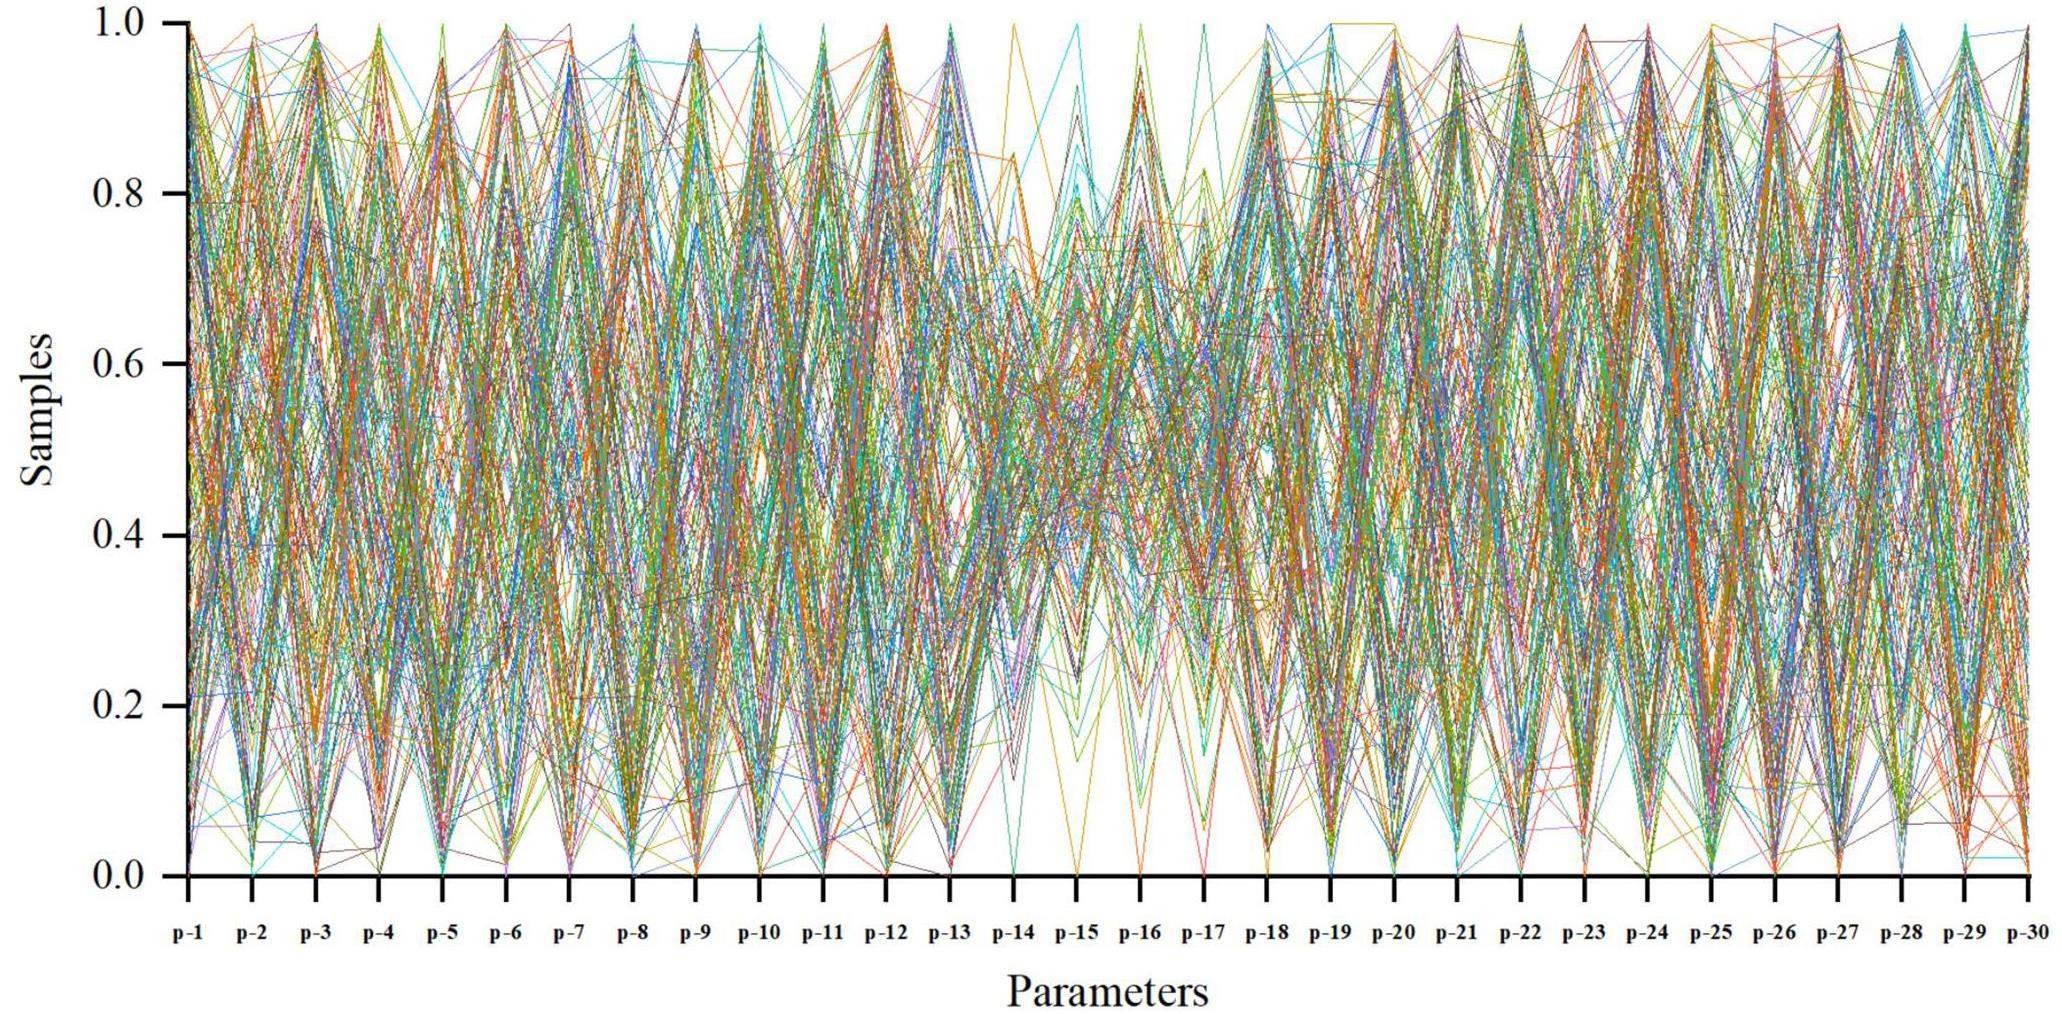
Figure 5 shows the Cobweb plot of 181 random samples for the 30 parameters, where the x-axis shows the uncertain parameters and the y-axis shows the normalized sample values. According to Fig. 5, the achieved sample population is representative and satisfies the requirements of an LOFC uncertainty study.
Safety Variables and Acceptance criteria
The safety variables and their acceptance criteria are crucial for the safety analysis of the SM-MSR. The primary circuit boundary serves as the principal safety barrier against radioactive leaks. Therefore, the performance of Hastelloy-N, which is used as the structural material for the primary circuit, is crucial for reactor safety.
Temperature is a pivotal indicator of the performance of Hastelloy-N, and some studies have confirmed its ability to maintain mechanical properties at 800 ℃ [40]. Considering the direct contact of the fuel salt with Hastelloy-N structural materials, the reactor outlet fuel temperature (Tout) with a limit of 800 ℃ was selected as the criterion in this study.
Uncertainty propagation result
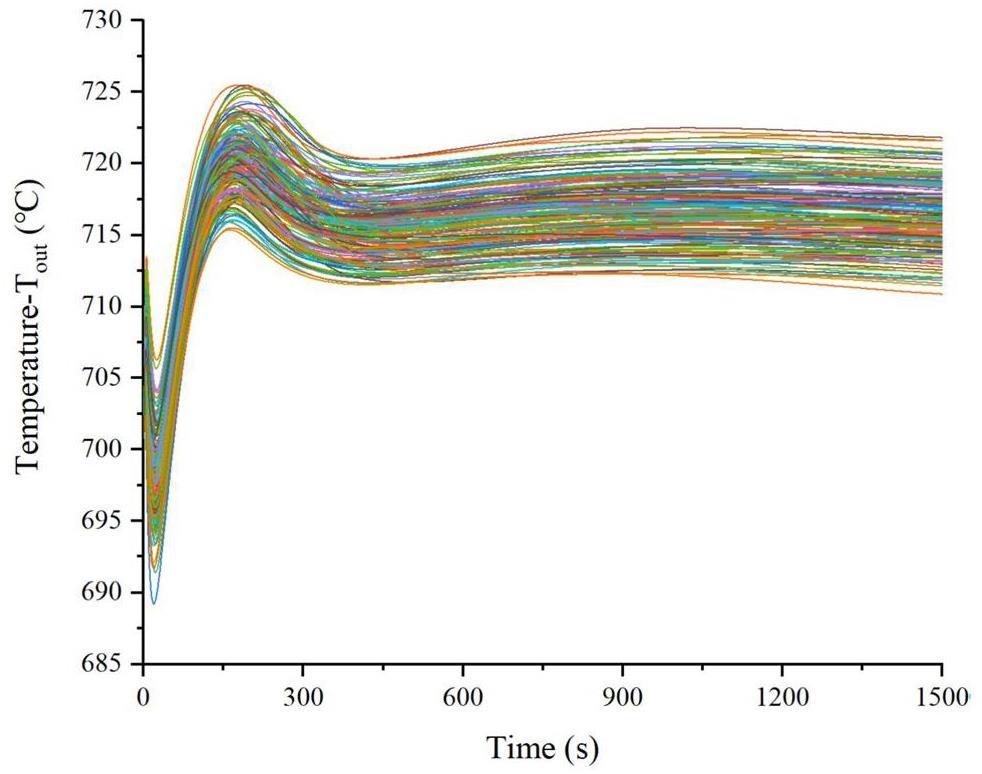
After the code run numbers and sets of uncertain input parameters were established, the input uncertainty was propagated using the RELAP5-TMSR code. Under normal operating conditions, the core flow was driven by a pump at approximately 1000 kg/s. However, following an LOFC event, the pump stops, reducing core flow, which, in turn, increases Tout. Simultaneously, the reactor protection system sends a shutdown signal, causing the control rods to drop and the power to coast down, which in turn reduces Tout.
Under the influence of changes in core flow and nuclear power, Tout reaches its first peak at approximately 10s, reaches the second peak at approximately 200 s, and the second peak is the maximum point. Then, Tout changes slowly and finally reaches a safe and stable temperature, where decay heat continues to be removed by PRACS and DRACS.
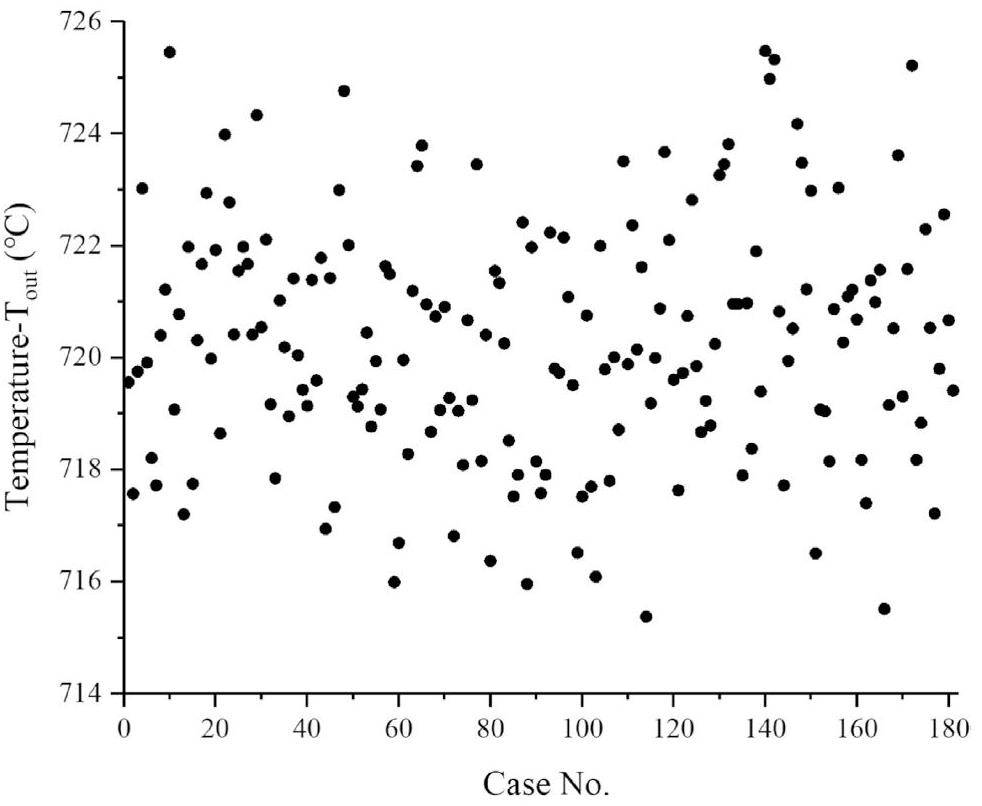
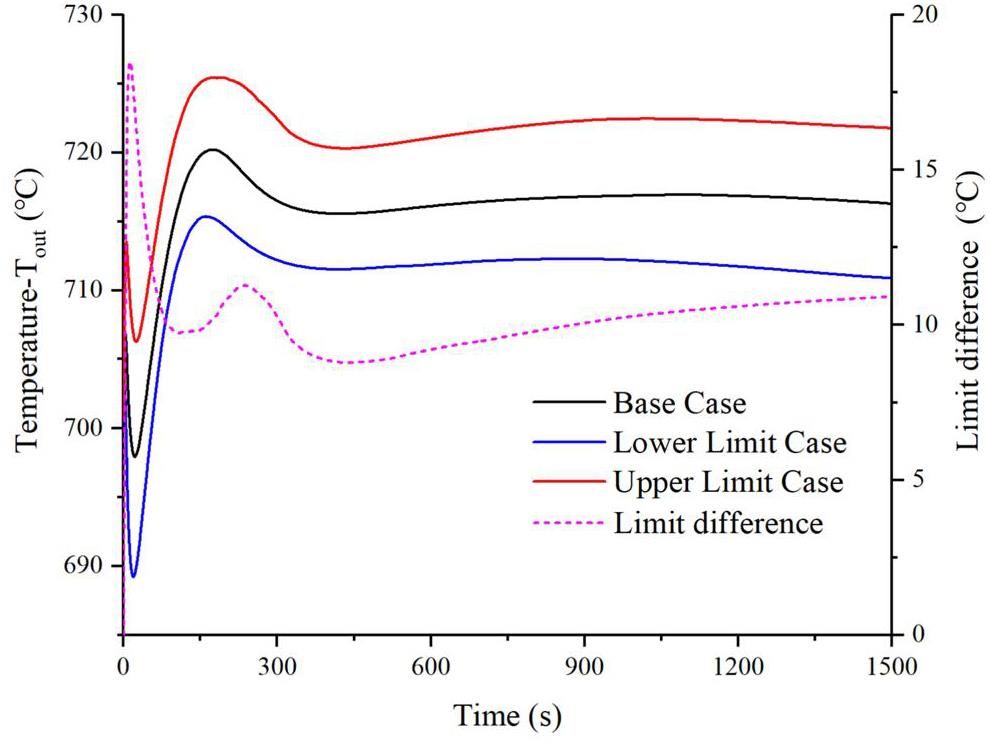
The evolution of Tout for 181 code runs is shown in Figs. 6, and Fig. 7. The figures show the maximum reactor outlet fuel salt temperature (Tout_max) for the 181 cases. However, all the results are below the acceptable criterion (800 ℃), and the maximum and minimum Tout_max are 725.5 ℃ and 715.4 ℃, respectively. Figure 8 illustrates the upper and lower uncertainty bands, with a maximum difference of 18.5 ℃ between the upper and lower bounds observed during the initial temperature ascent phase. In the base case, the maximum temperature increase of the reactor outlet fuel salt (ΔTout) was 22.2 ℃ with respect to the initial condition. In the upper limit case, ΔTout was 25.5 ℃, representing a 26.2% increase relative to the base case, and ΔTout was 15.4 ℃ for the lower limit case, indicating a 23.7% decrease relative to the base case.
Identification of Tout_max Distribution
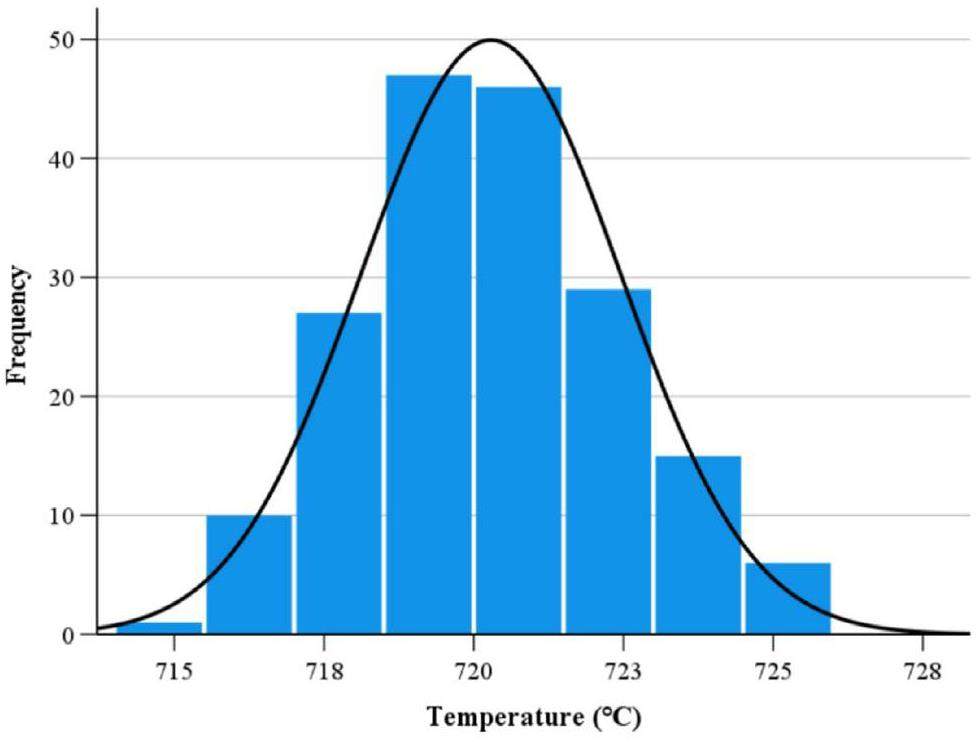
Figure 9 shows the histogram and probability density function obtained from 181 simulations of Tout_max. The data points follow an approximately bell-shaped curve, indicating a normal distribution. In this study, the Shapiro-Wilk (S-W) test [41] was adopted to assess whether the calculated Tout_max followed a normal distribution. The S-W test compares the observed dataset to the expected normal distribution to determine whether the dataset is normally distributed. The test statistic of the S–W test for normality is shown in Eq. 3, where xi represents the ordered random sample values,
A quantile-quantile (Q-Q) plot is a graphical technique for determining whether two datasets originate from populations with a common distribution [42]. In a Q-Q plot, if the data are normally distributed, the points are aligned on a straight diagonal line. Conversely, the greater the number of points in the plot that significantly deviate from this line, the less likely the dataset is to follow a normal distribution. Figure 10 shows the Q-Q plot for Tout_max, where the points mostly lie along a straight diagonal line, with some minor deviations along the tail.
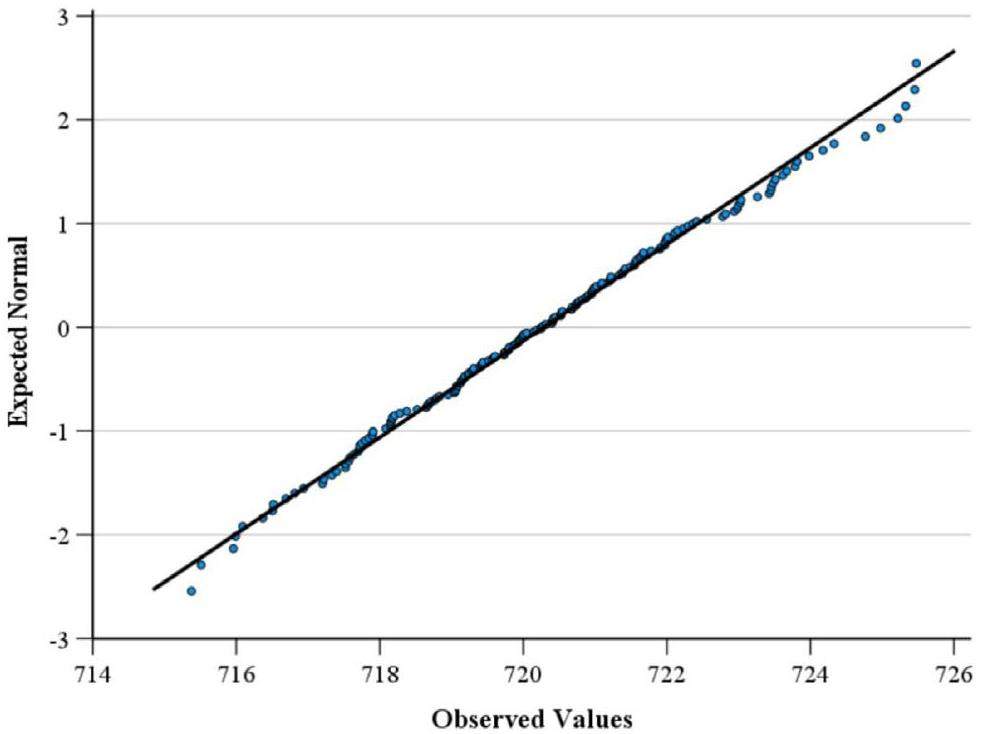
Based on the analysis above, Tout_max follows a normal distribution. Table 4 shows the main statistical results and Tout_max values at different percentiles according to the probability density function.
| Variable | Mean | Standard deviation | Minimum | Maximum | Percentile(%) | ||||
|---|---|---|---|---|---|---|---|---|---|
| 95 | 96 | 97 | 98 | 99 | |||||
| Tout_max (℃) | 720.3 | 2.2 | 715.4 | 725.5 | 724.0 | 724.3 | 724.9 | 725.3 | 725.5 |
Sensitivity Analysis
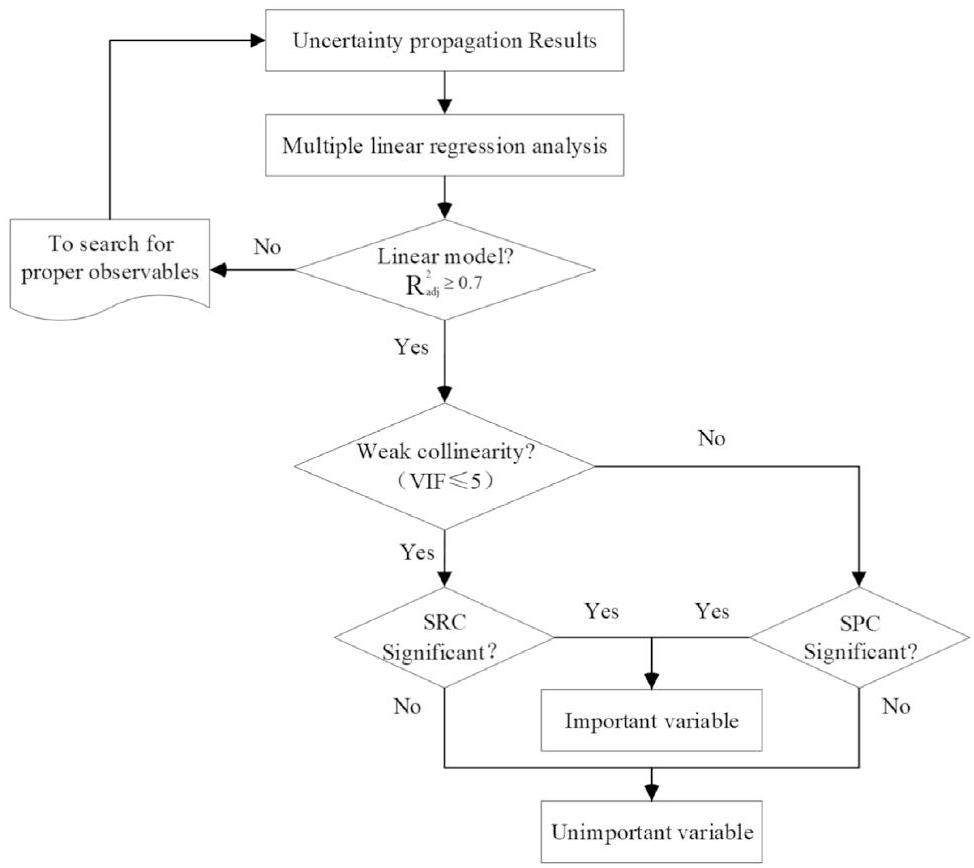
The multiple linear regression (MLR) method was adopted by following the steps outlined in Fig. 3 to ascertain the importance of the input parameters. The F-test was used to assess whether the MLR models complied with statistical laws. The acceptance region was set to have an F-value greater than 1.83 at a significance level of 0.01. Table 5 lists the F value and
| Parameter | F | |
|---|---|---|
| Value | 887.9 | 0.993 |
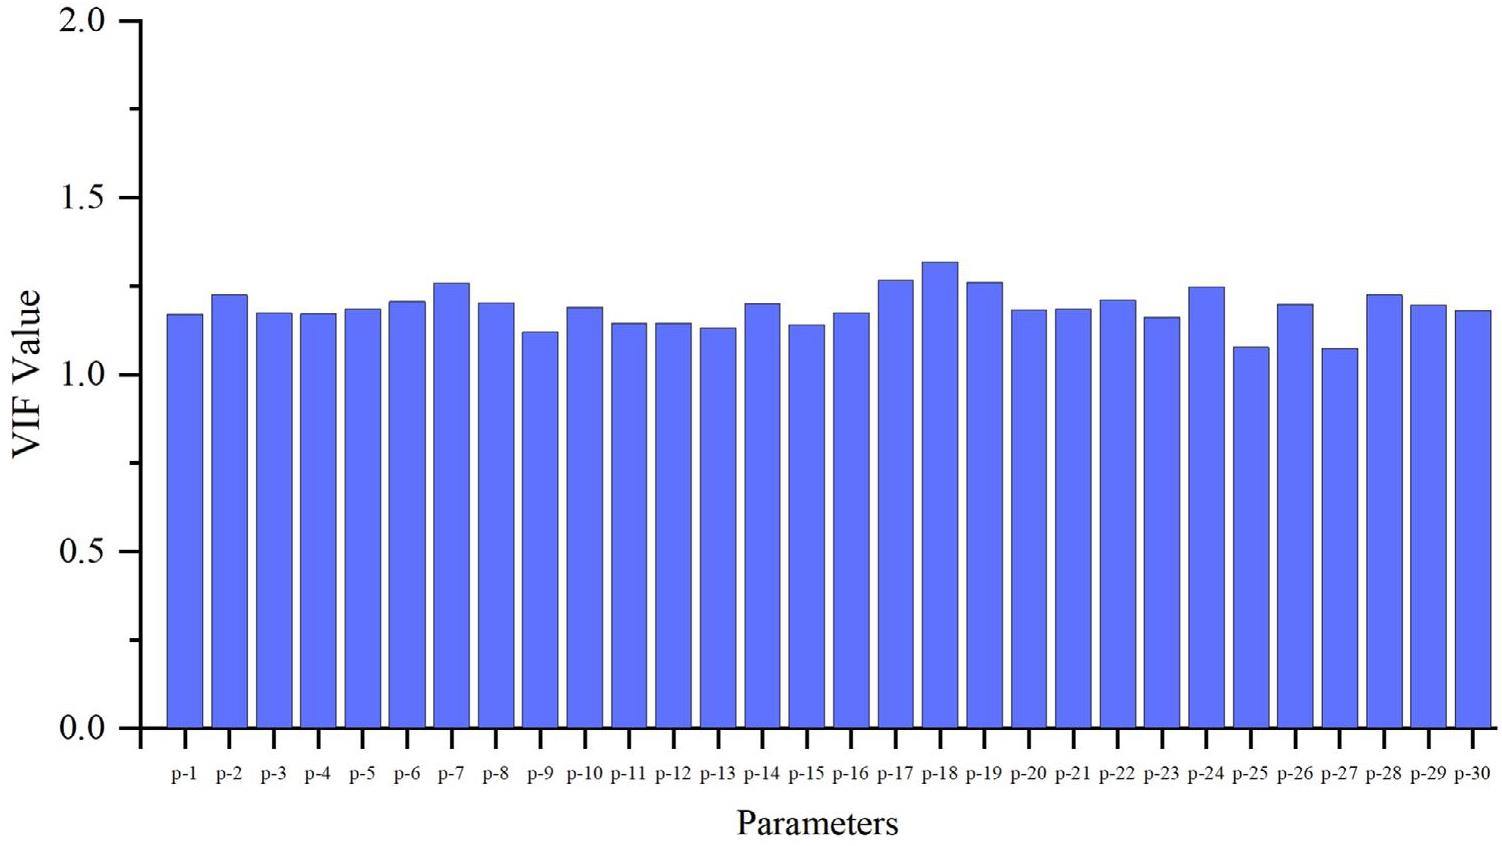
Figure 11 shows the VIF values, which were all less than five; therefore, the SRCs of the input parameters were selected for the sensitivity analysis. The absolute values of the SRCs provide a relative measure of parameter importance, and Fig. 12 presents the final absolute values of the SRCs of 30 input parameters.
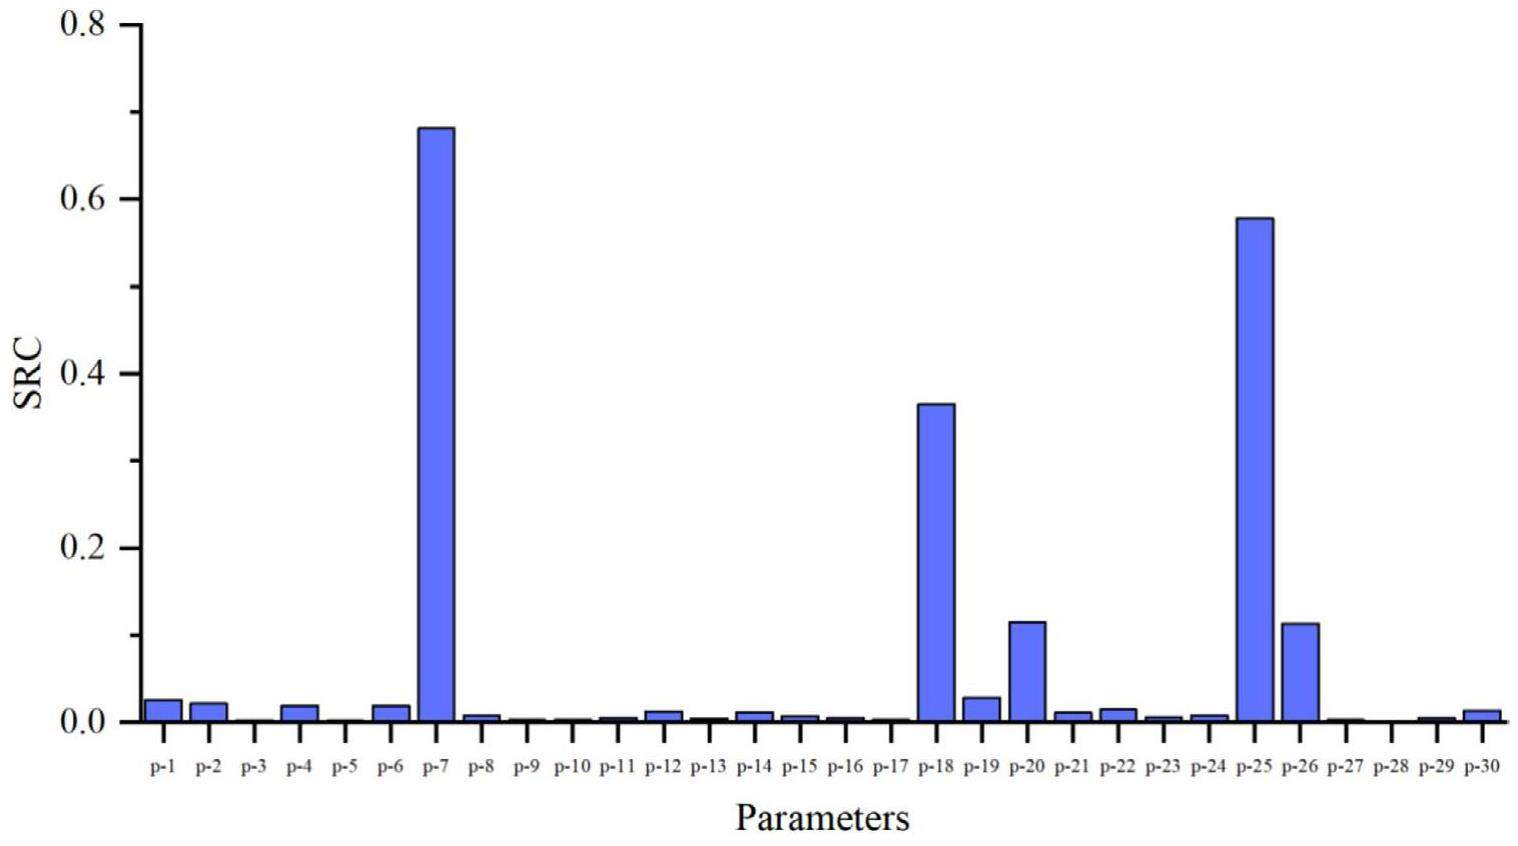
The t-test was performed to test the significance of the sensitivity coefficient. The acceptable range was the absolute value of a t-value larger than 1.66 with a significance level of 0.05. Finally, five important parameters that are considered to have a significant contribution to LOFC consequences based on the t-test and SRCs are listed in Table 6.
| No. | Parameters | SRC | t | |
|---|---|---|---|---|
| 1 | Volumetric heat capacity of fuel salt | CPv_fuel | -0.681 | -99.4 |
| 2 | Local resistance coefficient of reactor core | f_core | 0.578 | 91.1 |
| 3 | Reactor power | P_reactor | 0.365 | 52.0 |
| 4 | Reactor shutdown margin | ρ_shutdown | -0.115 | -17.3 |
| 5 | Local resistance coefficient of primary circuit (excluding reactor core) | f_primary | 0.113 | 16.9 |
Unlike traditional pressurized water reactors, which utilize solid fuels with fission energy transferred from the fuel pellet to the cladding and finally to the coolant, the SM-MSR uses liquid fuel salt, which also serves as the coolant. In this system, fission energy is directly transferred to the coolant. Therefore, the reactor power, the flow of the fuel salt in the reactor, and the properties of the fuel salt are essential to the LOFC consequences. Sensitivity analysis revealed that the volumetric heat of the fuel salt (Density × Specific heat) is the most critical input uncertainty parameter, influencing both heat absorption and fuel salt flow in the reactor core. The reactor power and reactor shutdown margin values can influence the heat generation after a scram; thus, they significantly affect the fuel salt temperature. The local resistance coefficients of the reactor core and primary circuit play a crucial role in affecting the fuel-salt flow, making them important for the fuel-salt temperature. Table 6 lists the relationships among the five important input parameters and Tout_max. A negative SRC indicates a negative correlation, while a positive SRC signifies a positive correlation relationship.
Parameter Prediction
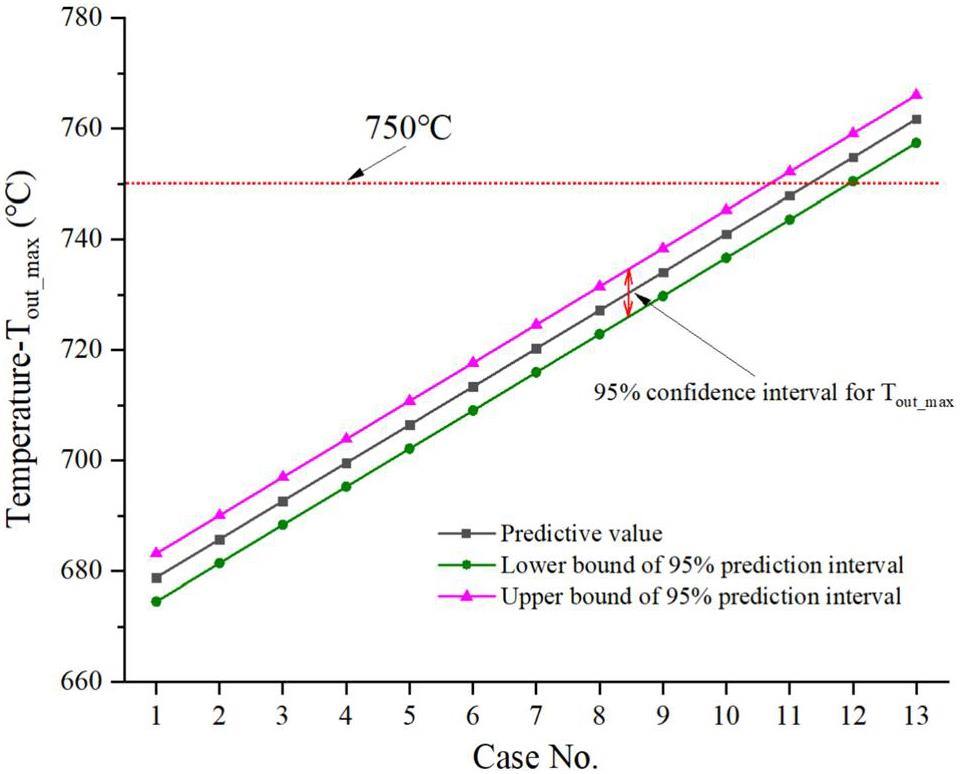
Multiple linear regression can be used to predict the value of one variable using the available information. By using the multiple linear regression method, confident predictive values of Tout_max can be obtained without numerous calculations. Here, we used five important parameters to predict Tout_max.
The Weights of the parameters used for the prediction are shown in Table 7. The RCSs of CPv_fuel and ρshutdown are negative, indicating that there is a negative correlation between these parameters and Tout_max; thus, the weights are arranged from large to small. Conversely, the RCSs of P_reactor, f_core, and f_primary are positive; therefore, the weights are arranged from small to large to obtain a conservative prediction of Tout_max.
| Case No. | ρ_fuel | f_core | P_reactor | ρ_shutdown | f_primary |
|---|---|---|---|---|---|
| 1 | 1.6 | 0.4 | 0.4 | 1.6 | 0.4 |
| 2 | 1.5 | 0.5 | 0.5 | 1.5 | 0.5 |
| 3 | 1.4 | 0.6 | 0.6 | 1.4 | 0.6 |
| 4 | 1.3 | 0.7 | 0.7 | 1.3 | 0.7 |
| 5 | 1.2 | 0.8 | 0.8 | 1.2 | 0.8 |
| 6 | 1.1 | 0.9 | 0.9 | 1.1 | 0.9 |
| 7 | 1.0 | 1.0 | 1.0 | 1.0 | 1.0 |
| 8 | 0.9 | 1.1 | 1.1 | 0.9 | 1.1 |
| 9 | 0.8 | 1.2 | 1.2 | 0.8 | 1.2 |
| 10 | 0.7 | 1.3 | 1.3 | 0.7 | 1.3 |
| 11 | 0.6 | 1.4 | 1.4 | 0.6 | 1.4 |
| 12 | 0.5 | 1.5 | 1.5 | 0.5 | 1.5 |
| 13 | 0.4 | 1.6 | 1.6 | 0.4 | 1.6 |
Section 4.4.2 showed that Tout_max follows a normal distribution, and the significant statistical parameters used for the prediction are listed in Table 4. Figure 13 shows the predicted values of Tout_max and bounds of the 95% prediction interval. The predicted upper bound of the 11th case is 752.2 ℃, slightly exceeding 750 ℃. From Table 7, the weights are 0.6 or 1.4, and the uncertainty range is very large.
Conclusion
In this study, uncertainty and sensitivity analyses of LOFC accidents in a molten salt reactor were conducted using Monte Carlo and multiple linear regression methods. An uncertainty analysis package for the molten salt system was developed, and 181 samples of 30 input uncertainty parameters were propagated through RELAP5-TMSR, successfully executing the package. The uncertainty analysis showed that all cases met the acceptance criterion, and with Tout_max ranging from 715.4 ℃ to 725.5 ℃. Statistical analysis confirmed that Tout_max follows a normal distribution.
According to the statistical analysis, the multiple linear regression method can be used for the LOFC sensitivity analysis of a molten salt reactor. The results indicate that CPv_fuel, f_core, P_reactor, ρshutdown, and f_primary are the most important parameters for LOFC consequences, and these parameters should be key considered during the design and safety analysis of the 150 MWt SM-MSR.
After identifying the Tout_max distribution and completing the sensitivity analysis, a prediction study of Tout_max using MLR was conducted. When the uncertainty of the five key parameters reached 40%, the predicted Tout_max was 752.2 ℃, maintaining a substantial safety margin below the acceptance criterion (800 ℃).
Future research will focus on refining the uncertainty range of critical input parameters through combined experimental and rigorous numerical analysis to further reduce accident consequence uncertainty.
Advanced fission energy program - TMSR Nuclear Energy System
. Bull. Chin. Acad. Sci. 27(3), 366-374 (2012). https://doi.org/10.3969/j.issn.1000-3045.Thorium-based molten salt reactors, and the utilization of nuclear energy
. Mod. Phys. 30, 25-34 (2018).https://doi.org/10.13405/j.cnki.xdwz.2018.04.007 (in Chinese)The introduction of the safety of Molten Salt Reactor
. Nucl. Saf. 3, (13)(2011). https://doi.org/10.3969/j.issn.1672-5360.2011.03.013 (in Chinese)Thorium molten salt reactor nuclear energy system
. Physics 45(9), 578-590 (2016).https://doi.org/10.7693/wl20160904 (in Chinese)Effect of scramble rod drop time on the consequences of molten salt reactor reactivity insertion transient
. Nucl. Tech. (in Chinese) 43(9),Preliminary study on safety characteristics of Molten Salt Reactor
. Atom Energy Sci. Technol. 48, 2280-2286 (2014). https://doi.org/10.7538/yzk.2014.48.12.2280 (in Chinese)Research on inherent safety and related key issues of a Moiten Salt Reactor
. At. Energy Sci. Technol. 43(z1), p.64-75 (2024). (in Chinese)Study on dynamic characteristics of fission products in a 2 MW molten salt reactor
. Nucl. Sci. Tech. 31(2), 17 (2020). https://doi.org/10.1007/s41365-020-0730-z.Simulation of neutron diffusion and transient analysis of MSR
. Nucl. Sci. Tech. 25,Molten Salt Reactor: A new source of innovation development for radiochemistry
. J. Nucl. Radiochem. 38, 327-336(2016). https://doi.org/10.7538/hhx.2016.38.06.0327 (in Chinese)Preliminary analysis of fuel cycle performance for a small modular heavy-water-moderated thorium molten salt reactor
. Nucl. Sci. Tech. 31, 108 (2020). https://doi.org/10.1007/s41365-020-00823-5Study on Molten Salt Circulation System in the Reactor of Nuclear Power Generation
. Chem. Equip. Technol. 36(4), 6-9 (2015). https://doi.org/10.3969/j.issn.1007-7251.2015.04.002 (in Chinese)Steady thermal hydraulic analysis of the molten salt reactor
. Nucl. Sci. Tech. 19, 187-192 (2008). https://doi.org/10.1016/S1001-8042(08)60048-2.Neutronic effect of graphite dimensional change in small modular molten salt reactor
. Int. J. Energ. Res. 45(8), 11976-11991 (2021). https://doi.org/10.1002/er.5964Best estimate plus uncertainty (BEPU): status and perspectives
. Nucl. Eng. Des. 352,Overview in the development of best estimate plus uncertainty safety analysis
. Sci. Technol. Div. 24, 11-13, 16 (2015). https://doi.org/10.19694/j.cnki.issn2095-2457.2015.24.003 (in Chinese)Application of multiple linear regression to trip setpoint analysis of a reactivity-initiated accident in a molten salt reactor
. Int. J. Energ. Res. 45(8), p.11629-11641(2020). https://doi.org/10.1002/er.5418.Study on sensitivity of initial conditions of reactivity-initiated accident under low-power conditions of a molten salt reactor
. Nucl. Tech. (in Chinese) 44(6),Preliminary uncertainty and sensitivity analysis of steady-state Molten Salt Fast Reactor using Polynomial Chaos Expansion method
. Ann. Nucl. Energy. 159, p.Uncertainty analysis of heat transfer in TMSR-SF0 simulator
. Nucl. Eng. Des. 56(2), 762-769 (2024). https://doi.org/10.1016/j.net.2023.11.016.Development of RELAP/SCDAPSIM/MOD4.0 for Advanced Fluid Systems Design Analysis
.Thermal-hydraulics system codes uncertainty assessment: a review of the methodologies
. Ann. Nncl. Energy. 36(11-12), 1774-1786 (2009). https://doi.org/10.1016/j.anucene.2009.08.018.Probabilistic approach to quantifying uncertainties in the progression of severe accidents
. Nucl. Sci. Eng. 102(3), 219-259 (1987). https://doi.org/10.13182/NSE89-A27476Development of good practice guidance for quantification of thermal-hydraulic code model input uncertainty
. Nucl. Eng. Des. 354,Model validation for thermal hydraulic behavior in the natural circulation of molten salt
.Determination of sample sizes for setting tolerance limits
. Ann. Math. Stat. 12(1), 91-96 (1941).Risk assessment study of Wilks' formula for uncertainty quantification of design extension condition scenarios in prototype Gen-IV sodium fast reactor
. J. Nucl. Sci. Technol. 55 746-755 (2018). https://doi.org/10.1080/00223131.2018.1435317.Specialized code for transient operation analysis and its application in fluoride salt-cooled high-temperature reactors
. Nucl. Sci. Tech. 28, 132-144 (2017). https://doi.org/10.1007/s41365-017-0268-x.Development and analysis of a K-nearest-neighbor-based transient identification model for molten salt reactor systems Nucl
. Tech. (in Chinese) 46(11),Development and application of multi-scale thermal fluid coupling program for molten salt-cooled fast reactor based on RELAP5 and the sub-channel program Nucl
. Tech. (in Chinese) 45(7),Survey of sampling-based methods for uncertainty and sensitivity analyses
. Reliab. Eng. Syst. Safe. 91(10-11), 1175-1209 (2006). https://doi.org/10.1016/j.ress.2005.11.017.Regression model for nuclear characteristics of sodium-cooled fast reactor core
. J. Nucl. Sci. Technol. 12, 61-63 (1975). https://doi.org/10.1080/18811248.1975.9733069.An algorithm for quantifying dependence in multivariate data sets
. Nucl. Instrum. Methods Phys. Res. Sect. A 698, 84-89 (2013). https://doi.org/10.1016/j.nima.2012.09.043.Identification of reliable regression- and correlation-based sensitivity measures for importance ranking of water-quality model parameters
. Environ. Modell. Softw. 23(5), 1364-8152 (2008). https://doi.org/10.1016/j.envsoft.2007.08.001.Functional reliability analysis of molten salt natural circulation system
. Nucl. Eng. Des. 332, 127-136(2018). https://doi.org/10.1016/j.nucengdes.2018.03.024.GRS method for uncertainty and sensitivity evaluation of code results and applications
. Sci. Technol. Nucl. Ins. 2008, 1-7 (2008). https://doi.org/10.1155/2008/798901.ATWS accident analysis of rod withdrawal in small modular molten salt reactor
. Nucl. Tech. 45(5), p.85-96(2022). https://doi.org/10.11889/j.0253-3219.2022.hjs.45.050603.An analysis of variance test for normality (complete samples)
. Biometrika. 52, 591-611 (1965). https://doi.org/10.1093/biomet/52.3-4.591.Comparison of multivariate distributions using quantile-quantile plots and related tests
. Bernoulli. 20(3), 1484-1506 (2014). https://doi.org/10.3150/13-BEJ530.The authors declare that they have no competing interests.

