Introduction
Nuclear energy is increasingly recognized as a key solution for “carbon-free” electricity generation [1, 2]. However, nuclear energy does not provide transportation fuels with the same flexibility as gasoline. Hydrogen, produced through nuclear energy systems, bridges this gap by offering an alternative fuel for transportation. With advancements in technology, hydrogen energy holds the potential to deliver significant environmental and economic benefits [3, 4]. Hydrogen production via thermochemical cycling has been studied for several decades, with High-Temperature Gas-Cooled Reactors (HTGRs) serving as the primary heat source for nuclear-based hydrogen production. Most thermochemical cycles operate at high temperatures to maximize energy conversion efficiency. HTGRs are particularly well-suited for integration with high-temperature thermochemical cycles, enabling hydrogen production through high-temperature electrolysis or thermochemical processes. This integration provides an environmentally friendly and cost-effective approach to hydrogen production [5, 6].
Liquid hydrogen, characterized by its high energy density, purity, and significant economies of scale, offers distinct advantages for long-distance and large-scale transportation. However, due to its extremely low temperature, low molecular weight, and tendency to degrade the properties of materials in contact with it, liquid hydrogen is prone to leakage. These leaks, especially during usage, can lead to dangerous incidents such as fires and explosions. Unlike gaseous hydrogen leaks, liquid hydrogen leaks result in heavy gas dispersion and remain on the ground for extended periods. This increases the risk of ignition, as the volume of hydrogen gas formed upon evaporation is much larger. The use of liquid hydrogen may lead to physical explosions caused by rapid expansion, typically in two forms: Boiling Liquid Expanding Vapor Explosion (BLEVE) and rapid phase-transition (RPT) explosion. In a BLEVE, pressure vessels rupture due to the thermal expansion of liquid hydrogen, releasing both liquid and vapor explosively and generating fireballs, pressure vessel fragments, and shockwaves that can cause severe damage. An RPT explosion occurs when hydrogen storage tanks rupture and come into contact with high-temperature solids or leaked refrigerants, causing rapid vaporization and the explosive formation of steam. This generates shockwaves that can lead to injury or further damage.
Numerous researchers have conducted experimental studies on the heat transfer and boiling processes of liquid hydrogen. A small heating platform was constructed by Class [7] to investigate the heat transfer characteristics of hydrogen gas. However, the experimental data were inconsistent with previous studies, and some even contradicted earlier findings, highlighting the complexity of heat transfer in hydrogen gas. Shirai [8] conducted thermal-hydraulic experiments on liquid hydrogen to explore the effects of subcooling and pressure on its heat transfer properties. Their method examined the influence of various pressures on the critical heat flux (CHF) of a flat-plate heater, showing an initial increase followed by a decrease. At low pressures, the experimental CHF value exceeded the predicted value, whereas at high pressures, it was lower than the predicted value. In addition to experimental studies, macroscopic simulation methods have been employed to study the boiling behavior of liquid hydrogen. Wang [9] investigated the boiling of subcooled liquid hydrogen pools under different gravity conditions using a combination of the VOF and Lee phase-change models. The results indicated that under extremely low gravity or excessive subcooling, a thin gas film formed on the heated surface instead of bubbles detaching from it. Zheng et al. [10] developed a three-dimensional numerical method to analyze the impact of surface vibrations and microgravity on heat transfer in hydrogen pipelines. The study found that vibration significantly enhanced convective heat transfer efficiency, particularly at lower Reynolds numbers.
Vaporization nucleation, the onset of the boiling heat exchange process, requires detailed investigation. Molecular dynamics (MD) methods have gained prominence alongside experimental and macroscopic simulations in examining nucleation and boiling phenomena. In recent years, numerous studies employing molecular dynamics to investigate various media at the microscale have greatly enhanced our understanding of these complex processes [11-13].
Moreover, molecular dynamics simulations have proven to be versatile, extending beyond water and argon to include hydrogen. Scholars such as Hao Hao [14] have utilized molecular dynamics to investigate the impact of different pressures, temperatures, and graphene bubble structures on hydrogen storage. These studies highlight the significant advantages of graphene bubble structures for enhancing hydrogen storage. Wang [15] conducted MD simulations to study hydrogen storage in hydrates. The findings suggest that reducing temperature is more effective than increasing pressure for storing H2, with the strongest hydrogen storage capacity observed at 240 K. Li [16] explored hydrogen diffusion in carbonate fissures using molecular dynamics, studying the effects of pore size, water content, and salinity on the diffusion process. Similarly, Jiang [17] employed MD simulations to examine the storage of molecular hydrogen in a novel 3D carbon structure, specifically pillar-supported graphene bubbles, under different environmental conditions. The study found that temperature, pressure, and graphene layer spacing all influenced hydrogen storage, and optimizing these parameters maximized the storage capacity. Thomas [18] described the interatomic forces between hydrogen atoms using density functional theory and tight-binding electronic structure techniques. This approach enabled molecular dynamics simulations of highly compressed liquid hydrogen, with the results aligning with experimental observations of rapid changes in conductivity with temperature and density.
Although extensive research has focused on the microscale boiling of argon and water, it is essential to recognize the molecular differences between hydrogen, argon, and water. Argon (Ar) is a monatomic gas consisting of individual Ar atoms, while water molecules are compounds formed by hydrogen and oxygen atoms. Hydrogen, in its molecular form, consists of two hydrogen atoms bonded covalently, unlike argon, which does not involve electron sharing or transfer between its atoms.
Consequently, significant differences were observed in the boiling process of liquid hydrogen compared to argon and water. The limited research on the microscale boiling behavior of liquid hydrogen—particularly regarding factors such as liquid hydrogen thickness, surface wettability, and temperature—has been acknowledged. This study aims to bridge this knowledge gap by simulating the boiling process of liquid hydrogen using molecular dynamics. Through these simulations, we sought to gain a deeper understanding of the heat transfer behavior of liquid hydrogen during boiling, thereby advancing our knowledge of this unique substance. The potential benefits of this study are twofold: First, from a theoretical standpoint, our findings contribute to a more comprehensive understanding of the thermodynamics and kinetics of liquid hydrogen boiling at the molecular level. Second, from a practical perspective, the insights gained can inform the design and optimization of future hydrogen-based energy systems, including fuel cells and hydrogen storage solutions. By enhancing the efficiency and safety of these systems, this research has the potential to pave the way for a more sustainable and environmentally friendly energy future.
Simulation system
This study constructs a simulation box to investigate the vaporization and nucleation of hydrogen, with dimensions of 8 nm × 8 nm × 40 nm, as shown in Fig. 1. Periodic boundary conditions were applied in the xy direction, whereas a reflective wall was placed at the top of the z direction, causing the molecules to rebound without any change in speed upon impact. The bottom layer of aluminum atoms was held fixed, while the middle layer of atoms generated heat flow. The upper layer of aluminum atoms transferred this heat to the liquid hydrogen.
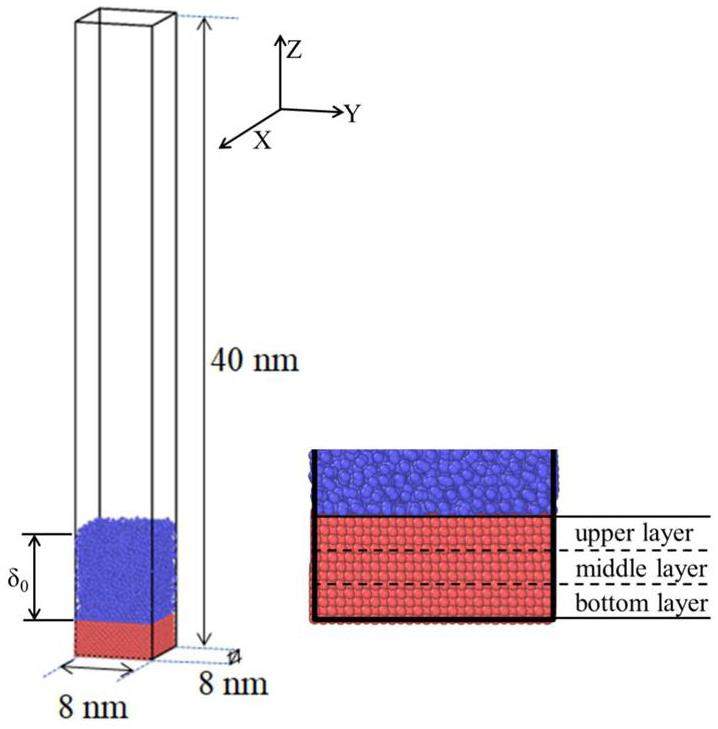
The bottom layer consisted of aluminum (Al) atoms arranged in a face-centered cubic (FCC) structure, with the bottom particles serving as the fixed layer, the middle particles as the heating layer, and the top particles as the heat transfer layer. The interaction potential between the particles was modeled using the Lennard-Jones potential:
In each computational step, the particle's equation of motion was solved using the velocity-Verlet algorithm [21, 22]. The parameters for the interaction between the wall and the liquid are shown in Table 1. This study employed the LAMMPS software to simulate the phenomenon of boiling heat transfer in the aforementioned process. Additionally, OVITO was used for visualization. The model used in this study is based on previous work [23] and employs the CVFF potential to simulate the covalent bonds formed between hydrogen atoms. The formula used is as follows:
| Interaction type | ε (eV) | σ (Å) |
|---|---|---|
| H-H | 2.87 | 0.0025162 [24] |
| Al-H | 2.75 | 0.01835 |
| Al-Al | 2.52 | 0.257 |
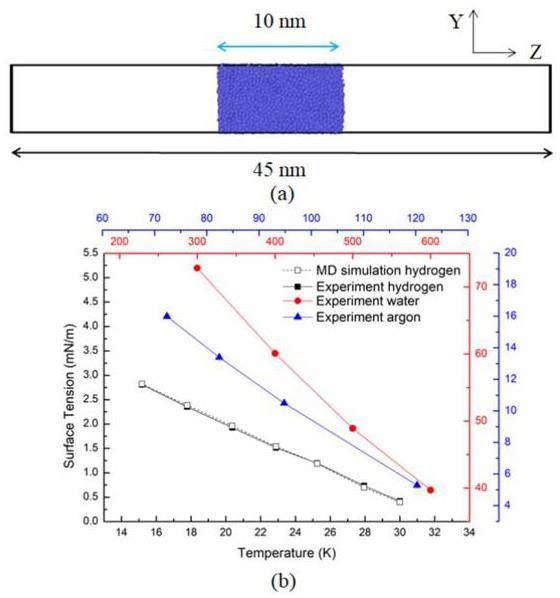
The density of the hydrogen film was 0.206 g/cm3, and the thickness of the liquid film, as well as the number of hydrogen molecules, are presented in 2. The density of the liquid phase region at 20 K and 0.1 MPa was measured at 70.51 kg/m3. The simulation data in this study were shown to be applicable, with a difference of less than 5% compared to the experimental results.
| Liquid film, δ0 (nm) | 1.5 | 3 | 5 | 7 |
|---|---|---|---|---|
| Number, N | 6027 | 12038 | 200640 | 28089 |
As illustrated in Fig. 2(a), a 5 nm × 5 nm × 45 nm box was constructed, with a 10 nm thick liquid film positioned centrally, and a 5 nm × 5 nm × 10 nm liquid film located at the center of the box. After a relaxation period of 10 ns, the system reached equilibrium. The surface tension was calculated using the following equation:
Results and discussion
Effect of liquid film thickness on nucleation
To investigate the influence of varying liquid film thicknesses on the nucleation of liquid hydrogen, simulations were conducted with four different liquid film thicknesses: 1.5, 3, 5, and 7 nm.
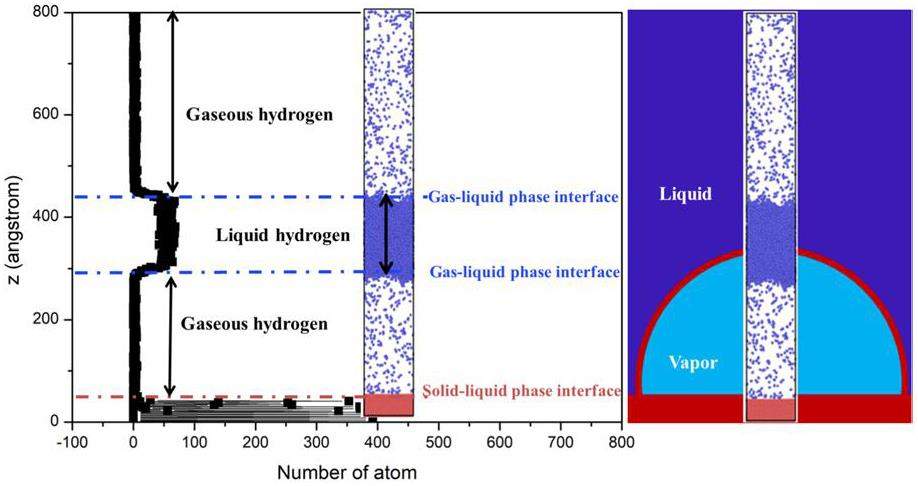
In Fig. 3, a scenario is shown where a 7 nm thick liquid film is rapidly heated to 200 K on the wall surface. At this point, the liquid temperature exceeds the threshold for nucleation, triggering vaporization beneath the liquid film, which is subsequently propelled upward due to pressure. The left side of the figure displays the particle count along the z-axis in the system model, where a higher particle concentration at lower heights corresponds to a solid wall. The region with a higher particle concentration in the middle represents the liquid hydrogen film, while the areas above and below the liquid film show fewer particles owing to the evaporation of hydrogen gas, though not completely void of particles. The image on the right shows a snapshot of the molecular dynamics simulation of bubble nucleation. Owing to the scale limitations of molecular dynamics, only a portion of the bubble formation can be simulated. Consequently, a change in the center-of-mass position of the liquid film represents the formation and growth of the bubble.
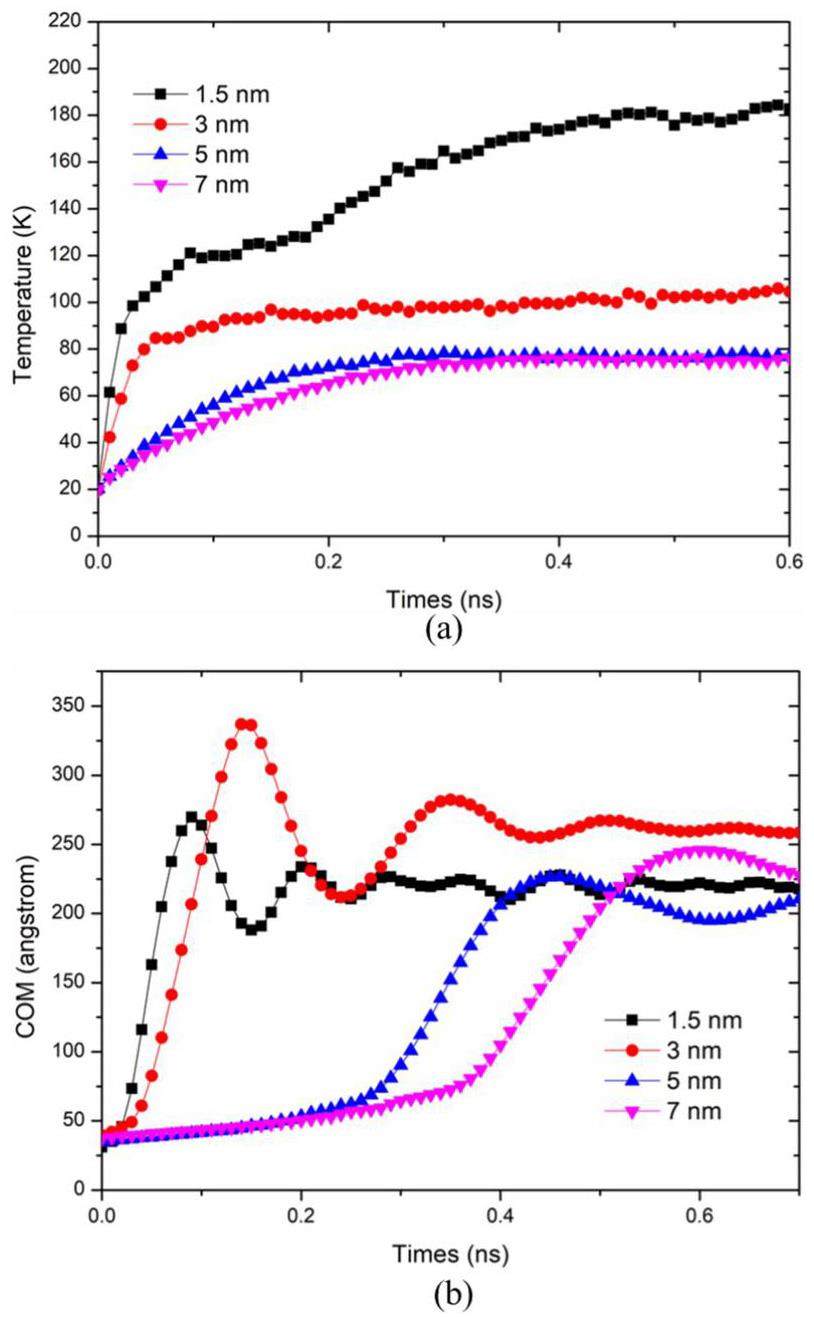
Heating process of the system: The system was initially equilibrated for 0.2 nanoseconds. Subsequently, the liquid film was heated by adjusting the surface temperature. Two heating methods were employed: 1) Directly raising the surface temperature to the design temperature after 0.2 nanoseconds, and 2) Gradually increasing the surface temperature. An equilibration period was also included, followed by a 0.2 nanosecond relaxation before starting the heating process. Figure 4 illustrates the variations in the center of mass and thickness of the liquid films over time under rapid heating to 200 K on the wall surface for different film thicknesses. As depicted in Fig. 4, the temperatures of the 1.5 nm and 3 nm liquid films increase significantly faster compared to the 5 nm and 7 nm films upon heating. Additionally, the center of mass of the liquid films rises rapidly in tandem with the temperature increase. The 5 nm liquid film heats slightly faster, with its center of mass remaining relatively stable until approximately 0.3 ns, after which it begins to rise. The 7 nm liquid film exhibited the slowest heating rate, and nucleation occurred the latest. These observations suggest that thinner liquid films reach the nucleation temperature more quickly, leading to earlier nucleation when the film is thinner.
During the heating process, a dimensionless parameter, t*, was defined to track the nucleation process. This parameter represents the time normalized from the initiation of heating until the center of mass reaches its highest point, marking the completion of nucleation. Specifically, t*=0 indicates the onset of nucleation, while t*=1 signifies the completion of the nucleation process.
Figure 5(a) illustrates the scenario with a liquid film thickness of 1.5 nm. At t* = 0.25, the liquid film begins to rise. By t*= 0.5 and t*= 0.75, the liquid film continues to ascend while undergoing evaporation. At t*= 1, the thickness of the liquid film decreases due to evaporation, with molecular clustering beginning to form at the surface. Figure 5(b) depicts the case with a 3 nm thick liquid film. At t* = 0.25, there is no significant reaction. At t*= 0.5, nucleation begins, and vaporization occurs; however, some particles remain attached to the wall. By t*=0.75, the liquid film continues to rise, with a decrease in the molecular count at the center and the presence of hydrogen gas molecular aggregation at the surface. Figure 5(c) shows the case with a 5 nm liquid film. At t*=0.25, the temperature of the liquid film is still relatively low, resulting in only a few particles exhibiting evaporation behavior. At t*= 0.5, evaporation increases. At t*= 0.75, nucleation of vaporization occurs, and at t*= 1, the height of the liquid film continues to increase. Figure 5(d) shows the case with a 7 nm liquid film. At t* = 0.25, only a few particles undergo evaporation. At t*= 0.5, some particles continue to evaporate, but the film remains less than 5 nm thick. At t*= 0.75, the liquid film separates from the wall and undergoes nucleation. At t*= 1, the height of the liquid film increases within the system, albeit slightly lower than the 5 nm thickness at the same stage.
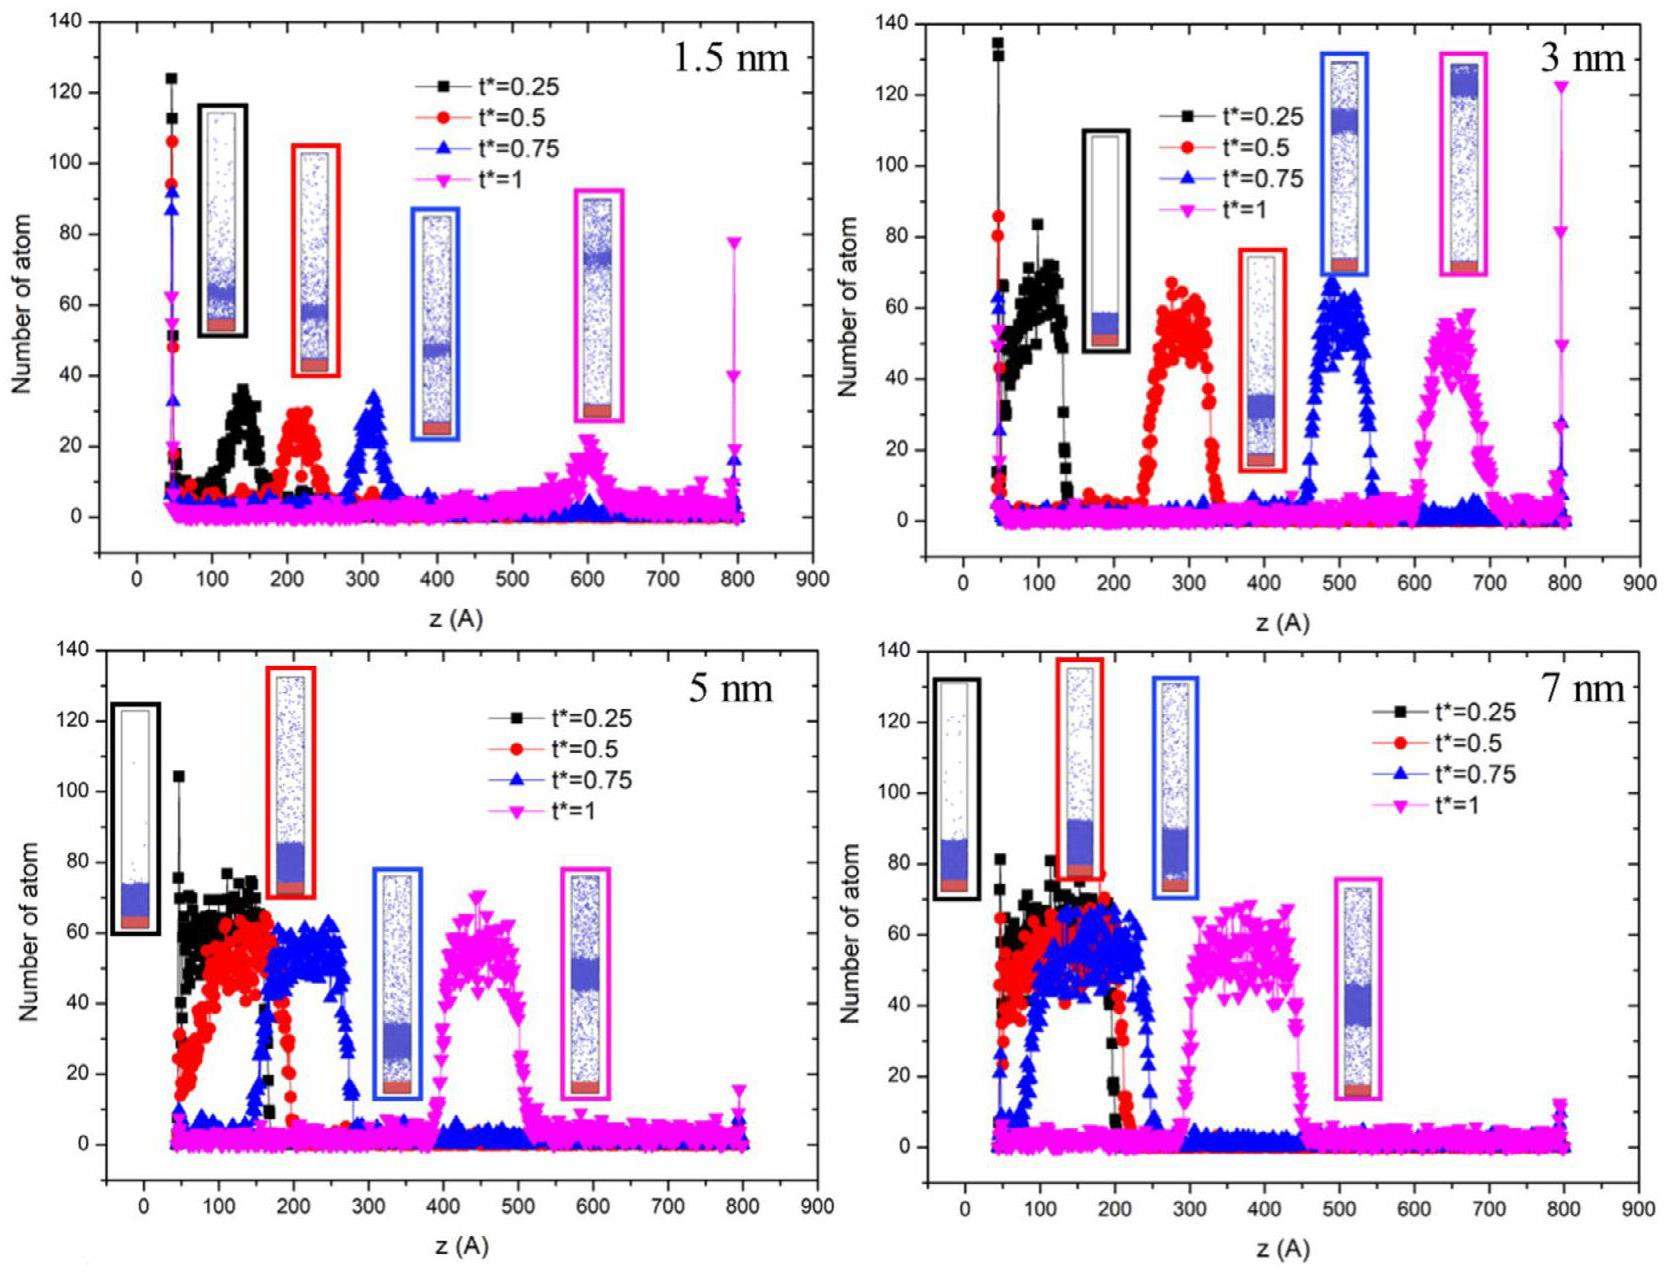
Through the aforementioned comparisons, it was observed that thinner liquid films exhibited faster temperature increases under identical heating conditions. However, rapid evaporation in thinner films may result in an insufficient number of molecules within the liquid film, leading to significant errors in describing bubble growth by monitoring the center of mass. Consequently, a liquid film thickness of 7 nm was adopted for subsequent studies to mitigate this issue.
Effects of different heating methods on nucleation
Two heating methods were simulated: gradual and rapid. This design reflects the temperature variations in two common scenarios during liquid hydrogen leakage events: one where a severe accident causes a sudden temperature increase in the insulation layer over a short period, and the other where a less severe accident results in a gradual temperature increase. For these two heating methods, final heating temperatures of 100 K, 200 K, and 300 K were set to investigate their effects on the vaporization nucleation of liquid hydrogen.
Figure 6 depicts the change in wall temperature over time for the two heating methods. In the case of rapid heating, the wall temperature quickly reached its final value at the onset of heating and remained constant thereafter. In contrast, for gradual heating, the wall temperature increased linearly with the heating duration. Figure 6(b) illustrates the temporal evolution of the liquid-film temperature under the two heating methods. With rapid heating, the liquid-film temperature increased rapidly. Specifically, the liquid film on a 300 K wall reached the final temperature at t = 0.1 ns, while the film on a 200 K wall reached the final temperature at t = 0.3 ns. In contrast, the liquid film on a 100 K wall exhibited a more gradual heating rate, reaching the final temperature only at t = 1 ns. Under gradual heating, the temperature variation in the liquid film was minimal before t = 0.1 ns. Subsequently, in the 300 K scenario, the temperature began to rise, achieving the final temperature at the fastest rate by t = 0.6 ns. The film with a final temperature of 200 K experienced the second-highest heating rate after t = 0.1 ns. The film with a final temperature of 100 K exhibited the slowest heating rate, reaching the final temperature at t = 1 ns. Figure 6(f) illustrates the energy disparity of the liquid film under various heating methods. Initially, rapid heating significantly accelerated the temperature increase in the liquid film, resulting in a growing temperature differential. After nucleation, the temperature variation in the liquid film decreased due to escalating thermal resistance (see Fig. 9(b)), while the uniformly heated surface temperature continued to increase. Consequently, the energy disparity between the different heating methods showed an initial increase, followed by a decrease. The times at which the maximum energy gaps appeared at temperatures of 100 K, 200 K, and 300 K were 0.44 ns, 0.29 ns, and 0.16 ns, respectively. This indicates that higher surface temperatures promote the occurrence of maximum energy gaps.
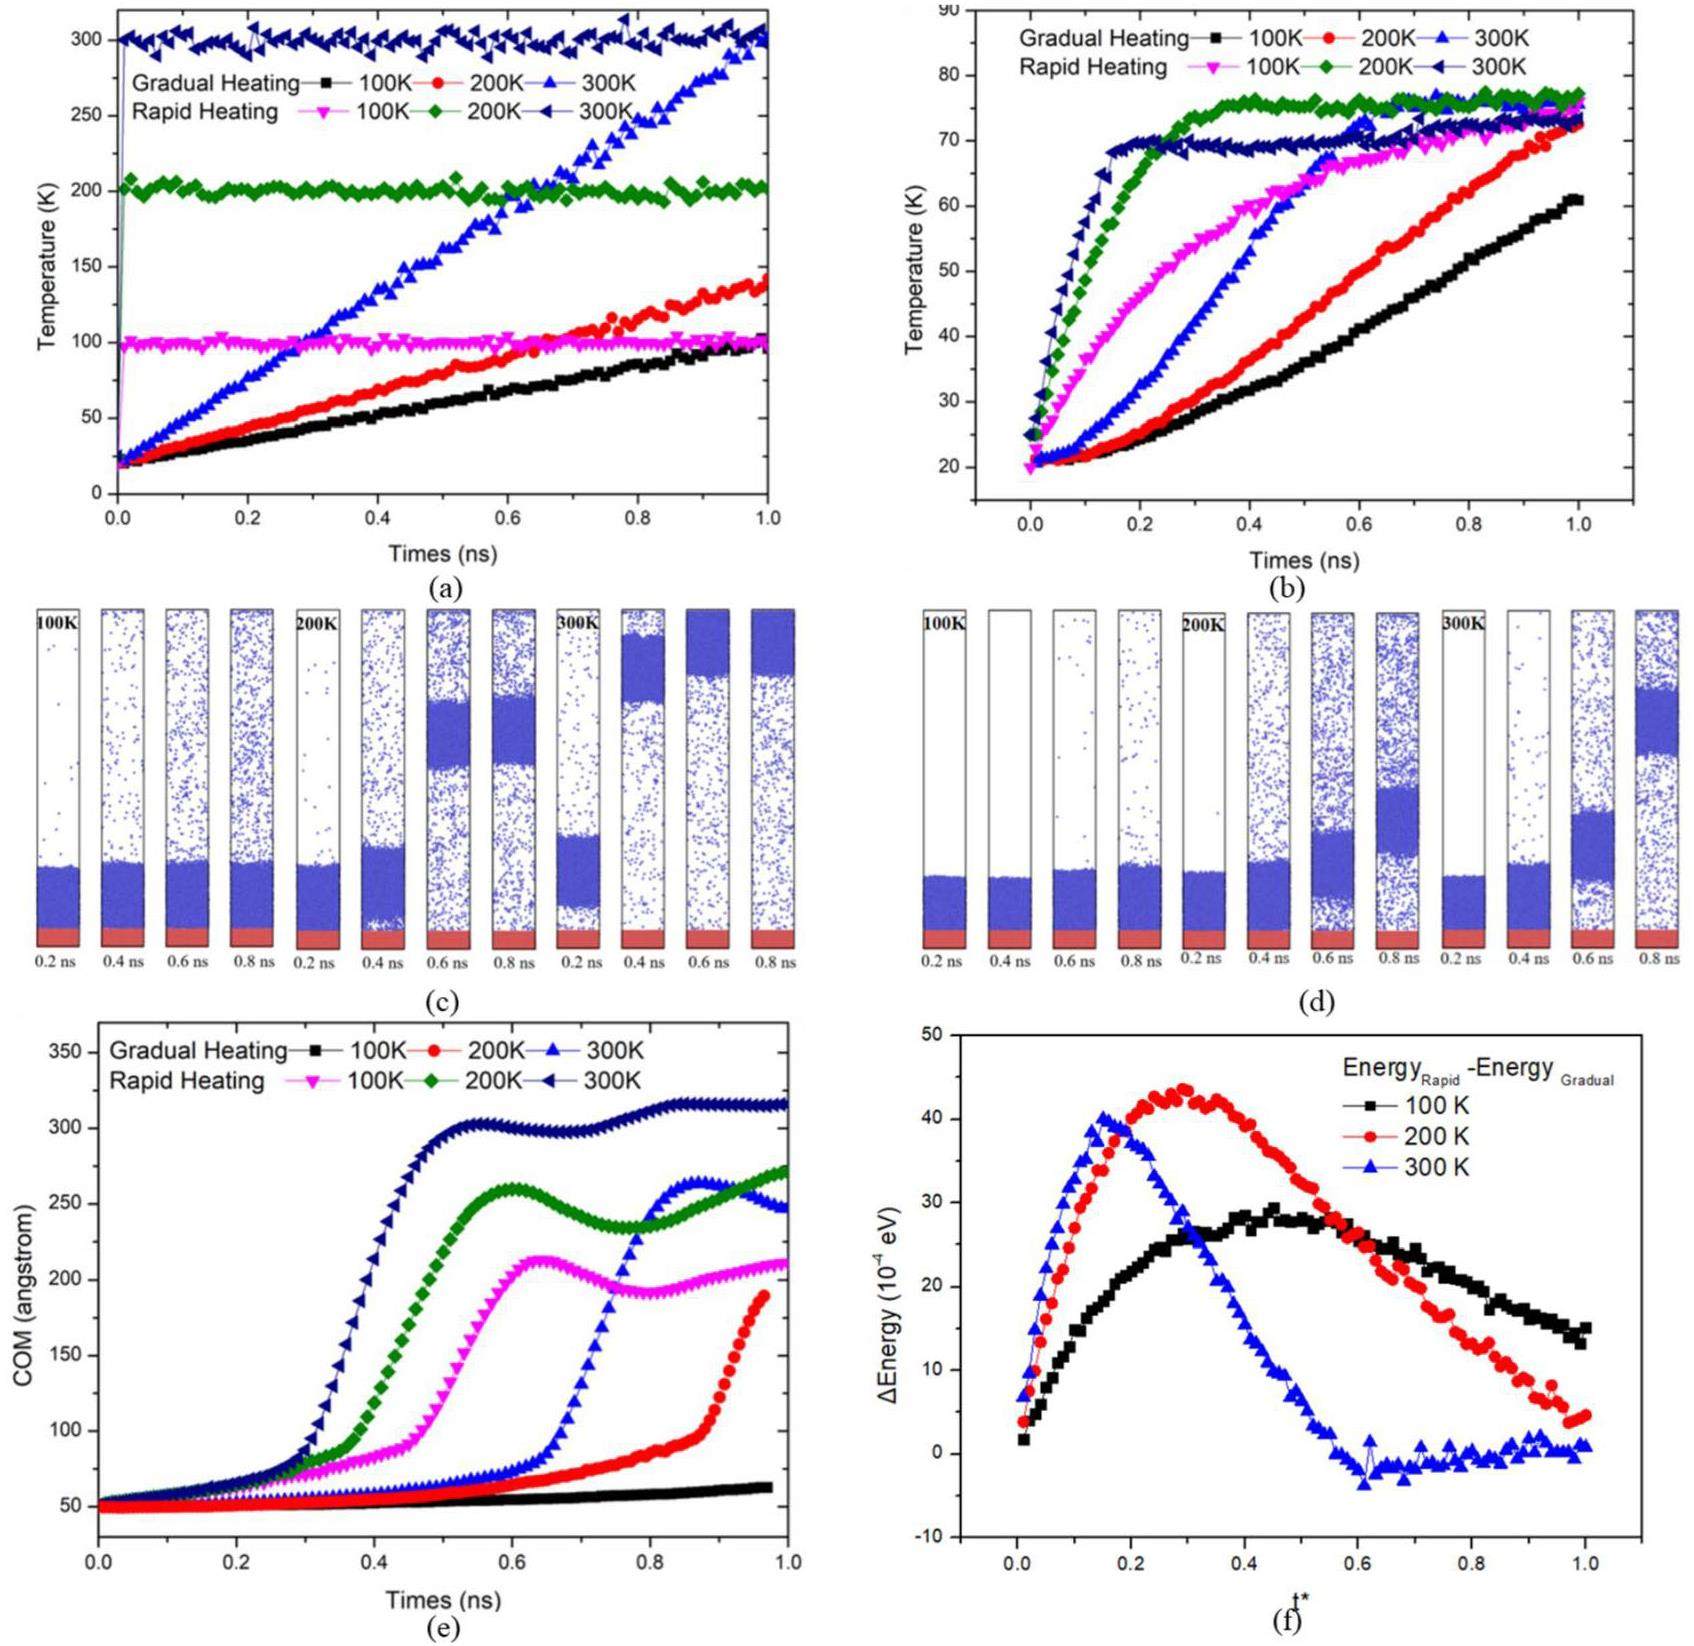
Figures 6(c) and (d) illustrate snapshots of the system corresponding to different heating methods. Figure 6(e) shows the changes in the height of the center of mass over time under various conditions. As observed, under rapid heating, the center of mass of the liquid film with a final heating temperature of 300 K increases the fastest due to its higher heating rate. This allows it to reach the nucleation energy threshold earlier, initiating nucleation sooner. The liquid film with a final temperature of 200 K experienced a slightly later rise in the center of mass compared to the 300 K condition, with a slower upward movement. The liquid film with a final temperature of 100 K showed the latest increase in the center of mass and the slowest upward movement.
In the case of gradual heating, nucleation occurred first at a final heating temperature of 300 K, with the center of mass rising at t = 0.65 ns. For the 200 K case, nucleation occurred at t = 1.2 ns. However, at 100 K, despite the continuous increase in temperature, the nucleation energy required for nucleation was not reached, and nucleation did not occur. As a result, only a small amount of liquid hydrogen evaporated, and the center of mass remained almost unchanged.
To better observe the variations in the wall and liquid film temperatures under the same conditions, Fig. 6 illustrates the relationship between the wall temperature and liquid film temperature changes under the two heating methods. In Fig. 7(a), it can be observed that during the initial heating phase, all the wall surfaces quickly reached their final temperatures, and the liquid film temperature began to increase. The heating rate of the wall with a final temperature of 200 K was slightly lower than that of the wall with a final temperature of 300 K, which also resulted in a somewhat lower heating rate for the liquid film. The wall with a final temperature of 100 K exhibited the slowest heating rate, and nucleation occurred the latest. The maximum energy differences for the three different temperatures occurred at 0.44 ns, 0.29 ns, and 0.16 ns, respectively. As the temperature increases, it becomes clear that the times at which the 200 K and 300 K conditions reach their equilibrium temperature in the rapid heating mode are 0.65 ns and 0.85 ns earlier than for the 100 K condition. Figure 7(b) shows the gradual heating scenario. The trend of the wall temperature changes mirrors the trend of the liquid film temperature changes: the liquid film on the wall with the highest final temperature of 300 K exhibited the fastest heating rate, followed by the films on walls with final temperatures of 200 K and 100 K. For the liquid film on the wall, the higher the final heating temperature of the wall, the faster the heating rate of the liquid film. Among liquid films on walls with different final heating temperatures, the temperature difference was greatest at t = 0.6 ns, but over time, the temperatures of all liquid films ultimately converged.
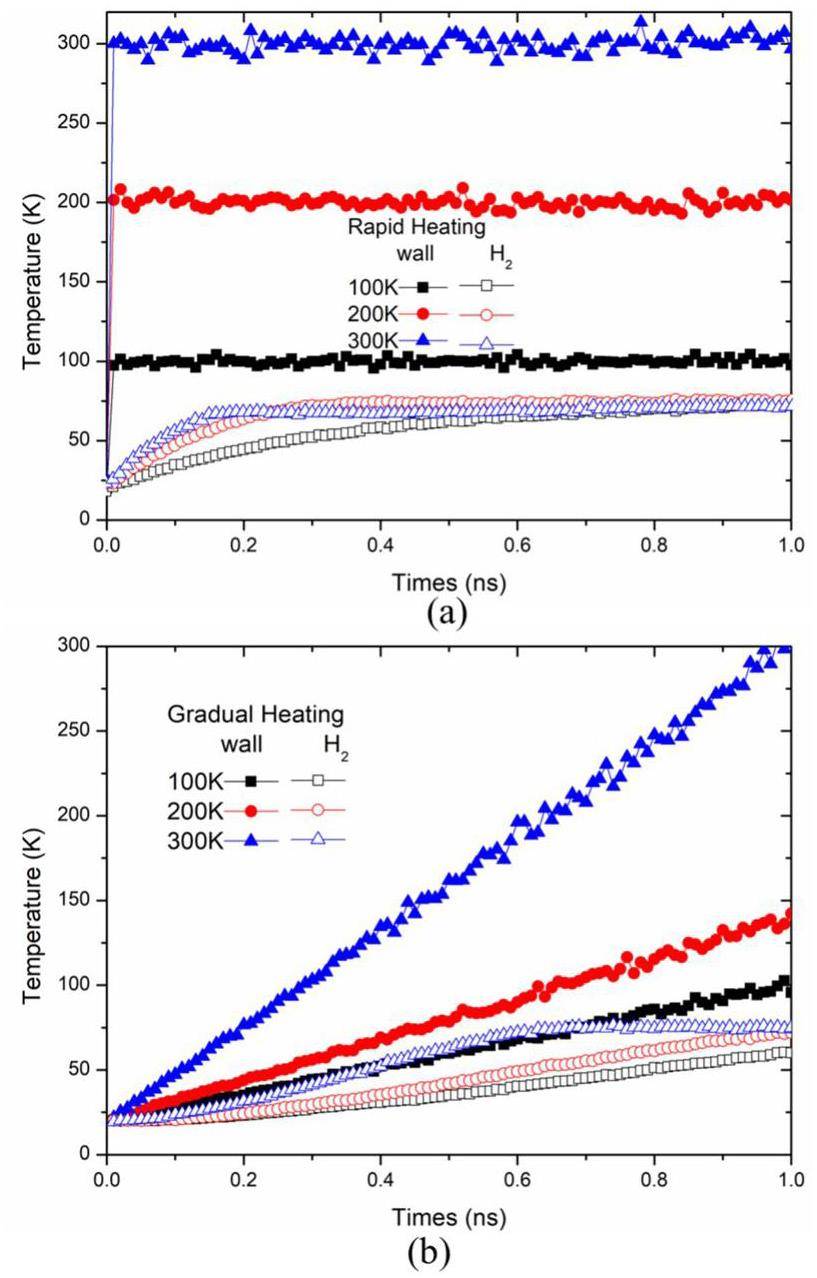
Figure 8 illustrates the variations in surface heat flux under the rapid and gradual heating methods. The heat flux q is calculated as follows:
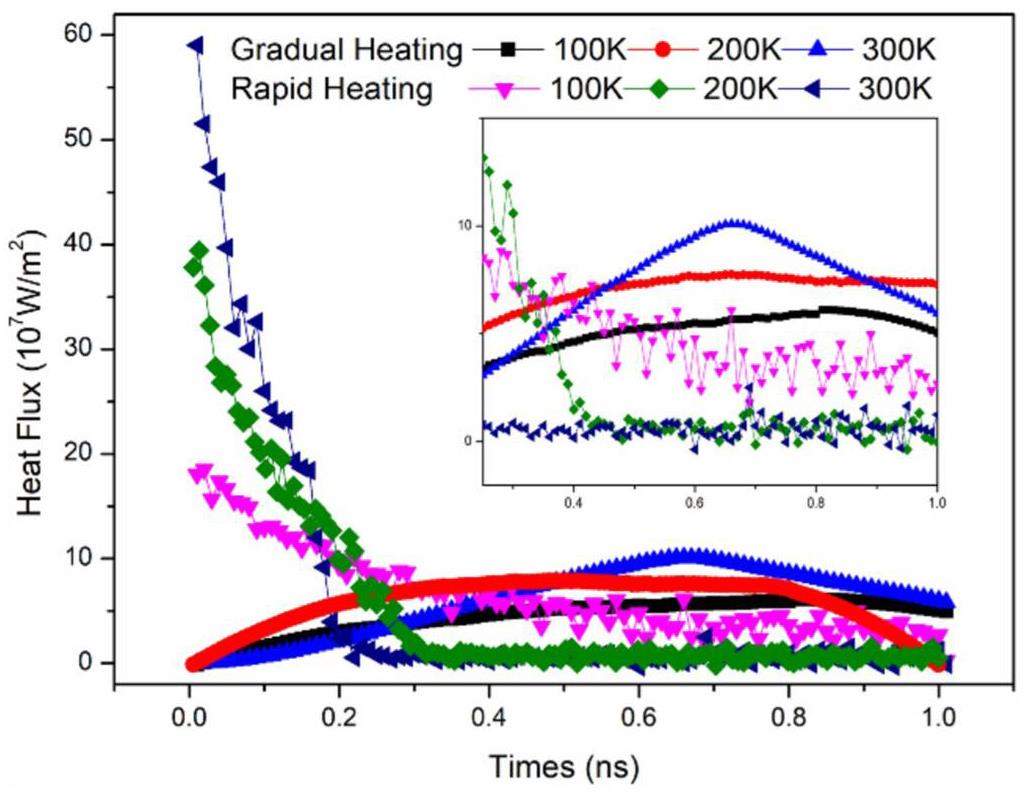
During rapid heating, higher initial wall temperatures were associated with larger initial heat flux values. At t = 0 ns, the heat flux was highest for the wall with a final temperature of 300 K, followed by the wall at 200 K, and then the wall at 100 K. However, as heating progressed and the liquid film temperature increased, the heat flux transmitted through the wall began to decrease. The heat flux for the wall with a final temperature of 300 K showed the fastest decline, reaching near-zero levels around t = 0.2 ns, when the liquid film fully separated from the wall. The rate of decrease in heat flux for the wall with a final temperature of 200 K was slightly slower, with the flux approaching near-zero levels around t = 0.4 ns and remaining stable thereafter. The wall with a final temperature of 100 K exhibited the slowest rate of decrease in heat flux.
The decrease in heat flux during rapid heating occurs because, after the heating begins, the height of the liquid film increases, and no particles remain on the wall surface. As a result, the wall relies on air convection for heat transfer, significantly reducing heating efficiency and causing the heat flux to decline. During gradual heating, the heat flux initially peaks and then decreases. This is because, during the early heating phase, the temperature of the liquid film increases along with the wall temperature. However, once the center of mass of the liquid film begins to rise, air pockets form between the liquid film and the wall, reducing heat transfer efficiency and leading to a decline in the heat flux. The heat flux for the wall with a final temperature of 300 K peaks at t = 0.7 ns before beginning to decline. Although the peak values of the heat flux for walls with final temperatures of 200 K and 100 K are less distinct, the overall trend is similar, with an initial increase followed by a decrease.
Figure 9 illustrates the variations in the surface heat transfer coefficient (HTC) and Kapitza resistance(R) under slow and rapid heating conditions. The heat transfer coefficient K is defined as follows:
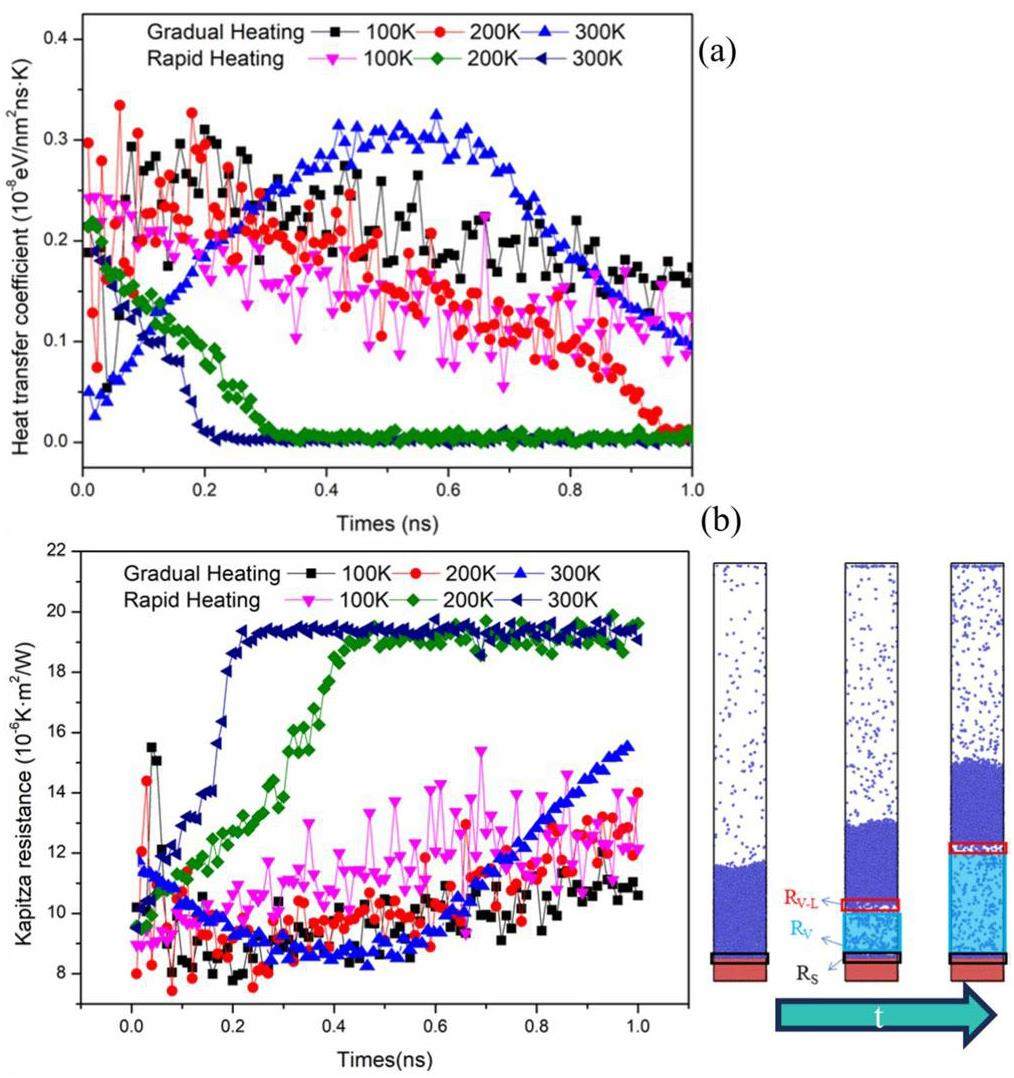
In the rapid-heating scenario shown in Fig. 7, the heat flux peaks initially and then decreases over time, while the temperature difference between the solid and liquid films is greatest at the beginning and gradually decreases thereafter. Consequently, in Fig. 8(a), the heat transfer coefficients under rapid-heating conditions decrease from their initial peak values over time. For both the 300 K and 200 K cases, the heat flux densities decreased to zero, resulting in a final heat transfer coefficient of zero. The heat transfer coefficient for the wall with a final temperature of 100 K also decreased over time, but did not reach zero.
Under gradual heating conditions, the heat transfer coefficients for walls with final temperatures of 100 and 200 K reached their peak values at t = 0.2 ns before decreasing. The heat transfer coefficient for the wall with a final temperature of 300 K reached its peak at t = 0.6 ns before beginning to decrease. In the same nucleation process, variations in thermal resistance can explain changes in the heat transfer coefficient (HTC). As depicted in Fig. 8(b), thermal resistance is categorized into solid-liquid thermal resistance (Rs), vapor thermal resistance (Rv), and vapor-liquid thermal resistance (Rvl). Rapid heating methods at 200 K and 300 K accelerate nucleation, leading to a continuous increase in air thermal resistance, which hinders heat transfer and causes the heat transfer coefficient to approach zero. In contrast, in slower nucleation scenarios, the rate of increase in thermal resistance is comparatively slower.
Effect of different surface wettability on nucleation
Vaporization and nucleation occur on the surface and require a certain amount of energy for completion [27-30].
According to the formula above, surface wettability affects the nucleation energy needed for different nucleation events. The magnitude of the parameter ε reflects the strength of the interactions between particles, which indirectly indicates the hydrophilicity or hydrophobicity of the surface. A higher εα value signifies increased surface hydrophilicity, while a lower value indicates greater hydrophobicity. In this study, variations in energy parameters were employed to simulate surfaces with different wetting properties. Five distinct conditions were considered, corresponding to α values of 0.1, 0.5, 1, 3, and 5.
As shown in Fig. 10, after a certain period of surface heating, the liquid films on surfaces with varying wetting properties exhibited nearly identical rates of temperature increase. The height of their centroids remained almost unchanged during this period.
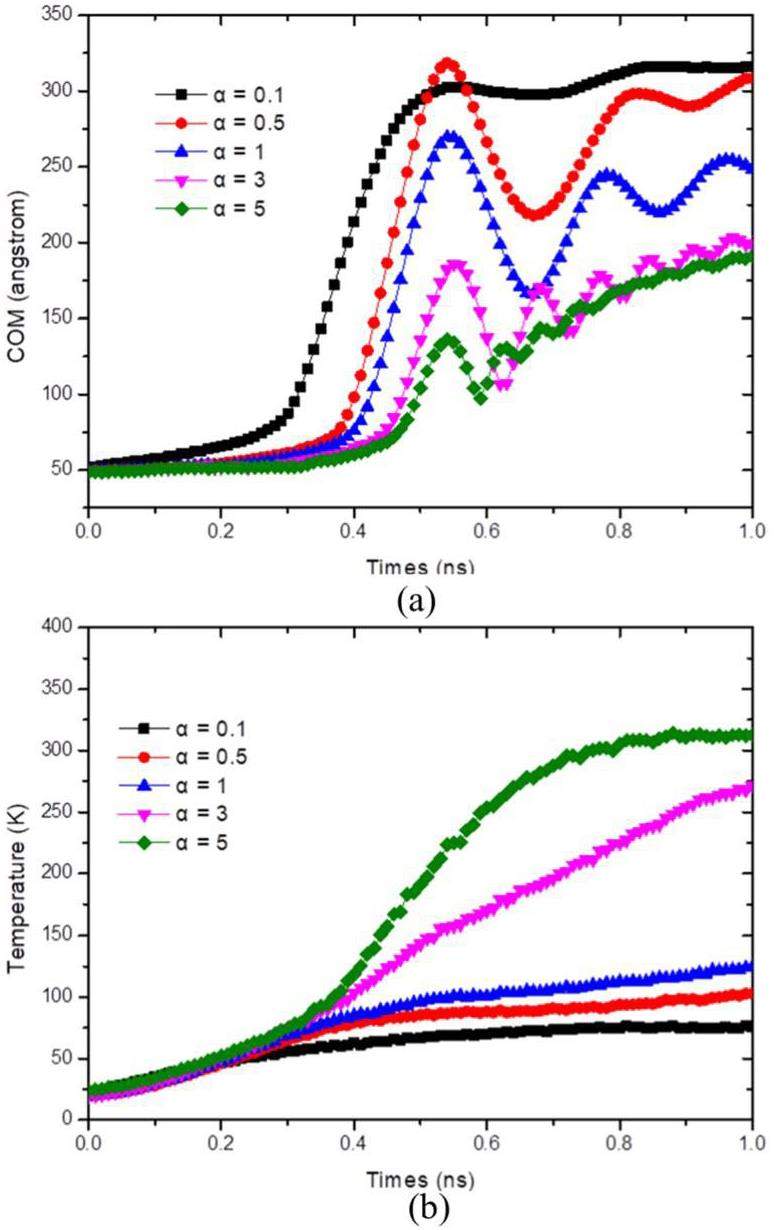
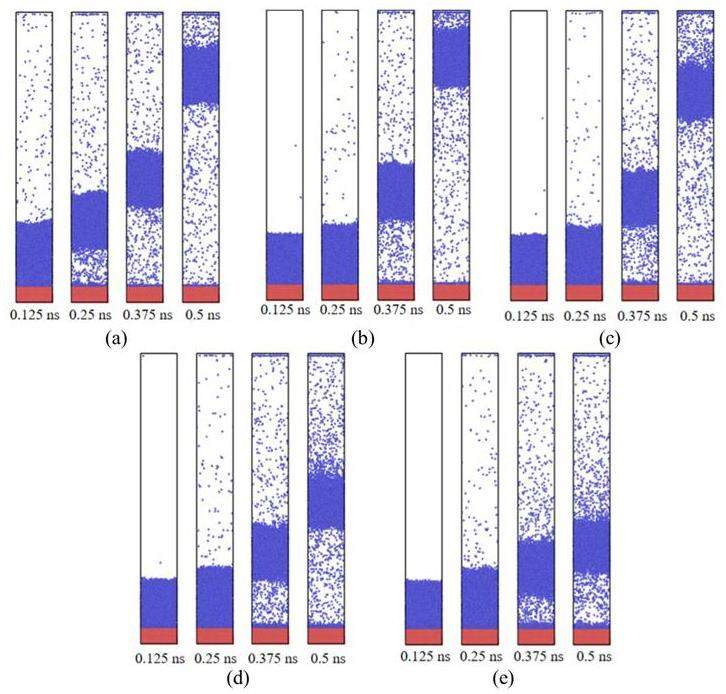
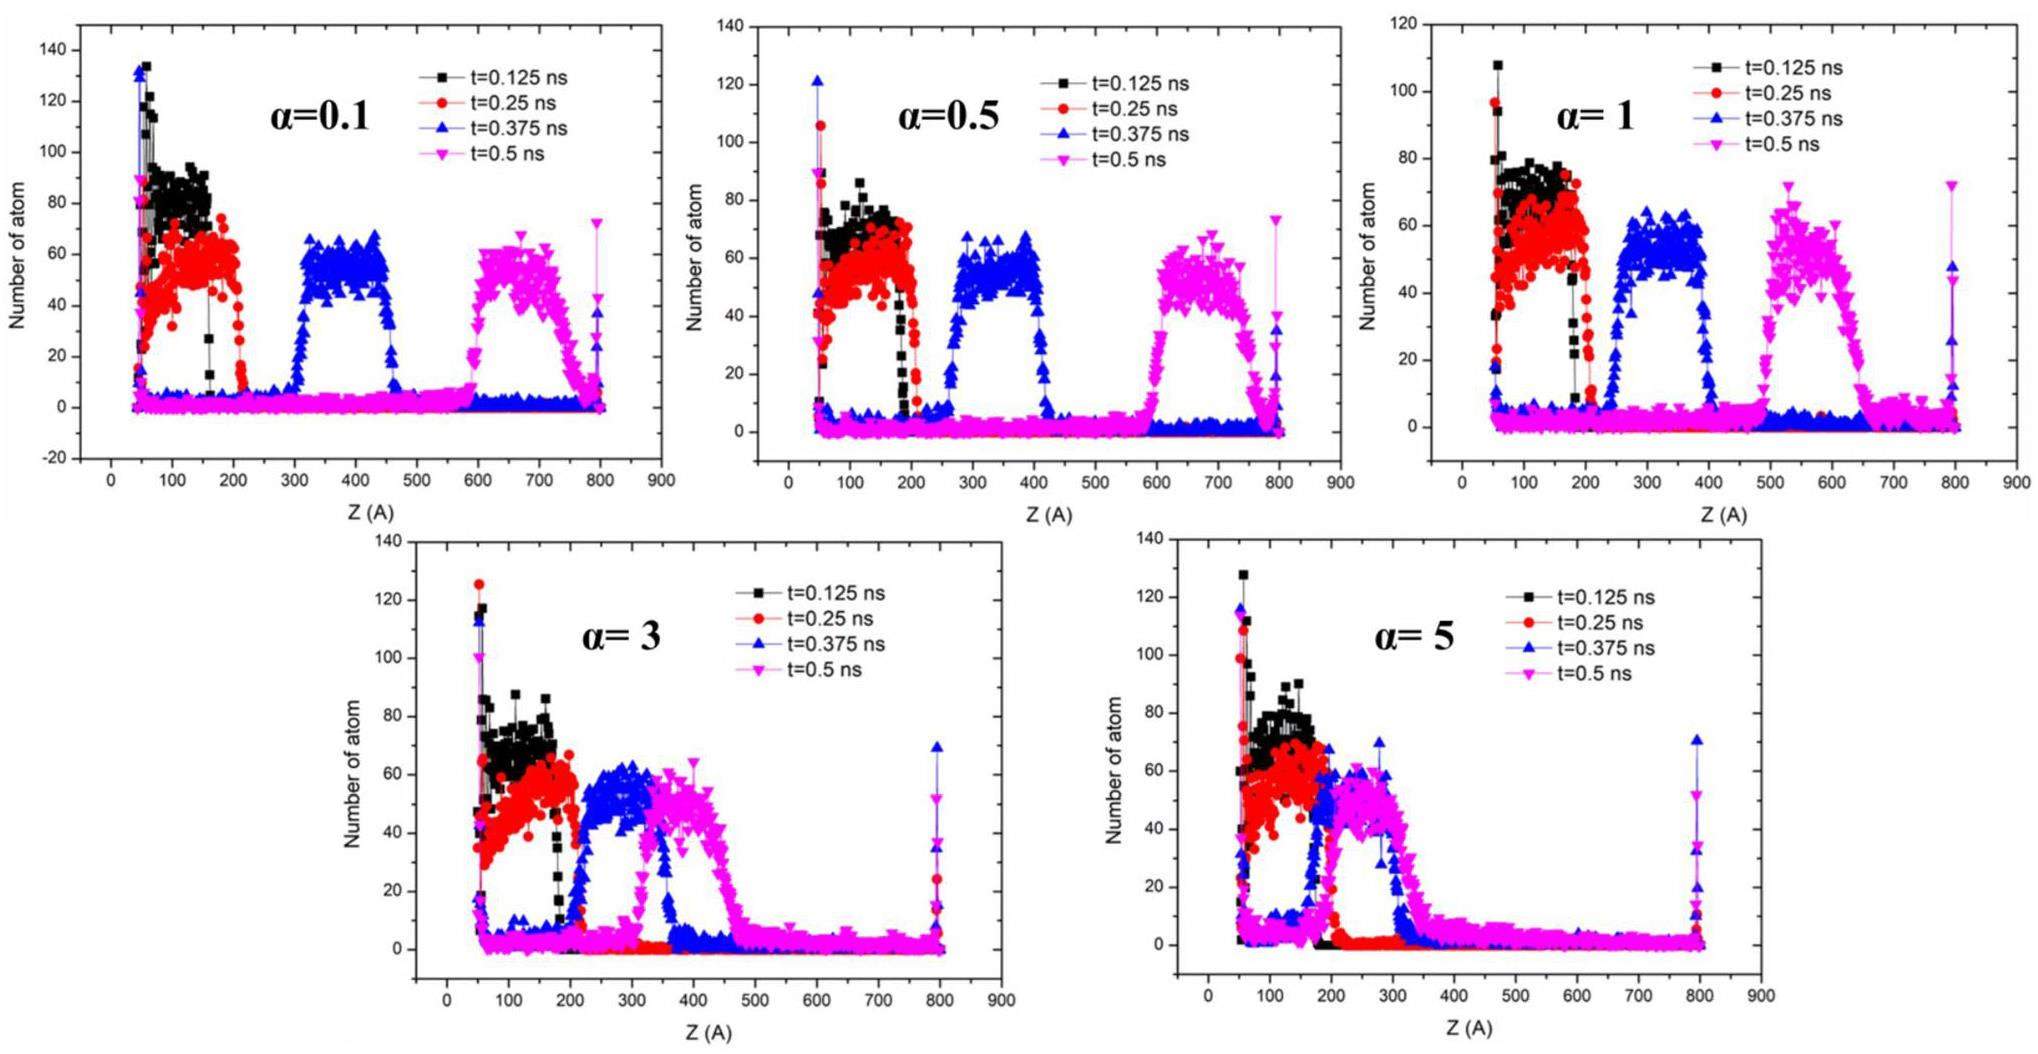
From Fig. 11 and Fig. 12, it can be observed that the mobility of liquid films nucleating on surfaces with different wettabilities varies over time. The surface with a wetting coefficient of α=0.1 exhibits the fastest upward movement of the film, followed by surfaces with α=0.5, and α=1. The surface with α=3 shows a significantly slower upward movement, and the surface with α=5 demonstrates the slowest upward movement. Furthermore, after nucleation occurs, it is observed that as α increases, the interaction forces between particles become stronger, leading to a gradual increase in the number of particles remaining at the bottom.
According to the nucleation formula, larger contact angles require lower nucleation energy. Consequently, the surface with α = 0.1 reaches the required energy for nucleation first, causing the centroid to move upward and a subsequent decrease in the temperature increase rate of the liquid film. Surfaces with α = 0.5 and α = 1 undergo nucleation successively, leading to a decrease in the temperature increase rate after the centroid rises. However, for the surface with α = 3, the temperature increase rate did not decrease after nucleation, and for α = 5, it continued to increase even after nucleation.
Thus, it is evident that as the value of α increases, indicating higher surface hydrophilicity, nucleation occurs later under the same conditions, and the temperature of the liquid film increases more slowly. Conversely, when α decreases, the centroid of the liquid film moves faster and reaches a greater height in the model.
Conclusion
The vaporization-nucleation process of liquid hydrogen during surface heating was investigated using molecular dynamics simulations. The effects of various factors on this process were also explored. The key findings are summarized as follows:
1. The thickness of the liquid film influences the molecular dynamics calculations. Thinner films (1.5 nm and 3 nm) result in the evaporation of most particles after heating, hindering the preservation of the gaseous film state and inadequately capturing the bubble growth process.
2. Different heating methods impact the boiling heat transfer process. The liquid film temperature obtained using the rapid heating method was higher than that obtained with the uniform heating method. Within 1 ns, the temperature increased by 25.6%, 6.9%, and 0.6% at 100, 200, and 300 K, respectively. The higher the initial temperature, the smaller is the change in the final liquid film temperature owing to variations in the heating method.
3. Increasing the solid–liquid interaction strength (α) under constant heating conditions reduces the rate of temperature increase in the liquid film and delays nucleation. Nucleation times for α values of 0.1 to 5 are 0.2 ns, 0.33 ns, 0.36 ns, 0.4 ns, and 0.43 ns, respectively, indicating delayed nucleation with higher α. Final temperatures of 73.9 K, 102.6 K, 124.8 K, 270.1 K, and 313.9 K correspond to temperature increases of 38%, 21.6%, 116.1%, and 16.3%, respectively. Hydrophilic surfaces exhibit greater temperature increases than hydrophobic surfaces.
Simulation of hydrogen distribution and effect of Engineering Safety Features (ESFs) on its mitigation in a WWER-1000 containment
. Nucl. Sci. Tech. 30, 97 (2019).https://doi.org/10.1007/s41365-019-0624-0Passive electrochemical hydrogen recombiner for hydrogen safety systems: prospects
. Nucl. Sci. Tech. 34(6) 89 (2023). https://doi.org/10.1007/s41365-023-01245-9Safety study on HIC-containing waste resin with respect to hydrogen release
. Nucl. Sci. Tech. 30, 57 (2019). https://doi.org/10.1007/s41365-019-0583-5Development of CONTHAC-3D and hydrogen distribution analysis of HPR1000
. Nucl. Sci. Tech. 35, 25 (2024). https://doi.org/10.1007/s41365-024-01382-9Integrated hydrogen production options based on renewable and nuclear energy sources
. Renew. Sustain. Energ. Rev. 16, 6059-6082 (2012). https://doi.org/10.1016/j.rser.2012.06.008Nuclear heat for hydrogen production: Coupling a very high/high temperature reactor to a hydrogen production plant
. Prog. Nucl. Energ. 51, 500-525 (2009). https://doi.org/10.1016/j.pnucene.2008.11.001Boiling heat transfer from a horizontal flat plate in a pool of liquid hydrogen
. Cryogenics 50, 410-416 (2010). https://doi.org/10.1016/j.cryogenics.2010.04.001Numerical investigation on subcooled pool film boiling of liquid hydrogen in different gravities
. Inter. J. Hydrog. Energ. 46, 2646-2657 (2021). https://doi.org/10.1016/j.ijhydene.2020.10.079Numerical analysis of the influence of wall vibration on heat transfer with liquid hydrogen boiling flow in a horizontal tube
. Int. J. Hydrog. Energy 42(52) 30804-30812 (2017). https://doi.org/10.1016/j.ijhydene.2017.10.149Molecular rotation-caused autocorrelation behaviors of thermal noise in water
. Nucl. Sci. Tech. 31, 53 (2020). https://doi.org/10.1007/s41365-024-01382-9Influence of element substitutions on poisoning behavior of ZrV2 alloy: theoretical and experimental investigations
. Nucl. Sci. Tech. 34, 113 (2023). https://doi.org/10.1007/s41365-023-01259-3Adsorption and desorption of hydrogen on/from single-vacancy and double-vacancy graphenes
. Nuclear Science and Techniques, 30, 69 (2019). https://doi.org/10.1007/s41365-019-0584-4Molecular dynamic simulation of high-quality hydrogen storage in pillared bilayer graphene bubble structure
. Comput. Theo. Chem. 1068, 97-103 (2015). https://doi.org/10.1016/j.comptc.2015.06.030Hydrogen storage in sH binary hydrate: Insights from molecular dynamics simulation
. Intern. J. Hydrog. Energ. 46(29), 15748-15760 (2021). https://doi.org/10.1016/j.ijhydene.2021.02.112The feasibility of hydrogen storage in aquifers: A molecular dynamics simulation
. Fuel 367,Molecular dynamic simulation of high-quality hydrogen storage in pillared bilayer graphene bubble structure
. Comput. Theoret. Chem. 1068, 97-103 (2015). https://doi.org/10.1016/j.comptc.2015.06.030Molecular dynamics simulations of compressed liquid hydrogen
. J. Quant. Spec. Rad. Trans. 58, 743-755 (1997). https://doi.org/10.1016/j.comptc.2015.06.030Molecular dynamics simulation of wetting and evaporation characteristics for sessile nanofluid nanodroplets
. Chem. Phys. Lett. 695, 112-118 (2018). https://doi.org/10.1016/j.cplett.2018.02.001Molecular dynamics study about the effects of random surface roughness on nanoscale boiling process
. Intern. J. Heat Mass Transf. 145,Estimation of Lennard-Jones (6, 12) pair potential parameters from gas solubility data
. J. Chem. Phys. 55, 4012-4017 (1971). https://doi.org/10.1063/1.1676694Regulation of rapid boiling of nanofluids on the hybrid wall: A molecular dynamics simulation
. Intern. J. Heat Mass Transf. 183,Energy functions for peptides and proteins
. I. Derivation of a consistent force field including the hydrogen bond from amide crystals. J. American Chem. Soc. 96(17), 5319-5327 (1974). https://doi.org/10.1021/ja00824a004Wetting and evaporation of argon nanodroplets on smooth and rough substrates: Molecular dynamics simulations
. Chem. Phys. Lett. 662, 73-79 (2016). https://doi.org/10.1016/j.cplett.2016.04.090Origin of line tension for a Lennard-Jones nanodroplet
. Phys. Fluids 23, 232-239 (2011). https://doi.org/10.1063/1.3546008Modification of the classical nucleation theory based on molecular simulation data for surface tension, critical nucleus size, and nucleation rate
. Phys. Rev. E 78,Surface free energy of a solid from contact angle hysteresis
. Adv. Colloid Inter. Sci. 103, 149-172 (2003). https://doi.org/10.1016/S0001-8686(02)00093-3Boiling nucleation
. Adv. Heat Trans. 10, 85-166 (1974). https://doi.org/10.1016/S0065-2717(08)70110-2Bubble nucleation in liquids
. AIChE J. 21(5) (1975) 833-848. https://doi.org/10.1002/aic.690210502The authors declare that they have no competing interests.


