Introduction
Accurate particle identification (PID) in nuclear reaction experiments spanning intermediate to relativistic energies remains a significant challenge in radioactive ion beam facilities. The complexity of this task has been further exacerbated by the rapid expansion of detector systems, where even state-of-the-art artificial intelligence algorithms exhibit limitations in reliably distinguishing reaction products for fundamental identification tasks [1]. As a series of PID detector systems for light particles (such as p, d, t, etc.), the Compact Spectrometer for Heavy IoN Experiments (CSHINE) system has been constructed to explore the equation of state of nuclear matter near and below the saturation density in the Fermi energy regime [2, 3], which has been installed at the final focal plane of the first Radioactive Ion Beam Line in Lanzhou (RIBLL-I) [4, 5].
The layout of the newly developed CSHINE-III, as illustrated in Fig. 1, integrates three specialized subsystems for comprehensive particle identification: silicon strip detector telescopes (SSDTs) for light-charged particles (LCPs), large area parallel plate avalanche counters (PPACs) for fission fragment (FF) detection, and a CsI(Tl)-based gamma array. SSDTs demonstrate exceptional performance in terms of energy and position resolution, enabling the precise identification of LCPs [6, 7]. This capability has facilitated the discovery of the “ping-pong” emission modality through the isobaric yield ratios of the A = 3 nuclei coincident with heavy fragments, and provides critical information on the effects of nuclear symmetry energy on hydrogen emission patterns via the correlation function of the Z = 1 isotopes [8-10]. Three large-area PPACs, each with an active detection area of 240 mm × 280 mm, were used for FF measurements and coincidence analysis with LCPs [11]. These measurements have revealed the characteristic features of fast fission processes in heavy-ion reactions, particularly the formation and evolution of low-density, neutron-rich neck structures, which offer valuable constraints on the nuclear symmetry energy compared to transport model simulations [12-14]. The gamma detection system comprises 15 CsI(Tl) crystals (70 mm×70 mm×250 mm each), providing crucial information on the high-momentum tail of nucleon distributions and the nuclear symmetry energy at supra-saturation densities [15, 16]. This integrated detector configuration enables the simultaneous measurement of multiple reaction channels, significantly enhancing the capability of the system to probe nuclear matter properties.
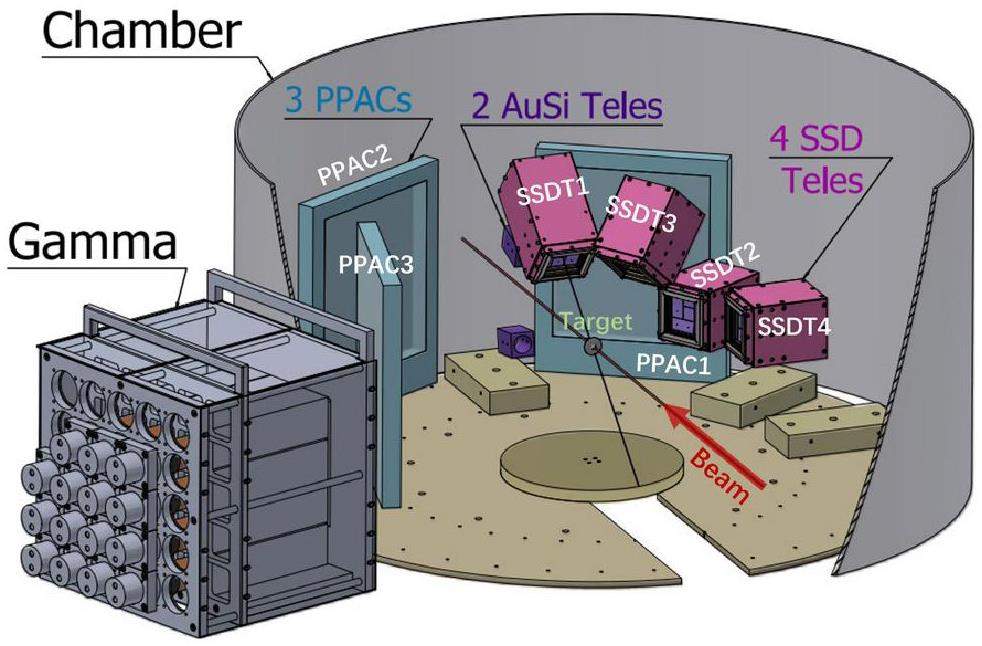
In the experimental setup, signals generated by incident particles in the detector system are processed through dedicated electronics before being recorded event-by-event by the data acquisition (DAQ) system. Before detailed physical analysis, raw binary data must undergo calibration and reconstruction to accurately represent physical events and transform them into meaningful observables that include multiplicity, particle type, energy, momentum, velocity, and incident angle. The silicon strip telescope, which serves as the core detector in the CSHINE spectrometer, consists of a single-sided silicon strip detector (SSSSD) coupled with a double-sided silicon strip detector (DSSSD), backed by a 3 × 3 CsI(Tl) crystal matrix. The SSDs belong to the BB7 series and feature active areas measuring 63.8 mm × 63.8 mm. Each SSD surface is equipped with 32 strips with a width of 2 mm. Table 1 lists the experimental geometries and thickness parameters for the four SSDTs. This SSD-SSD-CsI configuration enables particle identification over a broad energy range through ΔE-E correlations between the DSSSD-CsI and SSSSD-DSSSD components. Additional technical details are provided in Ref. [2, 7].
| SSDT no | 1 | 2 | 3 | 4 |
|---|---|---|---|---|
| L (mm) | 215.5 | 275.5 | 195.5 | 275.5 |
| θlab (°) | 40 | 60 | 70 | 90 |
| ϕlab (°) | 90 | 0 | 50 | 0 |
| SSSSD (μm) | 305 | 104 | 70 | 71 |
| DSSSD (μm) | 1008 | 1010 | 526 | 535 |
| CsI(Tl) (mm) | 50 | 50 | 50 | 50 |
Data processing for SSDTs is significantly complex due to the calibration requirements of numerous independent silicon strip detector channels. Accurate physical analysis requires careful consideration of several factors, including detector dead-layer effects, non-uniformity in thin silicon layers, multi-hit events, charge-sharing phenomena, and nonlinear responses of light-charged particles in CsI(Tl) detectors. Building on the previous two rounds of experimental silicon strip data processing methods, an advanced ROOT-based framework was developed to process data from the CSHINE-SSDTs. This framework was successfully implemented in the analysis of LCPs measured in the 25 MeV/u 86Kr + 124Sn experiment conducted at the RIBLL-I station of the Heavy Ion Research Facility in Lanzhou, China, establishing a valuable reference methodology for similar telescope detector systems.
The remainder of this paper is organized as follows. Section 2 describes the architecture of the data analysis framework and its processing workflow. Section 3 presents the analysis methodology and the corresponding results. The performance of CSHINE-SSDTs is discussed in Sect. 4. Finally, a summary is provided in Sect. 5.
Data analysis framework
Figure 2 describes the data processing task for silicon strip detector telescopes, in which three primary stages are involved: (1) data format conversion, (2) quality check, detector calibration, and (3) track reconstruction. The CSHINE-III DAQ and trigger signal processing are described in Ref. [3]. The data processing task starts with the raw data in binary form, which is decoded based on electronic module channels and stored in the ROOT TTree object (TreeData). The second step is to optimize the calibration of each detector, for which mapping between the electronic and corresponding detector logic channels is essential. These two foundational steps are integrated into the DAQ framework.
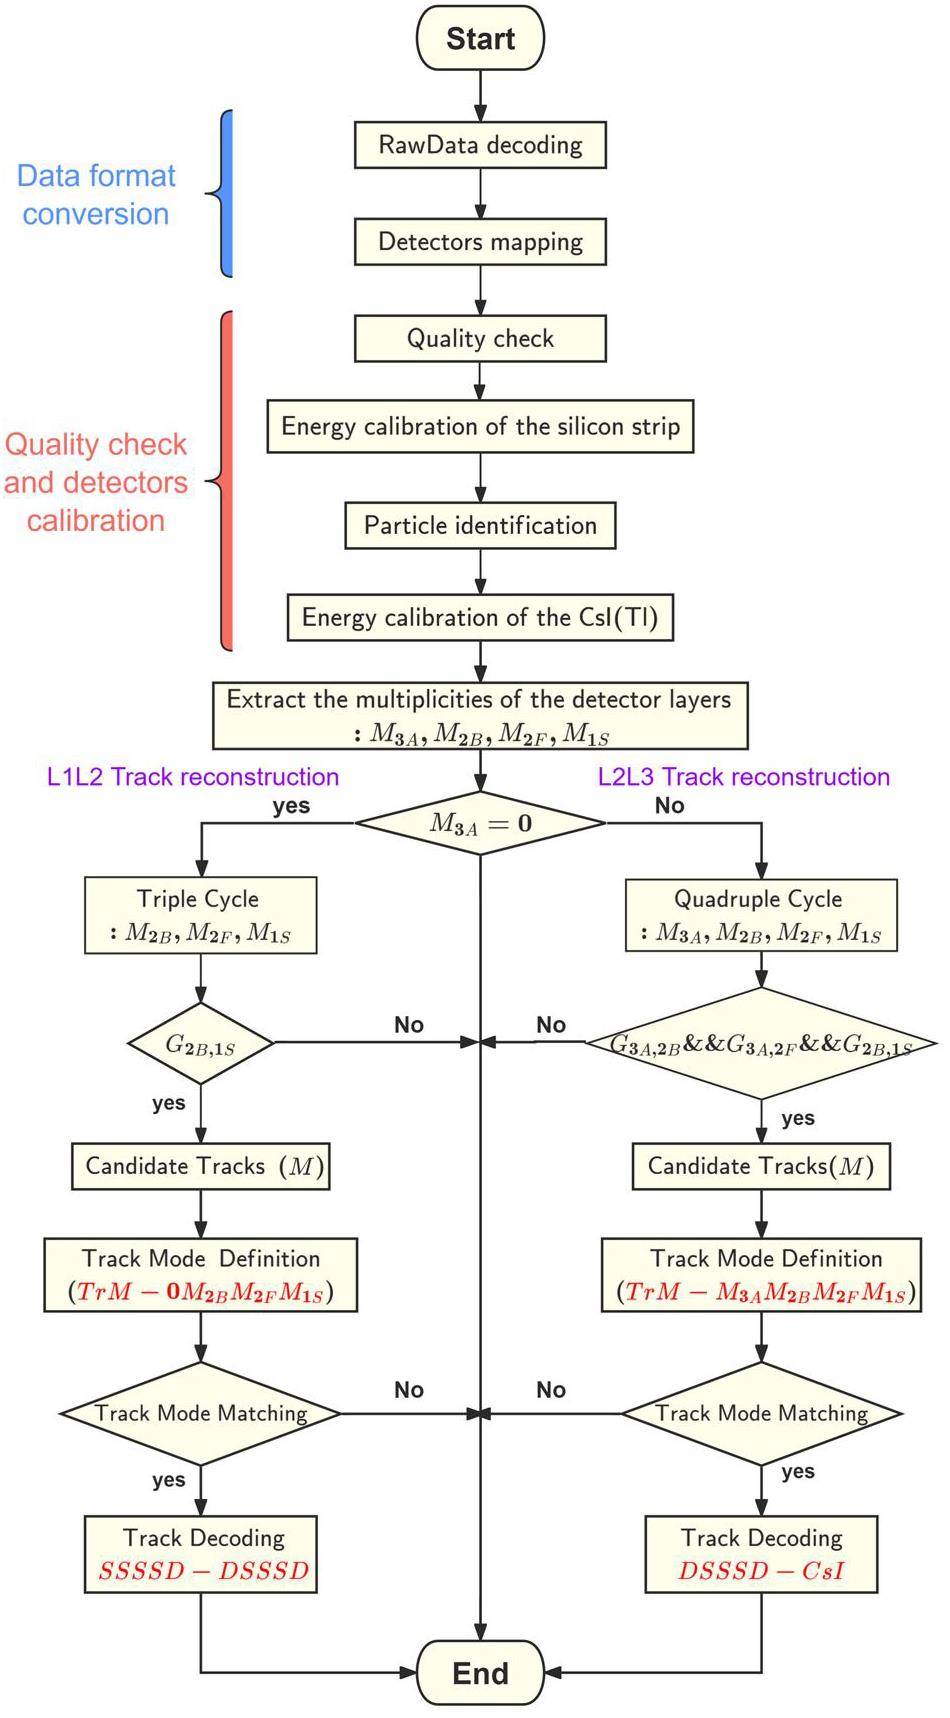
A preliminary quality-check analysis of the raw detector data is required before performing the calibration analysis. This process involves the generation of a one-dimensional spectrum for each detector channel. By analyzing and observing these individual channel spectra, the functionality of each detector channel can be preliminarily assessed to ensure data accuracy and enhance the efficiency of data analysis. Silicon detectors exhibit a linear energy response to charged particles and energy deposition is independent of particle type, particularly for light particles [17]. A combined calibration method utilizing a precise pulse generator and α-particle sources was employed. CsI(Tl) scintillators were used as residual energy detectors because of their relatively high stopping power, geometric shape flexibility, minimal radiation damage, cost-effectiveness and good resolution [18]. However, the light output of a scintillator is non-linear and is influenced by both the energy deposited in the crystal and the atomic and mass numbers of the incident ions. Therefore, mass and charge identification must be performed prior to energy calibration. By combining the nominal thickness of the DSSSD provided by the manufacturer and the measured ΔE2 (MeV), the total residual energy E (MeV) in CsI(Tl) can be calculated for all tracks using the LISE++ toolkit [19]. This calculation process allowed the establishment of a relationship between the ADC channel number and the energy deposition (MeV) in CsI(Tl).
The configuration of the CSHINE SSDT from top to bottom comprises four layers containing hit information: the SSSSD (“1S”), the DSSSD with front (“2F”) and back (“2B”) side strips, and the 3 × 3 CsI(Tl) hodoscope (“3A”). When only a single particle strikes the telescope and is deposited in the hodoscope, the multiplicity of each layer is equal to one, and such events are straightforward to identify. Nevertheless, in the case of simultaneous incidence of multiple particles, the task of discerning all actual tracks becomes more complicated owing to charge-sharing and multi-hit effects. For each event, the multiplicities of all detector layers, M3A, M2B, M2F, and M1S, were extracted. These multiplicities correspond to the number of channels in each layer, where the signal amplitude exceeds a predetermined threshold empirically set above the pedestal for each individual channel. Based on whether the events had particles stopping in the CsI(Tl) hodoscope, the track reconstruction was divided into two categories: L1L2 (SSSSD-DSSSD) and L2L3 (DSSSD-CsI).
As recently reported in Refs. [6] and [20], the geometric and temporal constraints can be utilized to define the spatial alignment of the tracks and to match the hit times of the detectors. This approach helps eliminate spurious tracks and determine the number of candidate tracks (M). However, despite recording time information on both sides of the DSSSD strips in our experiment, the high time threshold set for the back-DSSSD resulted in substantial data loss when the time signals of the corresponding front- and back- DSSSD were consistent. Consequently, instead of using time constraints, we relied solely on geometric constraints to determine the candidate tracks. Track modes were defined on the basis of the number of candidate tracks and hit multiplicities in the telescope layers. In L2L3 track reconstruction, the track modes are denoted as “
The silicon strip telescope requires an efficient data processing architecture as the core detector system of the CSHINE spectrometer. To satisfy this requirement, we implemented a modular computational structure in which each distinct processing step was encapsulated within an individual C++ class. These specialized classes were integrated into a comprehensive and unified analysis framework [21]. The functional characteristics of the principal C++ classes within this framework are systematically presented in Table 2.
| Class name | Main function |
|---|---|
| CSHINEQualityCheck | Quality inspection of experimental data |
| CSHINEPedestals | Extract the pedestal in the energy spectrum |
| CSHINEPulserCali | Silicon strip pulse scale |
| CSHINEAlphaCali | Silicon strip α energy fitting |
| CSHINESiEnergyCali | Energy calibration of the silicon strip |
| CSHINECsIEnergyCali | Energy calibration of the CsI(Tl) |
| CSHINETrackReconstruction | Track Reconstruction |
| CSHINESiPixelGeometry | Coordinate system transformation |
| CSHINEEvent | Physical event definition |
| CSHINEUnCaliDataToPhysicsEvent | Generate final physical data from raw data |
Analysis approach and results
Detector calibration
Energy calibration of the silicon strip detectors
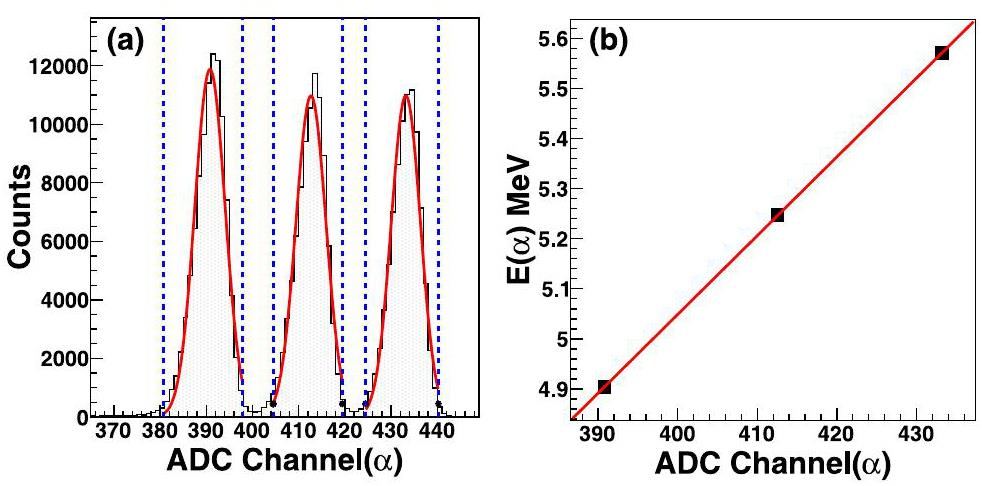
Strip-by-strip energy calibration is required for SSDs because of their fabrication limitations and the nonuniformity of the associated electronics. Due to the linear energy response of SSDs, the combination of the α source and pulser calibration method was used. Each telescope was equipped with an aluminum Mylar foil entrance window (2.0 μm Mylar + 0.06 μm Al) to protect the detector and provide electromagnetic shielding. For source calibration, a three-component α source comprising 239Pu, 241Am and 244Cm with energies of 5.147, 5.480, and 5.795 MeV, respectively, was used. The energy deposited in the silicon strip detector was corrected according to LISE++ calculations, resulting in calibrated values of 4.904 MeV for 239Pu, 5.248 MeV for 241Am, and 5.571 MeV for 244Cm. An interactive program was developed to fit the peak of the ADC channel (α) and to determine its relationship with E(α), as shown in Fig. 3.
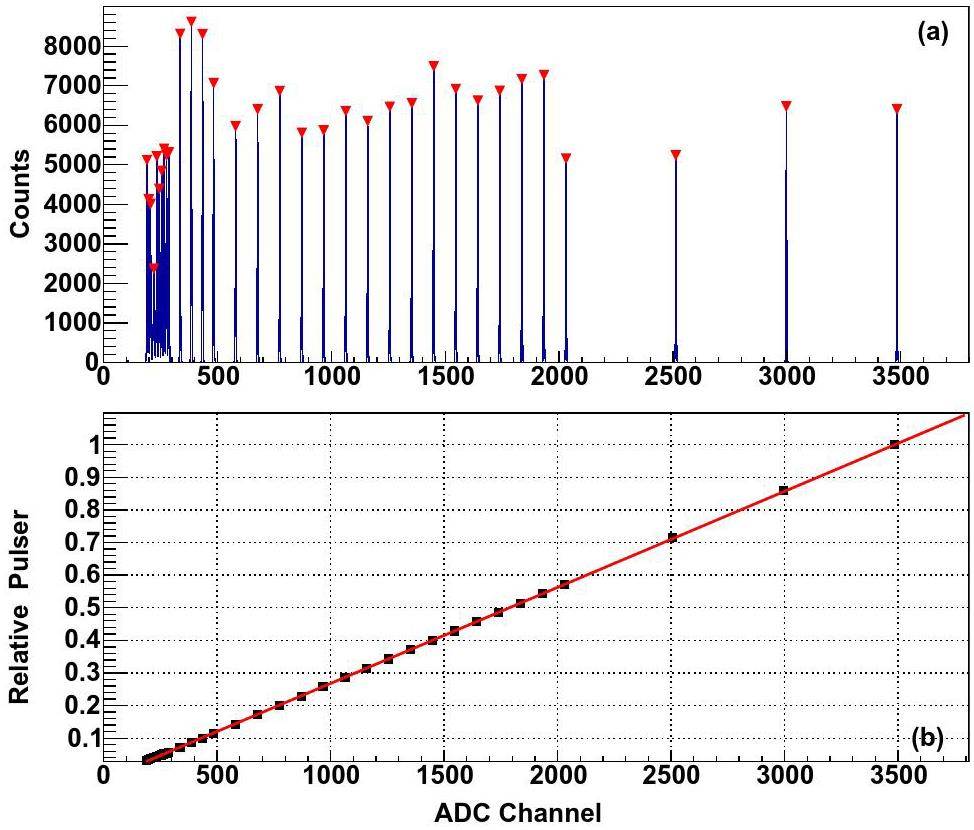
Pulser calibration was used to ascertain the response characteristics of the electronics. An automatic peak-finding program was developed to obtain peak values, as shown in Fig. 4(a). Linear fitting [Eq. (1)] of the standardized pulse amplitudes (V) and the ADC channel (Ch) was carried out, as shown in 5(b).
Particle identification
Particle identification is not only essential to calibrate the CsI(Tl) energy response to different types of incident particles, but also plays a crucial role for hits matching in the track reconstruction process. In the scatter plot ΔE - E, particles with different charges and masses tend to gather in different bands. Typically, PID is performed through graphical cuts around each band. Despite its versatility and ability to accommodate diverse scenarios, this approach suffers from two major limitations. First, in regions characterized by low particle statistics, it fails to extrapolate reliable identification, as there is insufficient data to establish clear cut boundaries. Second, manual contouring of each particle deposited in every Si-CsI(Tl) detection cell is a time-consuming and tedious process. As the number of detection cells increases, the time-consuming problem becomes more pronounced [22]. To address the aforementioned issues, Tassan-Got and Gawlikowicz et al. [23, 24] proposed a novel identification function based on the Bethe–Bloch formula [23, 24]. This function enables accurate modeling of the data and safe extrapolations in data-sparse regions by fitting the ridge lines of each isotope using 14 parameters, as shown in Eq. (3).
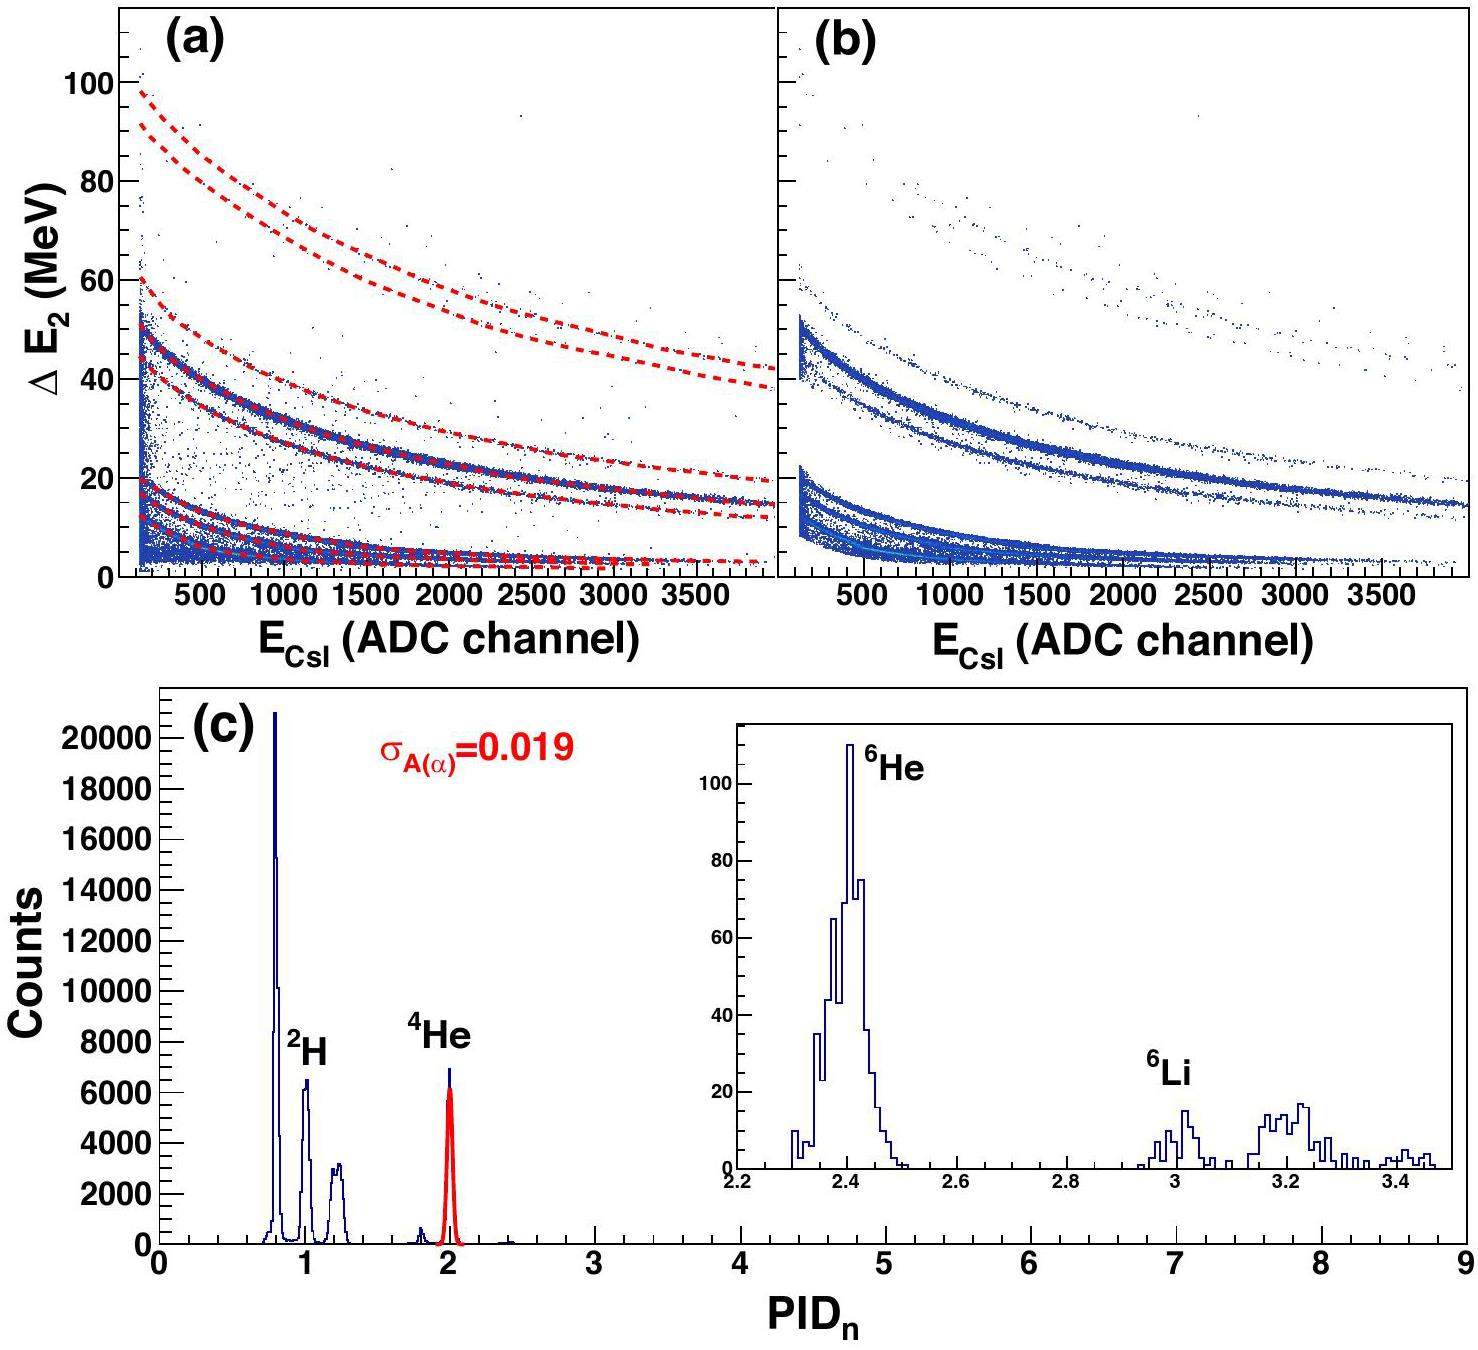
Figure 5(a) displays the ΔE-E scattering distribution for one hit events, in which the energy loss ΔE is from the front strips of the DSSSD transmission detector (layer 2) and the energy E is deposited in one CsI(Tl) unit of SSDT1. The sampling points on the isotopes' ridge curves were manually selected and indicated by the red dotted lines. The best fit was achieved with an individual set of parameters constrained by the simultaneous fitting of all visible isotopes. The mass and charge of each particle with given values of ΔE and E can be extracted by inverting the multiparametric identification function. When the extracted mass was not zero, the events were shown in Fig. 5(b). As defined in Ref. [23], the particle identification variable PIDn is calculated as
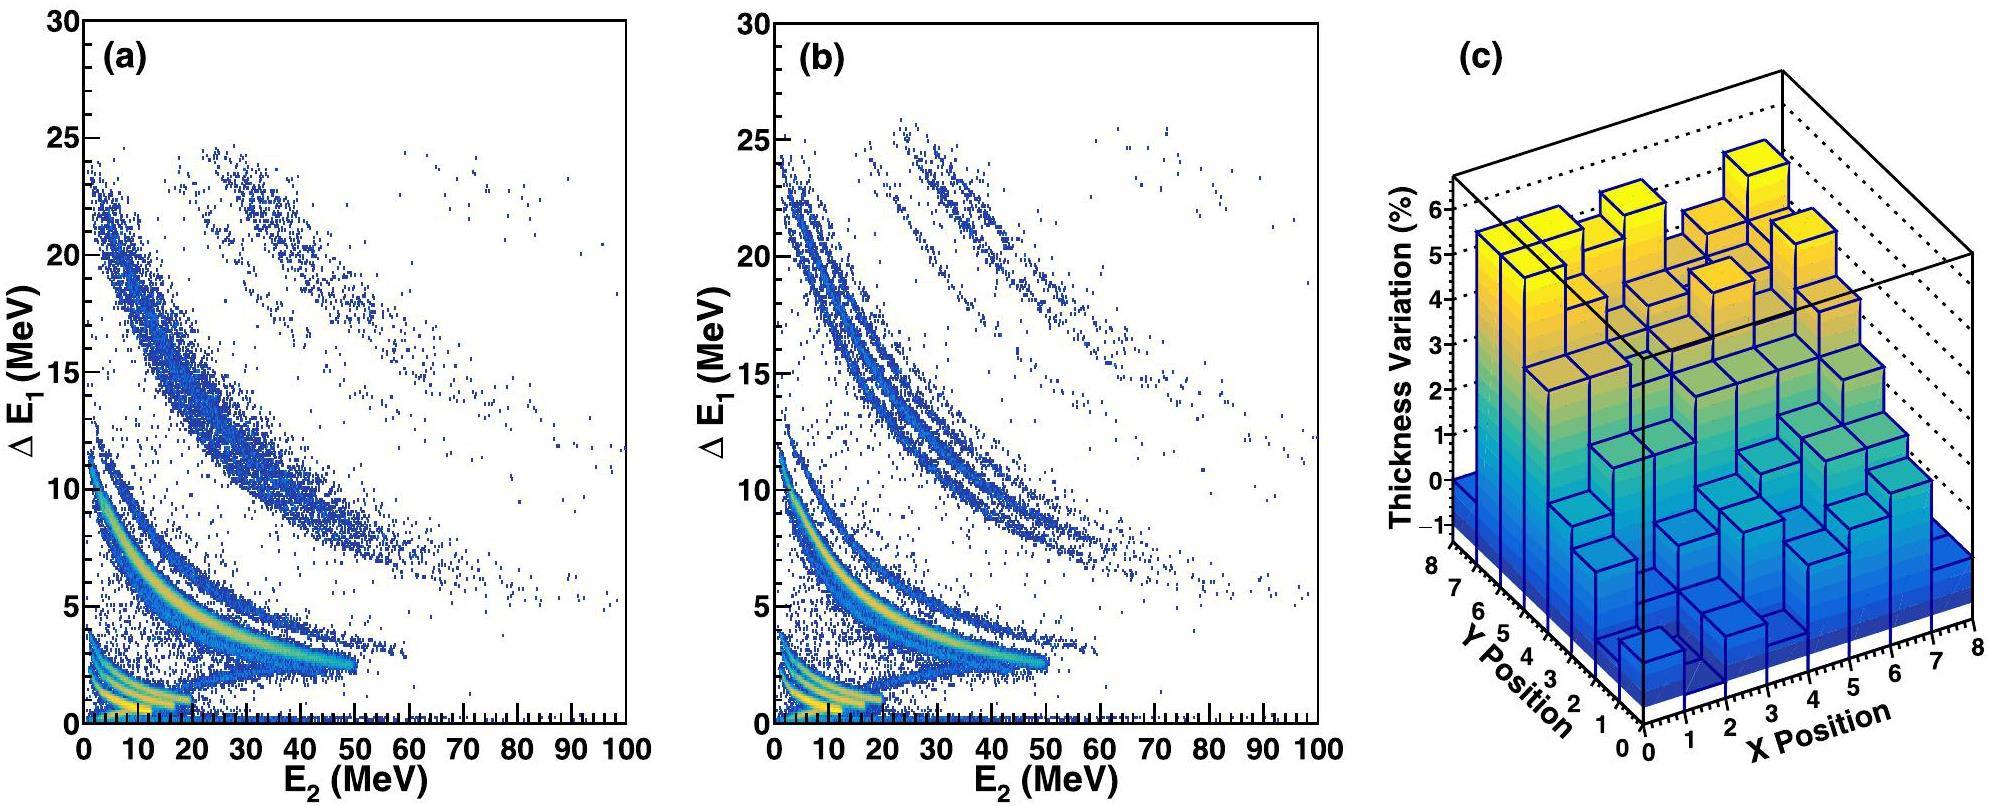
The correction of non-uniformity in the thickness of thin SSDs is of crucial importance for PID. Before correction, the isotopic resolution of the SSSSD-DSSSD component in SSDT2 was comparatively poor, as shown in Fig. 6(a). This is due to the random energy deposition when the particles pass through the detector at different positions with varying path lengths. For thickness correction, the sensitive area was divided into 8 × 8 bins. In each bin, we plotted the ΔE1-E2 histogram individually and selected a specific bin showing clear PID bands as a reference. Subsequently, for the remaining bins, the thickness correction factor η for the SSSSD was adjusted from -0.05 to 0.10 with a step size of 0.005 and the energy loss ΔE1 in the SSSSD was corrected to ΔE1(1+η). For each value η, a two-dimensional histogram was generated and compared with the reference histogram. Subsequently, the thickness correction for each bin was determined according to the value η, which provided the best consistency with the reference histogram. Figure 6(b) shows the two-dimensional graph after thickness correction for the 104 μm SSSSD, demonstrating a significant improvement in identification resolution compared to the graph before correction in Fig. 6(a). Figure 6(c) illustrates the “relative thickness variation” for the 104 μm SSSSD, ranging from -1% to 7.5%. This approach offers a relative correction for the thickness of a thin ΔE detector with respect to the reference bin. The absolute thickness correction relies on in-beam tests, as described in Refs. [25, 26].
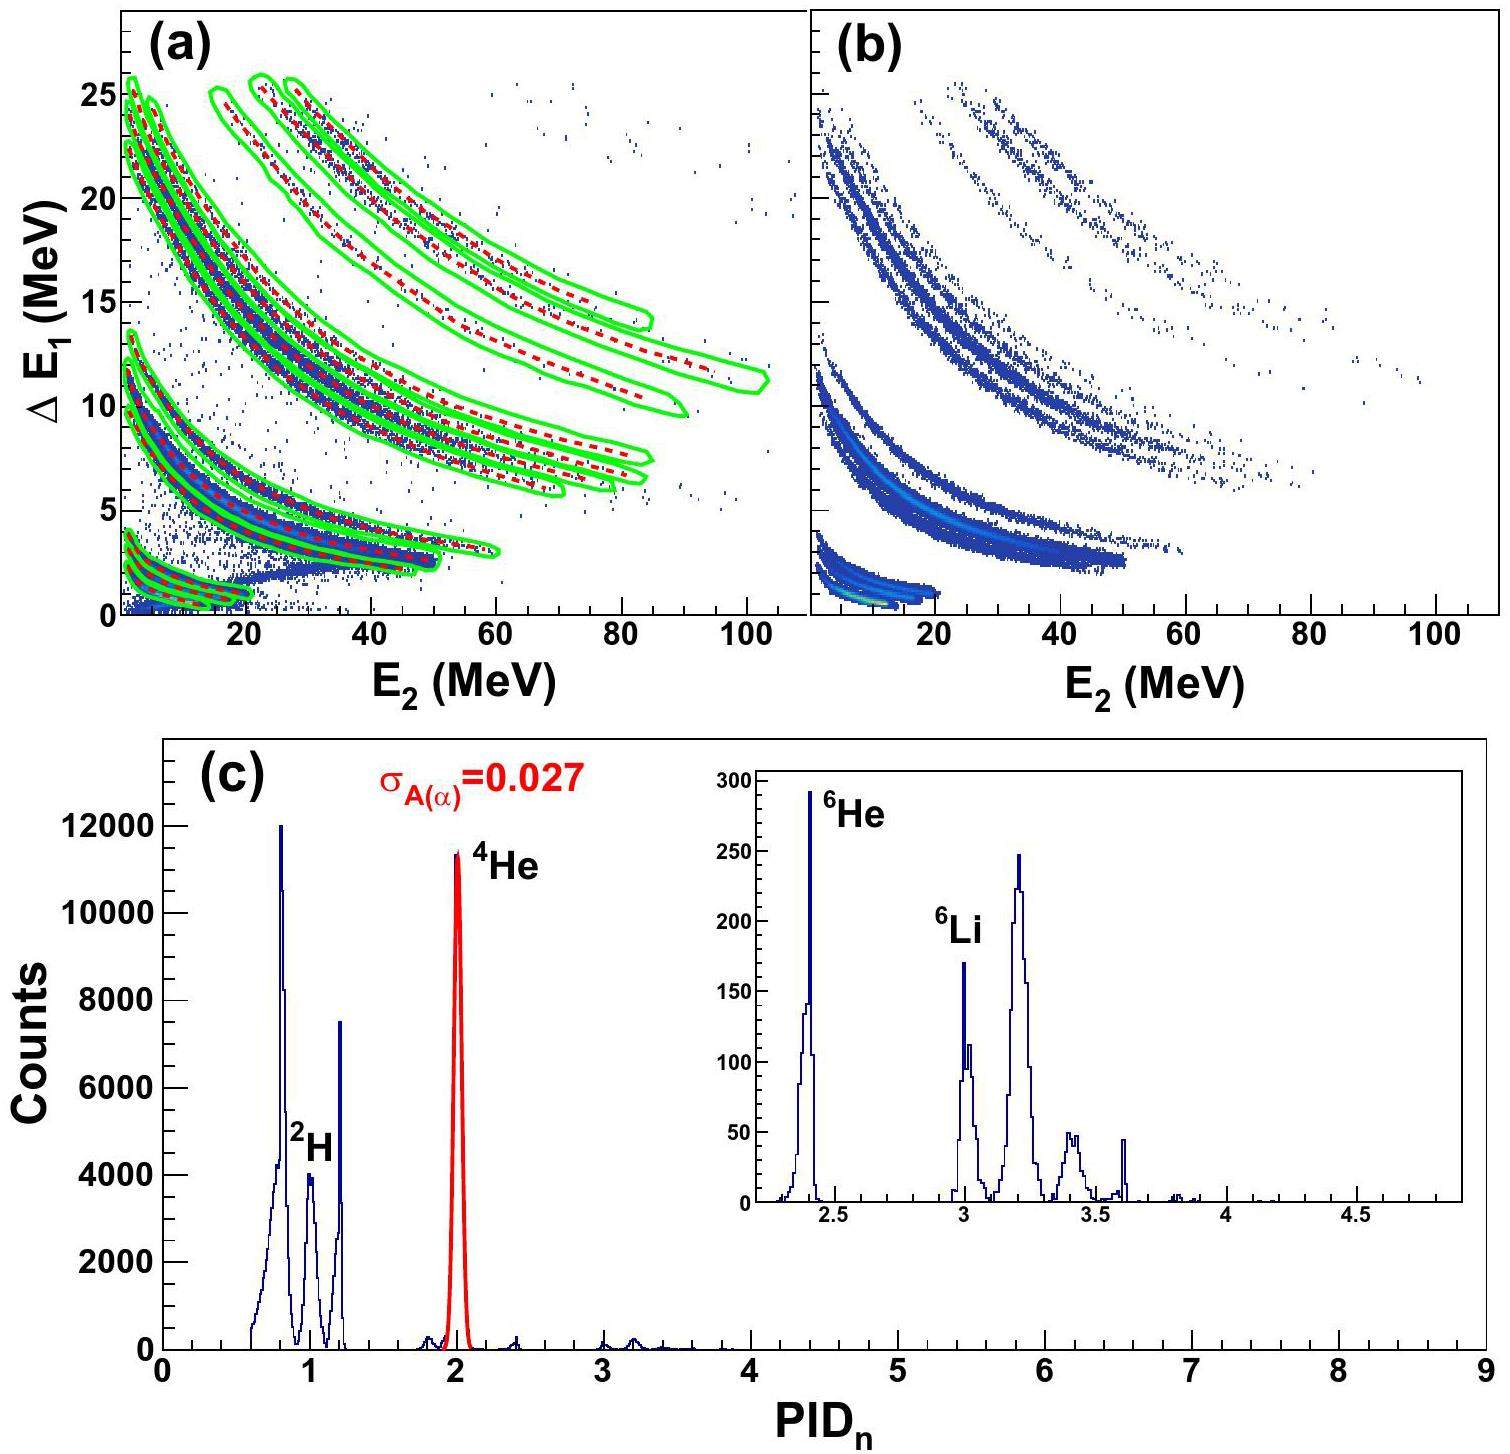
After thickness correction of the SSSSD, each isotope can be effectively separated. Due to the impact of punching through on the scattering plot ΔE1-E2, the traditional method was used instead of the multiparametric formula. In Fig. 7(a), the distinct particles are identified by the green inclusive contour. Additionally, the center of each isotope ridge was fitted by a polynomial,
| Relative mass resolution | ||
|---|---|---|
| Detector | SSSSD-DSSSD | DSSSD-CsI |
| SSDT1 | 0.019 | 0.021 |
| SSDT2 | 0.026 | 0.016 |
| SSDT3 | 0.034 | 0.024 |
| SSDT4 | 0.024 | 0.022 |
Energy calibration of the CsI(Tl) crystals
Leveraging the high-quality calibrations of the DSSSD and the multiparametric formula obtained in the PID, the energy loss method can be utilized to perform the energy calibration on the CsI(Tl) crystal. Based on the two-dimensional plot for
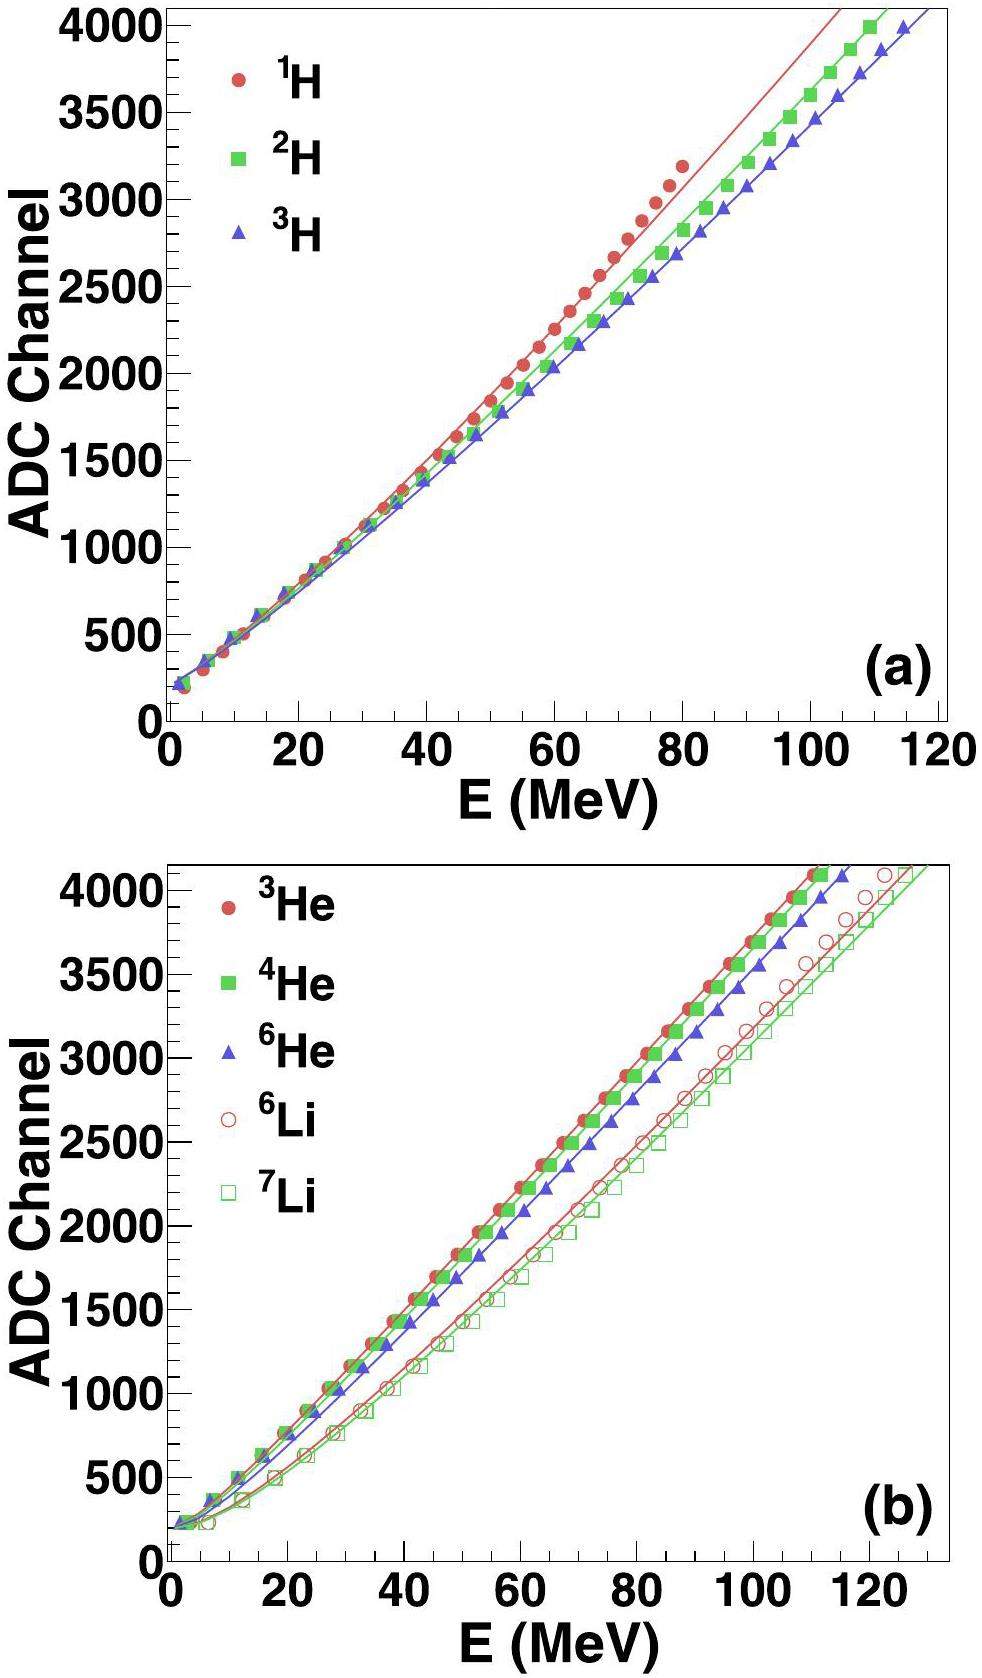
Figure 8 shows the results of the energy calibration of the CsI(Tl) crystals for each isotope. The CsI(Tl) energy response for the incident particle exhibited insignificant nonlinearity and a slight difference between the isotopes in the energy range of 0 to 100 MeV, in accordance with the results in Ref. [28]. Two separate formulas were used to describe the calibration process. For Z = 1 isotopes, the calibration function was written as [28]
Track reconstruction
Constraints analysis
The geometric relationships between different layers are determined solely by the structure of the SSDTs, which is related to the design and installation of the detectors. A valid track with hits in each detector layer should approximately be a straight line. Table 4 provides a detailed geometric mapping of the CSHINE SSDT. For particles that are stopped in a specific unit of the CsI(Tl) crystal, denoted by N3A, only certain strips of DSSSD, marked by N2F and N2B for the front and back strips, respectively, satisfy the geometric relationships G3A,2B and G3A,2F. The incident event of one particle can be used to confirm geometric relationships, as illustrated in Fig. 9. On the surface of each SSD, there were 32 strips with a width of 2 mm, and the gap between adjacent strips was 100 μm. As in the previous experiment, to save electronic channels, every two strips are merged into one channel, and thus, there is a total number of 16 channels on each side. However, an improved merging technique was implemented, where two strips near the edge (first and thirty-second strips) were merged into one channel to minimize the shadow effect in the edge channels. Furthermore, geometric matching between SSSSD strips and DSSSD back strips requires G2B,1S. According to the configuration of the CSHINE SSDT, the SSSSD and the back strips of the DSSSD are in parallel and numbered in the same direction. Because the distance between the SSDs is relatively shorter compared to the distance from the target, hits of a single track on the SSSSD and the backside of the DSSSD will occur on the same or neighboring strip numbers, as restricted by G2B,1S of
| SSDT no. (NTel) | CsI No (N3A) | “2B” Strip No (N2B) | “2F” Strip No (N2F) | “1S” Strip No (N1S) |
|---|---|---|---|---|
| 1-3 | 0 | |||
| 1-3 | 1 | |||
| 1-3 | 2 | |||
| 1-3 | 3 | |||
| 1-3 | 4 | |||
| 1-3 | 5 | |||
| 1-3 | 6 | |||
| 1-3 | 7 | |||
| 1-3 | 8 | |||
| 4 | 0 | |||
| 4 | 1 | |||
| 4 | 2 | |||
| 4 | 3 | |||
| 4 | 4 | |||
| 4 | 5 | |||
| 4 | 6 | |||
| 4 | 7 | |||
| 4 | 8 | |||
| DSSSD-CsI | G3A,2B | G3A,2F | G2B,1S | |
| SSSSD-DSSSD | G2B,1S | |||
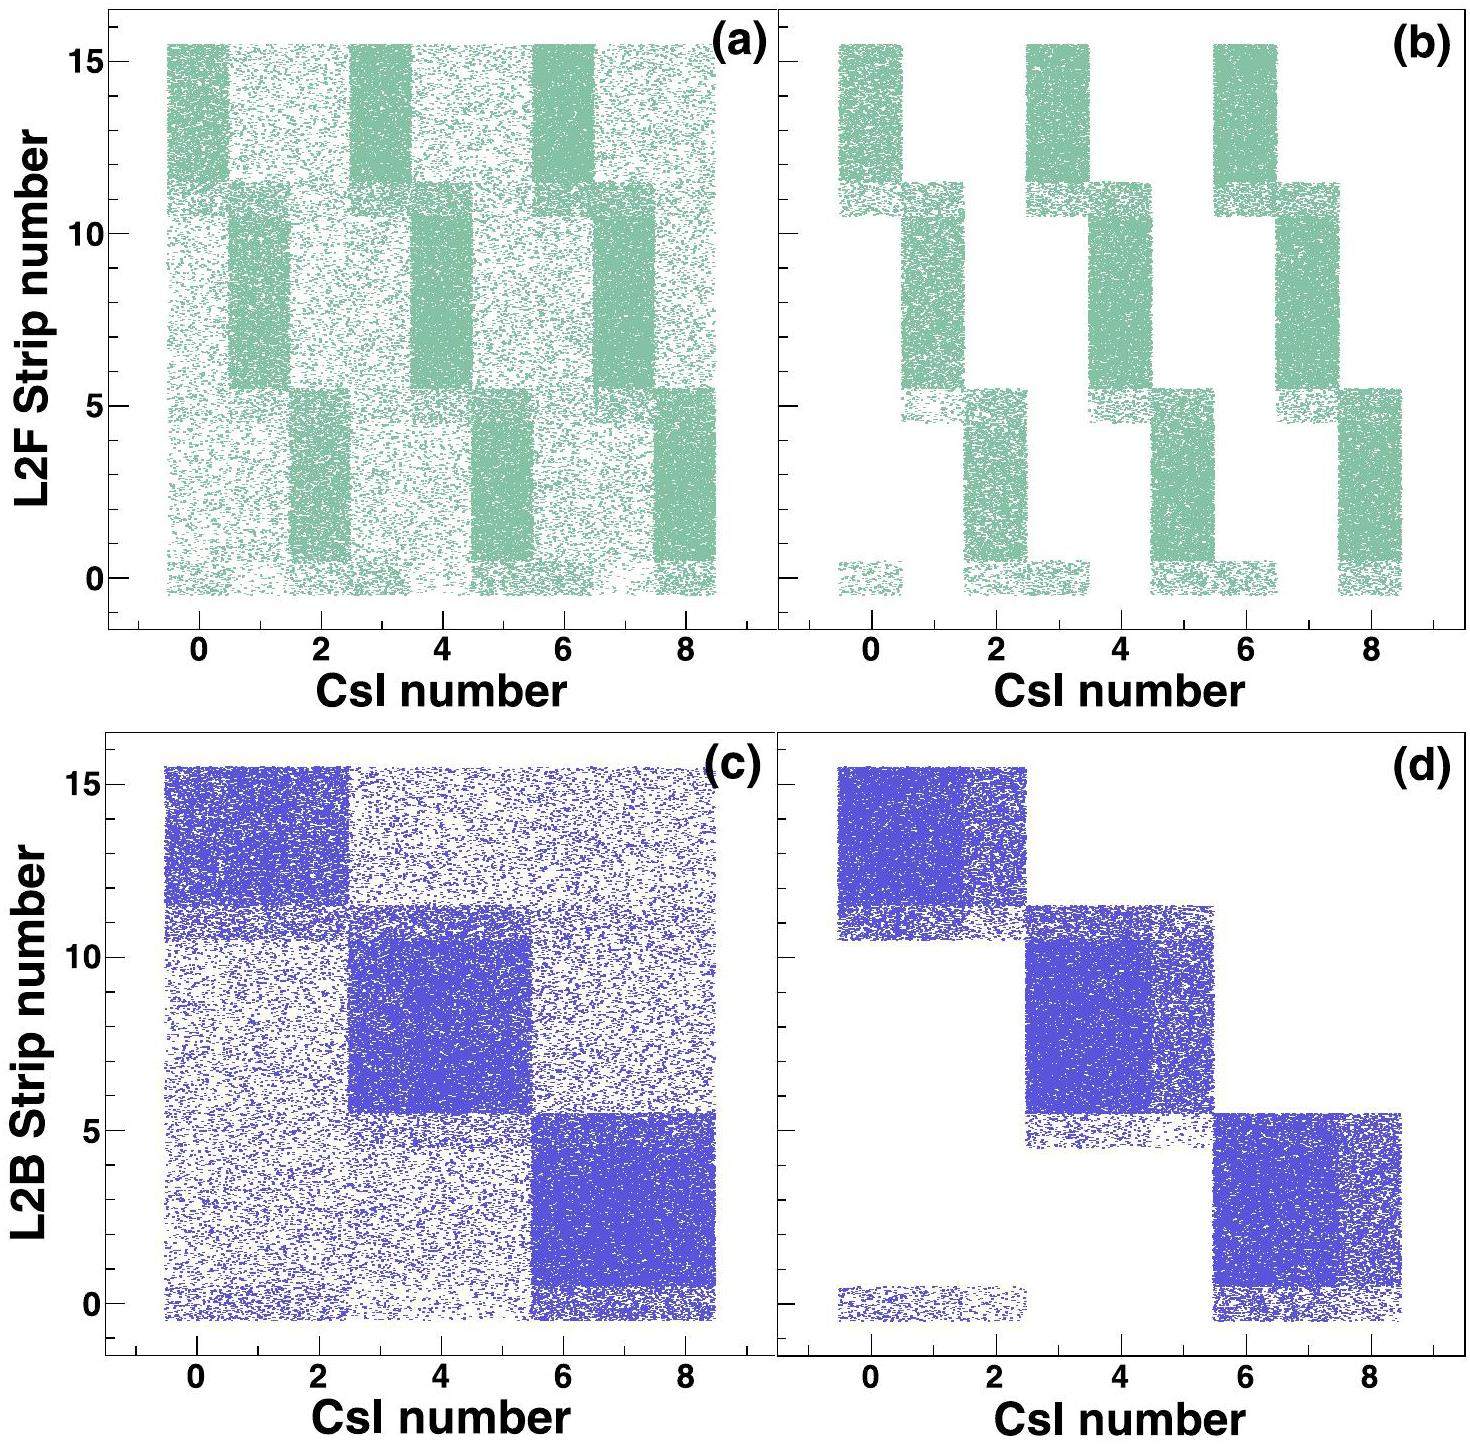
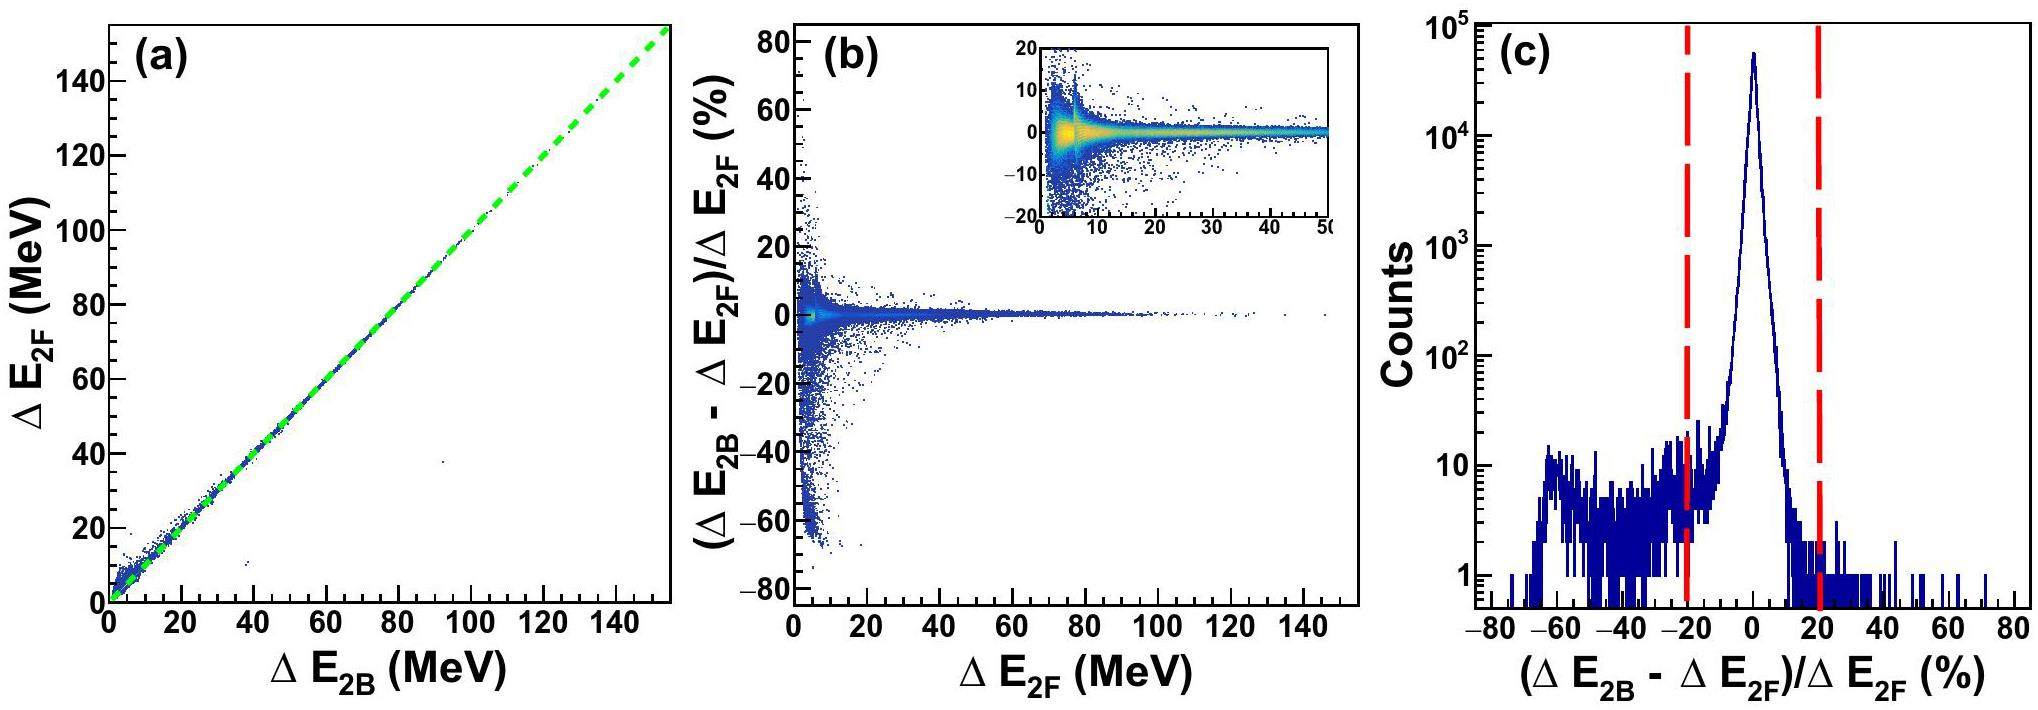
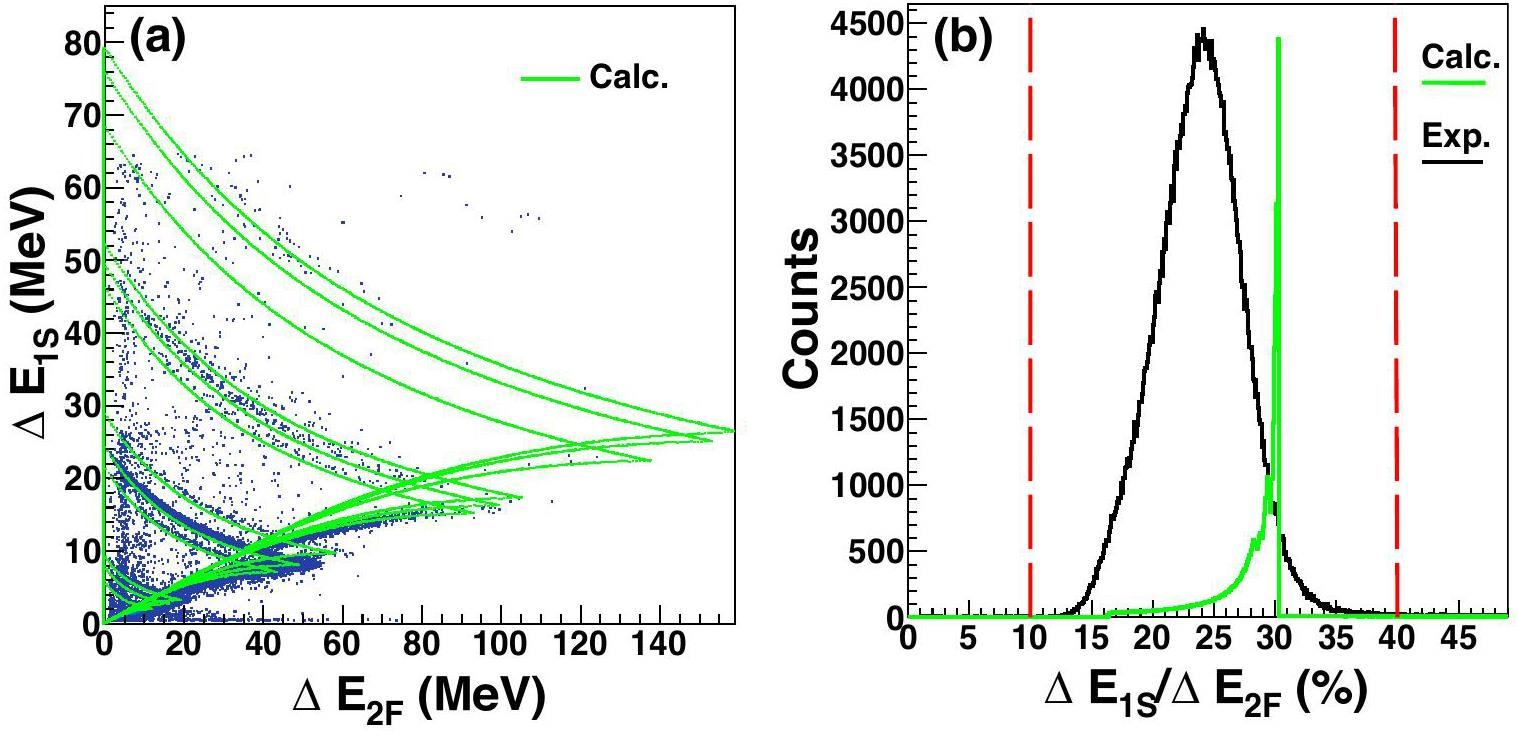
Table 5 lists the energy constraints that should be met for the particles stopped in DSSSD or CsI(Tl). During the particle identification process, the relationship between ΔE and E was determined. For DSSSD-CsI, the multiparametric identification function can be used to determine the mass of a particle using the information of the deposited energies (E3A,Δ E2F). The extracted mass should not be zero, denoted as
| Cases | Constrains | Descriptions |
|---|---|---|
| DSSSD-CsI | The extracted mass is not zero | |
| E2F,1S | ||
| SSSSD-DSSSD | E2B,2F | |
| (E2F,Δ E1S) inside an isotope cut |
Track decoding
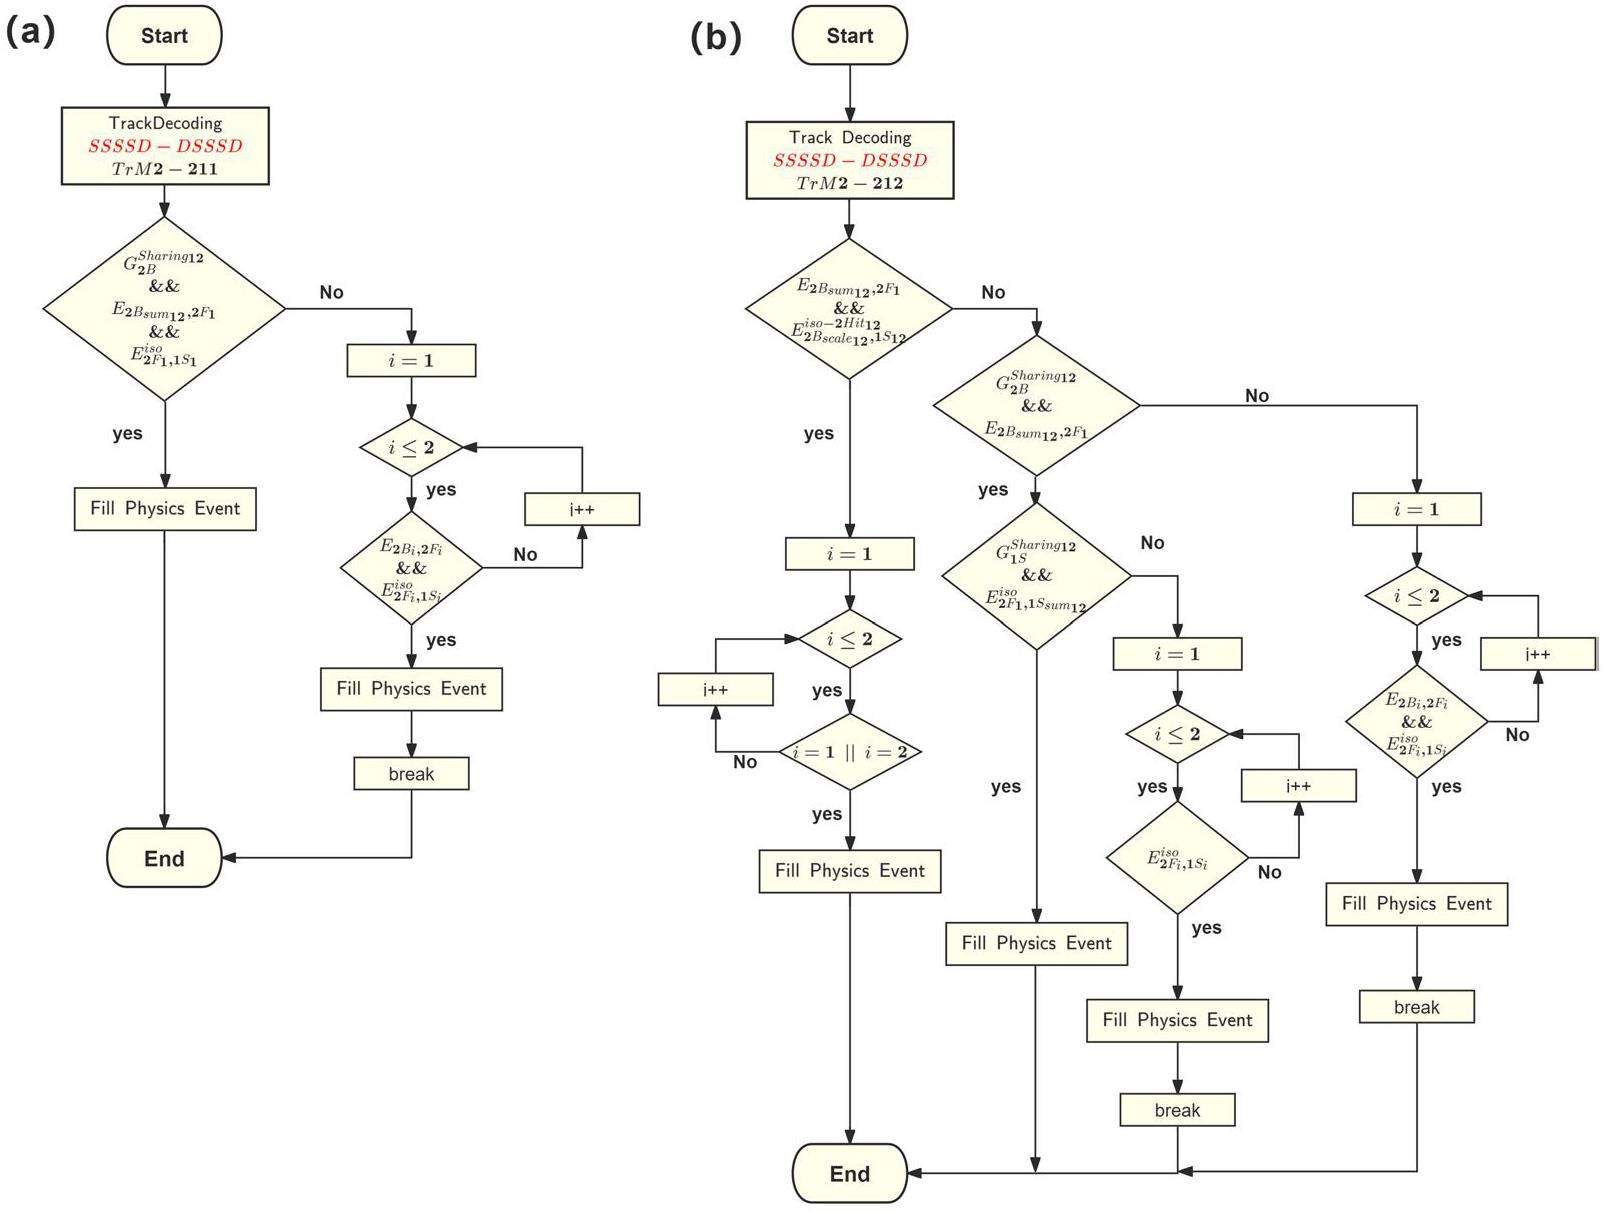
Two types of track decoding start from DSSSD and CsI(Tl), respectively. By considering the multiplicities extracted from each detector layer and matching them in a loop, all the possible cases can be comprehensively covered. Screening out candidate tracks through geometric constraint is crucial, as this process can eliminate a significant number of false tracks.
Table 6 lists some typical track modes that display charge-sharing and multi-hit effects, providing the basic characteristics for decoding complex track modes. In the track decoding algorithm, it is reasonable to assume that charge sharing only occurs between two adjacent channels in the same layer, denoted by
| SSSSD-DSSSD Charge sharing: Tr2-211 | ||||||||
|---|---|---|---|---|---|---|---|---|
| Track No. | N3A | N2B | N2F | N1S | E3A (ch) | ΔE2B (MeV) | ΔE2F (MeV) | ΔE1S (MeV) |
| 1 | - | 11 | 4 | 11 | - | 6.2 | 9.3 | 1.2 |
| 2 | - | 12 | 4 | 11 | - | 3.0 | 9.3 | 1.2 |
| SSSSD-DSSSD Multi-hit: Tr2-212 | ||||||||
| Track No. | N3A | N2B | N2F | N1S | E3A (ch) | ΔE2B (MeV) | ΔE2F (MeV) | ΔE1S (MeV) |
| 1 | - | 1 | 4 | 1 | - | 50.9 | 64.1 | 28.4 |
| 2 | - | 6 | 4 | 6 | - | 13.5 | 64.1 | 1.9 |
| DSSSD-CsI Charge sharing: Tr2-1121a | ||||||||
| Track No. | N3A | N2B | N2F | N1S | E3A (ch) | ΔE2B (MeV) | ΔE2F (MeV) | ΔE1S (MeV) |
| 1 | 3 | 10 | 12 | 10 | 1908 | 23.9 | 7.9 | 5.6 |
| 2 | 3 | 10 | 13 | 10 | 1908 | 23.9 | 15.9 | 5.6 |
| DSSSD-CsI No Charge sharing: Tr2-1121b | ||||||||
| Track No. | N3A | N2B | N2F | N1S | E3A (ch) | ΔE2B (MeV) | ΔE2F (MeV) | ΔE1S (MeV) |
| 1 | 1 | 13 | 6 | 13 | 1563 | 5.7 | 5.8 | 1.4 |
| 2 | 1 | 13 | 11 | 13 | 1563 | 5.7 | 27.2 | 1.4 |
| DSSSD-CsI Multi-hit: Tr2-2121a | ||||||||
| Track No. | N3A | N2B | N2F | N1S | E3A (ch) | ΔE2B (MeV) | ΔE2F (MeV) | ΔE1S (MeV) |
| 1 | 6 | 5 | 15 | 5 | 239 | 18.9 | 10 | 4.1 |
| 2 | 7 | 5 | 10 | 5 | 1023 | 18.9 | 8.7 | 4.1 |
| DSSSD-CsI No Multi-hit: Tr2-2121b | ||||||||
| Track No. | N3A | N2B | N2F | N1S | E3A (ch) | ΔE2B (MeV) | ΔE2F (MeV) | ΔE1S (MeV) |
| 1 | 3 | 6 | 13 | 6 | 3449 | 10.5 | 10.4 | 1 |
| 2 | 5 | 6 | 3 | 6 | 128 | 10.5 | 0.7 | 1 |
| DSSSD-CsI Multi-hit: Tr4-2222 | ||||||||
| Track No. | N3A | N2B | N2F | N1S | E3A (ch) | ΔE2B (MeV) | ΔE2F (MeV) | ΔE1S (MeV) |
| 1 | 0 | 11 | 12 | 11 | 3300 | 40.1 | 17.9 | 7.4 |
| 2 | 0 | 13 | 12 | 13 | 3300 | 18 | 17.9 | 4.3 |
| 2 | 1 | 11 | 8 | 11 | 483 | 40.1 | 39.9 | 7.4 |
| 4 | 1 | 13 | 8 | 13 | 483 | 18 | 39.9 | 4.3 |
In the DSSSD-CsI case, considering track mode Tr2-1121a as an example, which includes the inter-strip effect that occurs in the “2F” layer, the sum of the energy losses in the two neighboring strips 12 and 13 in the “2F” layer and the energy deposited in the crystal should satisfy the energy constraint
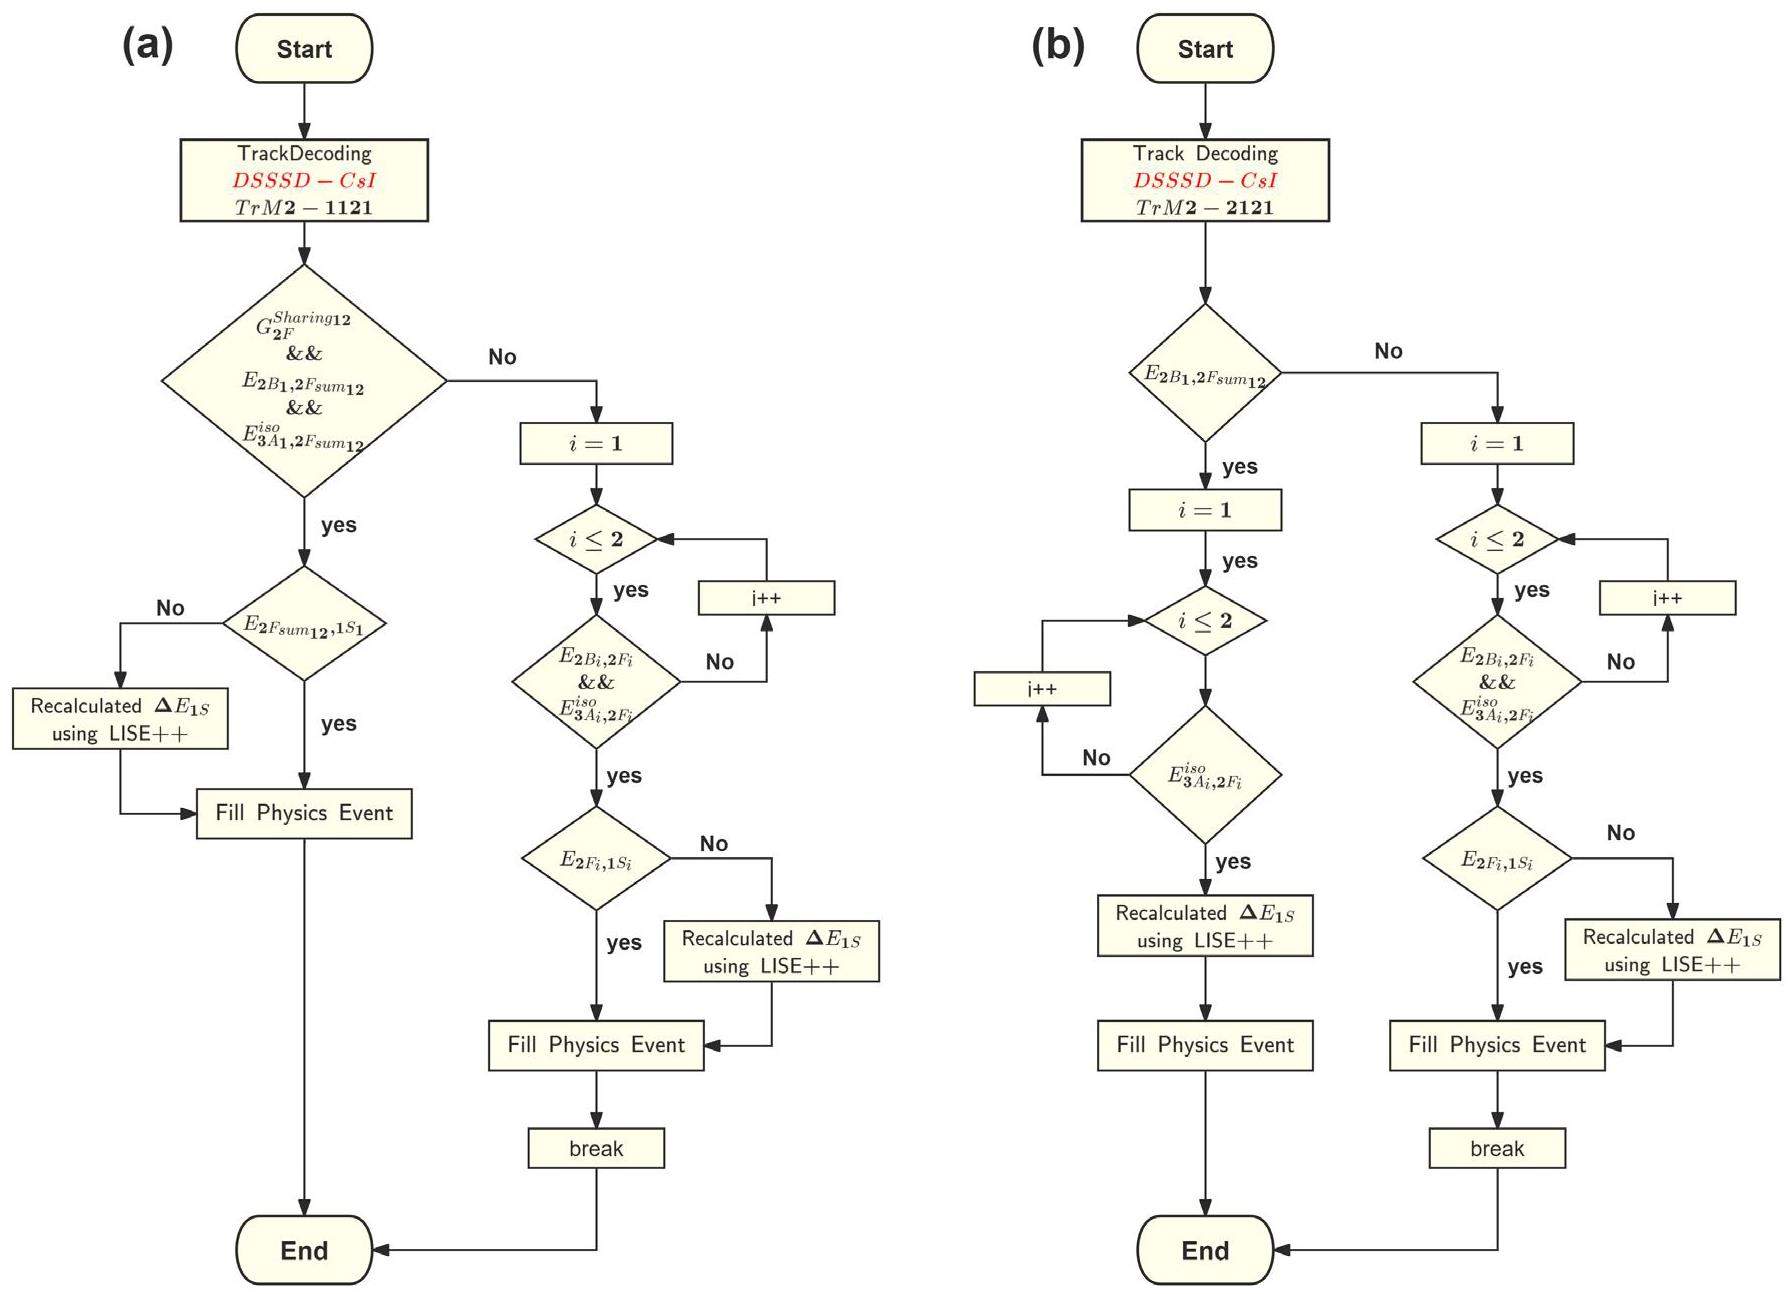
When events involve two or more particles hitting the same CsI(Tl) crystal, the real deposited energy in the crystal cannot be determined accurately, and these events are typically discarded. In the case of Tr2-2121a in Table 6 as an example of multiple hits, two candidate tracks can satisfy the energy constraint
wTrack recognition efficiency is defined as the ratio of the number of successful track recognition events to the number of candidate events that meet the geometric constraints. In this study, we introduced reconstruction information, such as the final effective identification event number and energy spectra, into the track recognition algorithm to optimize the detector signal threshold. With this improvement, track recognition efficiency was further enhanced compared to our previous work [6]. As shown in Table 7, the track recognition efficiencies of all telescopes approached 90% in this experiment.
| Decoding Efficiency (%) | ||
|---|---|---|
| Detector | SSSSD-DSSSD | DSSSD-CsI |
| SSDT1 | 88.32 | 89.88 |
| SSDT2 | 93.28 | 94.02 |
| SSDT3 | 93.89 | 91.92 |
| SSDT4 | 95.25 | 94.72 |
Performance of CSHINE-SSDTs
The characteristic correlation peaks observed in the relative momentum distributions of a pair of particles serve as vital indicators to evaluate the calibration and performance of the detector [30]. As shown in Fig. 14, the momentum spectra for 4He-4He and 2H-4He pairs reveal distinct nuclear decay signatures. Panel (a) shows two prominent peaks around 20 MeV/c and 50 MeV/c, respectively, which correspond to the decay of the unbound ground state of 8Be and the excited state of 2.43 MeV of 9Be. In panel (b), the decay of the excited state of 2.186 MeV of 6 Li is identified by a Lorentzian fit centered at 41.38 MeV/c, which exhibits excellent agreement with the theoretical value of 42.159 MeV/c (relative deviation: 1.85%). In addition, the measurements of the energy spectra for 1H, 2H, and 3H are presented in Fig. 15, which further validates the resolution capabilities of the detection system.
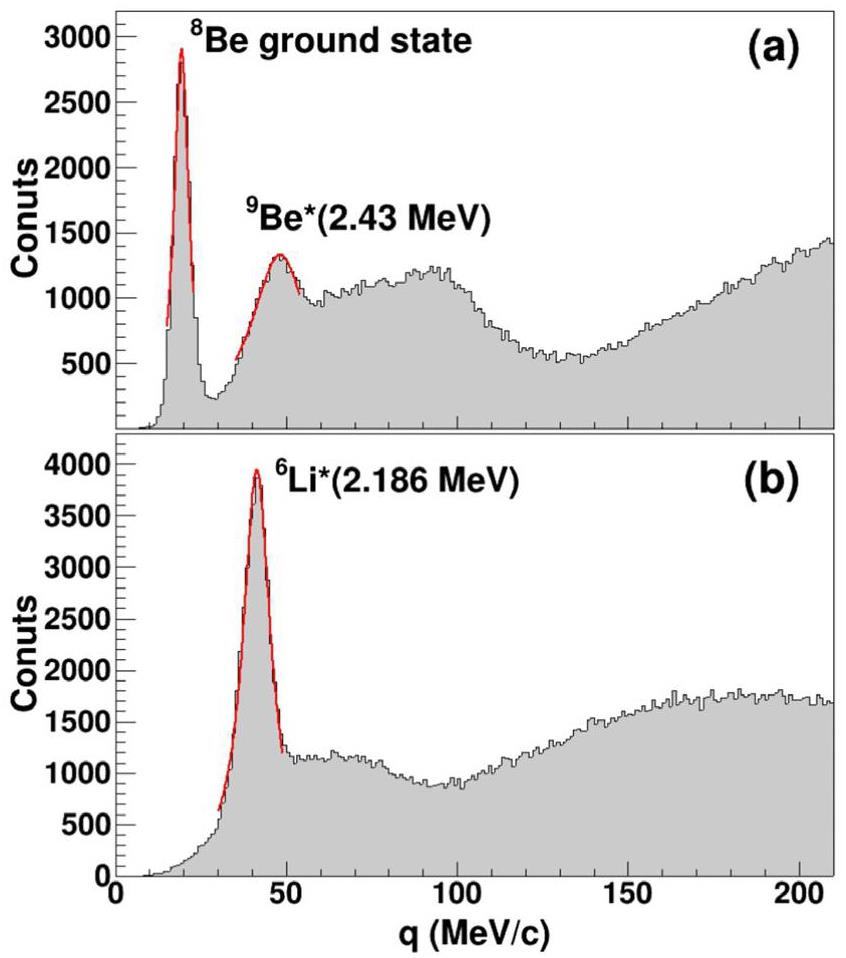

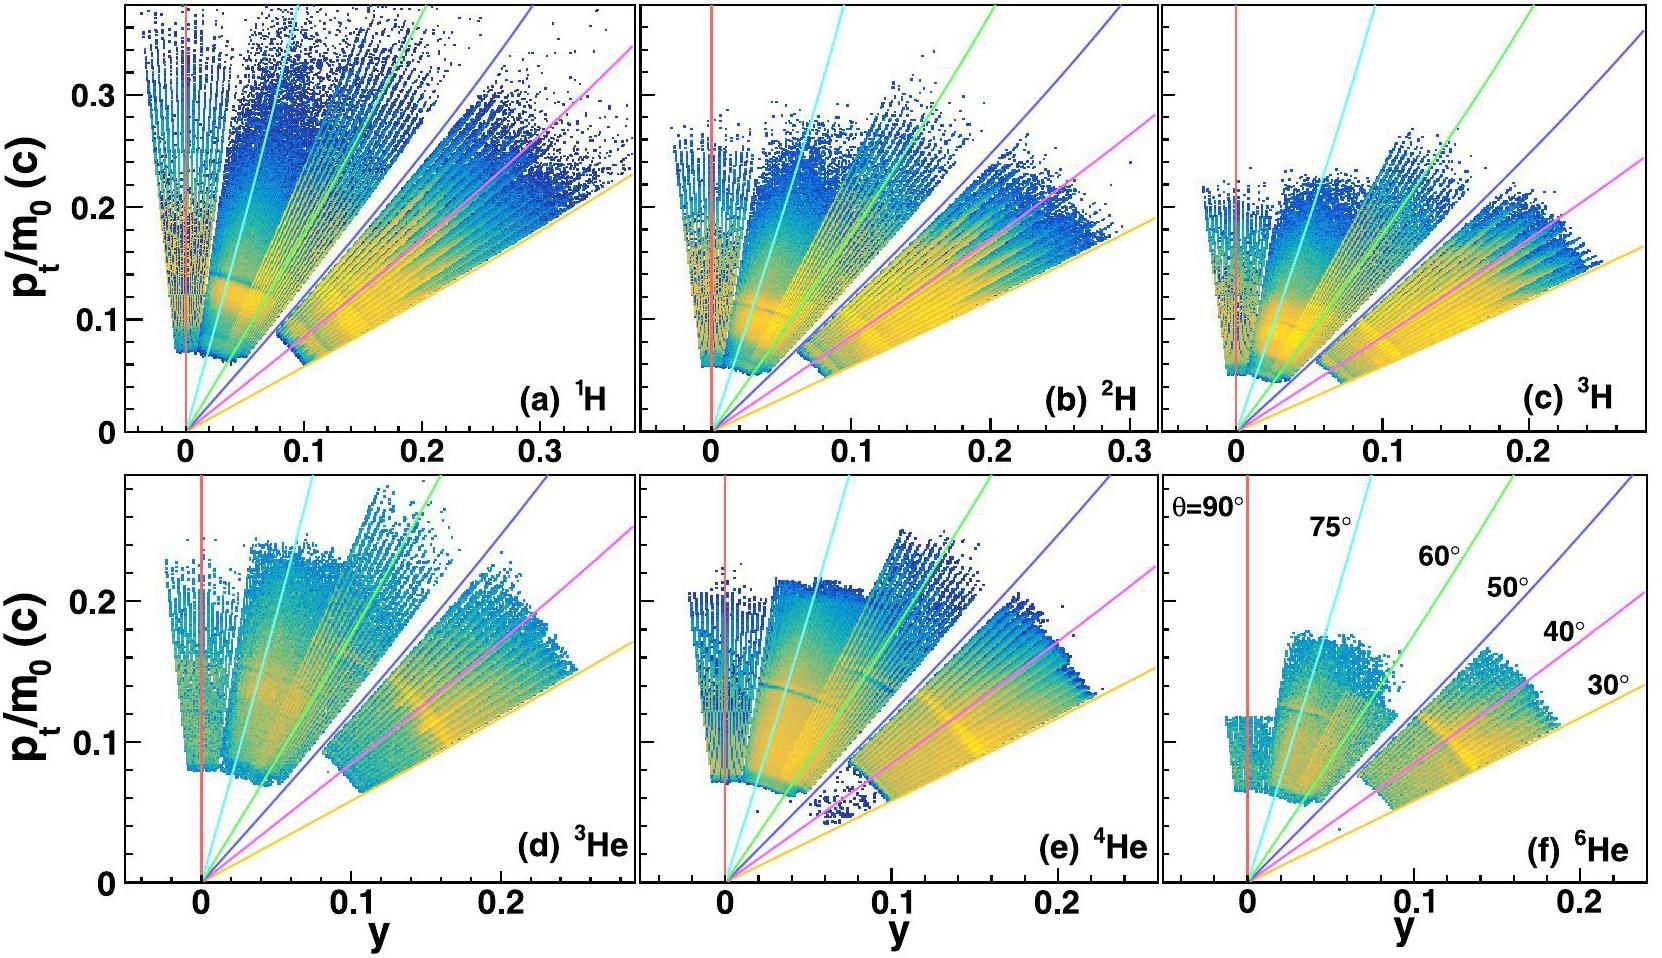
Figure 16 illustrates the phase-space distribution of LCPs with Z ≤ 2 for the CSHINE SSDTs in the experiment. Here, the geometric efficiency arising from the incomplete azimuthal coverage was not corrected. Rapidity, transverse momentum, and mass of the particles are denoted by y, pt, and m0. The curves represent the results for pt/m0 as functions of θ and y:
summary
This study introduces a comprehensive ROOT-based framework specifically developed for CSHINE-SSDTs, integrating advanced detector calibration and track reconstruction methodologies. The silicon strip detectors were precisely calibrated through systematic pulse analysis and radioactive α source measurements, while the CsI(Tl) scintillation crystals were calibrated using the ΔE2-ECsI relationship after accurate PID. The implemented track reconstruction algorithm integrates the geometric and energy constraints, effectively addressing charge-sharing phenomena and multi-hit ambiguities. After introducing reconstruction information such as the final effective identification event number and the energy spectra to optimize the detector signal threshold, the track recognition efficiencies for all SSDTs reached levels approaching or exceeding 90%. Consequently, the detection capabilities of the system were significantly enhanced. The accuracy of the detector energy calibration was evaluated by examining the characteristic peaks in the relative momentum distributions of both 4He-4He and 2H-4He particle pairs. The energy spectra of the hydrogen isotopes and the phase-space distribution of LCPs with Z≤2 in the 25 MeV/u 86Kr + 124Sn reaction were obtained. The established framework provides a robust methodology for data analysis in similar silicon telescope detector systems and offers significant potential for systematic studies in nuclear reaction experiments.
The study of intelligent algorithm in particle identification of heavy-ion collisions at low and intermediate energies
, Nucl. Sci. Tech. 35, 33 (2024). https://doi.org/10.1007/s41365-024-01388-3A Compact Spectrometer for Heavy Ion Experiments in the Fermi energy regime
, Nucl. Instrum. Meth. A 1011,An FPGA-based trigger system for CSHINE
, Nucl. Sci. Tech. 33, 162 (2022). https://doi.org/10.1007/s41365-022-01149-0RIBLL, the radioactive ion beam line in Lanzhou
, Nucl. Instrum. Meth. A 503, 496 (2003). https://doi.org/10.1016/S0168-9002(03)01005-2The Heavy Ion Research Facility in Lanzhou
, Nucl. Phys. News 26, 4 (2016). https://doi.org/10.1080/10619127.2016.1177330Track recognition for the telescopes with silicon strip detectors
, Nucl. Instrum. Meth. A 1029,CSHINE for studies of HBT correlation in heavy ion reactions
, Nucl. Sci. Tech. 32, 4 (2021). https://doi.org/10.1007/s41365-020-00842-2The emission order of hydrogen isotopes via correlation functions in 30 MeV/u Ar + Au reactions
, Phys. Lett. B 825,Long-time drift of the isospin degree of freedom in heavy ion collisions
, Phys. Rev. C 95,Observing the ping-pong modality of the isospin degree of freedom in cluster emission from heavy-ion reactions
, Phys. Rev. C 107,Reconstruction of fission events in heavy ion reactions with the compact spectrometer for heavy ion experiment
, Nucl. Sci. Tech. 33, 40 (2022). https://doi.org/10.1007/s41365-022-01024-yIsospin efects on intermediate mass fragments at intermediate energy-heavy ion collisions
, Nucl. Sci. Tech. 33, 58 (2022). https://doi.org/10.1007/s41365-022-01050-wSymmetry energy effect on emissions of light particles in coincidence with fast fission
, Phys. Lett. B 811,Transport model studies on the fast fission of the target-like fragments in heavy ion collisions
, Phys. Lett. B 797,A CsI(Tl) hodoscope on CSHINE for Bremsstrahlung γ-rays in heavy ion reactions
, Nucl. Instrum. Meth. A 1053,Probing high-momentum component in nucleon momentum distribution by neutron-proton bremsstrahlung γ-rays in heavy ion reactions
, Phys. Lett. B 850,Design and construction of charged-particle telescope array for study of exotic nuclear clustering structure
, Nucl. Sci. Tech. 35, 134 (2024). https://doi.org/10.1007/s41365-024-01503-4Two annular CsI(Tl) detector arrays for the charged particle telescopes
, Nucl. Sci. Tech. 34, 159 (2023). https://doi.org/10.1007/s41365-023-01319-8Analysis of momentum distributions of projectile fragmentation products
, Nucl. Phys. A 734, 536 (2004). https://doi.org/10.1016/j.nuclphysa.2004.01.099Pixelation method for the FARCOS array
, Nucl. Instrum. Meth. A 1069,Mass and charge identification of fragments detected with the Chimera Silicon–CsI(Tl) telescopes
, Nucl. Instrum. Meth. A 490, 251 (2002). https://doi.org/10.1016/S0168-9002(02)01008-2A new functional for charge and mass identification in ΔE - E telescopes
, Nucl. Instrum. Meth. B 194, 503 (2002). https://doi.org/10.1016/S0168-583X(02)00957-6A calibration method for phoswich detectors
, Nucl. Instrum. Meth. A 491, 181 (2002). https://doi.org/10.1016/S0168-9002(02)01230-5LASSA: a large area silicon strip array for isotopic identification of charged particles
, Nucl. Instrum. Meth. A 473, 302 (2001). https://doi.org/10.1016/S0168-9002(01)00295-9Investigation of the thickness non-uniformity of the very thin silicon-strip detectors
, Nucl. Instrum. Meth. A 897, 100 (2018). https://doi.org/10.1016/j.nima.2018.04.041Non-linearity effects on the light-output calibration of light charged particles in CsI(Tl) scintillator crystals
, Nucl. Instrum. Meth. A 929, 162 (2019). https://doi.org/10.1016/j.nima.2019.03.065The mass dependence of CsI(Tl) scintillation response to heavy ions
, Nucl. Instrum. Meth. A 320, 273 (1992). https://doi.org/10.1016/0168-9002(92)90785-3Properties of the QCD matter: review of selected results from the relativistic heavy ion collider beam energy scan (RHIC BES) program
, Nucl. Sci. Tech. 35, 214 (2024). https://doi.org/10.1007/s41365-024-01591-2Chun-Wang Ma is an editorial board member for Nuclear Science and Techniques and was not involved in the editorial review, or the decision to publish this article. All authors declare that there are no competing interests.


