Introduction
In the development of uranium resources or associated mineral resources containing natural radioactive isotopes, large amounts of solid radioactive waste are piled in tailing ponds or used as building materials. Radon exhaled by these materials poses potential risks to humans; therefore, radon exhalation has been extensively studied [1-6]. The radon exhalation rate has been measured under various scenarios, such as soils, underground spaces, uranium tailing ponds, building materials, and indoor environments, to assess the potential risk of radon to the environment and humans [7, 8]. Accurate and reliable methods for measuring the radon exhalation rate are important. Currently, measurement methods for the radon exhalation rate include active (for example, closed-loop [9-12] and flow-through methods [13, 14])) and passive (solid-state nuclear track detectors [15, 16] and activated charcoal adsorption methods [17, 18]) methods.
In the closed-loop method, the measurements obtained using an accumulation chamber are influenced by the insertion depth, back-diffusion, and flow rate [19-21], whereas the negative pressure in the chamber plays a dominant role in the flow-through method [20-22]. The negative pressure difference between the outside and inside of the chamber is a byproduct of regulating the flow rate or deploying a radon purification device at the chamber inlet. Generally, this factor is ignored in laboratory or in-situ experiments. For example, the higher radon exhalation rate measured via the flow-through method than via the closed-loop method can be attributed to measurement uncertainty, whereas the intrinsic difference between the two methods has been ignored [14, 23]. Permeability characterizes the capability of a porous material to allow fluids to pass through and varies greatly among different materials. Currently, the extent to which permeability affects measurements using the flow-through method remains unknown. Therefore, the effect of permeability should be quantitatively analyzed.
Radon migration in porous media is affected by the radon diffusion coefficient, free radon production rate, permeability, and pressure gradient in a given medium. Although it is time-consuming and costly to regulate these parameters in laboratory or field experiments, the development of computational fluid dynamics (CFD) techniques has allowed for the control of these parameters and the prediction of the transport of pollutants and flow field distributions in the soil, atmosphere, and indoor environments [24-26], as validated by experimental data.
In this study, small-scale measurements of the radon exhalation rate on the surface of a uranium tailing pond were performed using the flow-through and closed-loop methods, and the differences between these two methods were assessed. To better understand the abnormally high radon exhalation rate measured with the flow-through method, CFD-based techniques were employed to simulate the radon-concentration field and dynamic transport in a porous medium and accumulation chamber, using the established three-dimensional geometry and reasonable assumptions. Based on the numerical results, the effects of the flow rate, chamber insertion depth, and permeability of the porous medium on the transient radon exhalation rates for diffusion and convection were comprehensively analyzed. The simulations may provide a theoretical basis for the optimization of flow-through measurement systems and devices to obtain accurate radon exhalation rates.
Materials and methods
Radon migration theory
The one-dimensional steady-state convective and diffusive migrations of radon in porous media can be described as follows:
The boundary conditions in Eq. (1) are
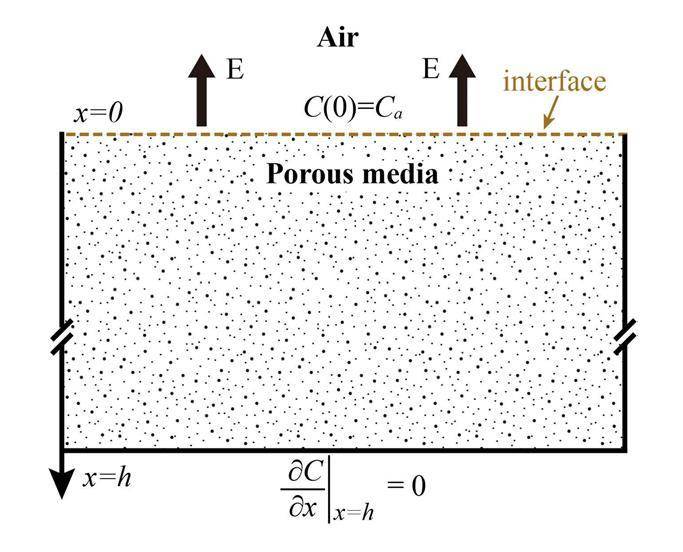
For v = 0 m s-1, Ea-c becomes Ea, which is the initial radon exhalation rate for diffusion because of the assumption of no convection inside the porous medium.
In-situ measurement parameters
The radon exhalation rate was measured in the field on the surface of a uranium tailing pond located in southern China. A 1-kg sample of uranium mill tailings was collected within the 0–0.4 m depth range and mixed to obtain the following particle size distributions: <0.15 mm (10%), 0.15–0.3 mm (15%), 0.3–0.45 mm (24%), 0.45–1 mm (49%), and >1 mm (2%). After sample drying, the measured particle density was 2500±150 kg m-3 based on the drained weight method. The mass radon production rate was (7.18±0.26) × 10−4 Bq kg−1 s−1, as determined by laboratory tests [27, 28] under dry conditions.
A schematic of the flow-through measurement process is shown in Fig. 2. The inlet of the accumulation chamber was connected to the atmosphere via a vent tube. The outlet of the chamber was connected to a flow meter, desiccants, a radon detector (RAD7 from Durridge Company Inc., USA), and a pump used to regulate the flow rate.
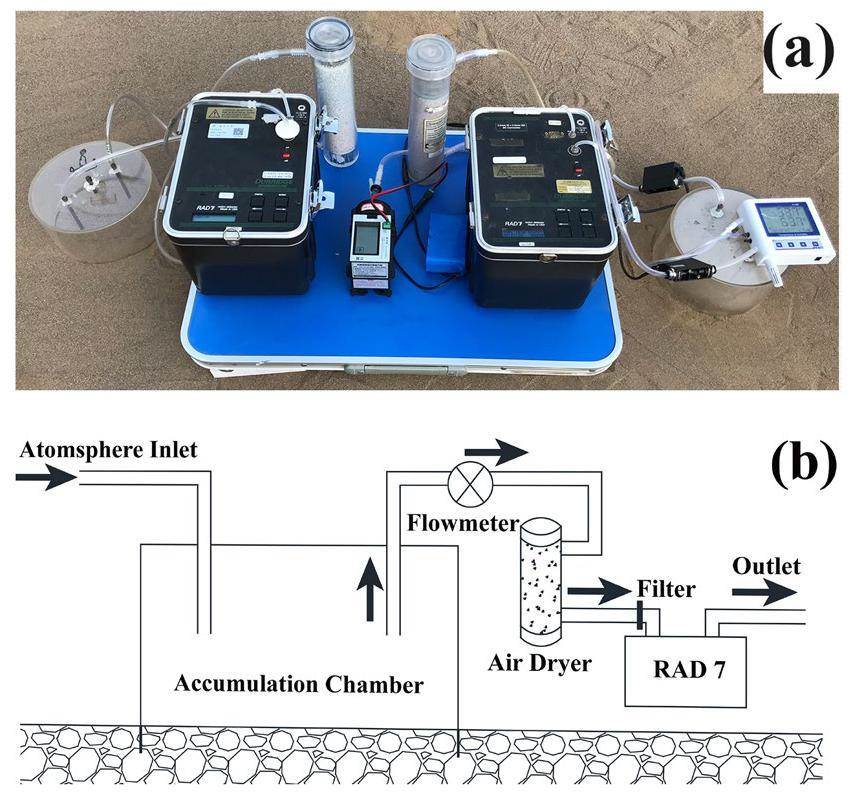
In the experiment, two cylindrical chambers with an inner diameter of Ø20 cm and a wall thickness of 5 mm were prepared. The heights of the two chambers were 11 and 13 cm, with insertion depths of 1 and 3 cm, respectively, suggesting that the effective height inside both chambers was 10 cm. The effect of the flow rate (0.5/1/2 L min-1) on the radon exhalation rate was also considered. The RAD7 radon detector was calibrated at the Radon Laboratory of the University of South China prior to the experiment.
A digital flow meter (MF4008 of Siargo Ltd., USA) and differential pressure meter (RS-YC-4G-4, Shandong Renke Control Technology Co., Ltd., China) were used to record the flow rate at the outlet of the chamber and the pressure difference between the inside and outside of the chamber, respectively. The soil temperature was 27±1.5 °C and the soil moisture was 12±2%. The soil moisture was monitored using soil sensors (Jinan Keyu Electronic Information Technology Co.). The RAD7 device was operated in the SNIFF mode with a cycle of 5 min for the closed-loop method and 3 min for the flow-through method. Sufficient time (approximately 30 min) was reserved for purification of the RAD7 device after each measurement.
The accuracy of the digital flow meter was ±1.5% of the full reading, with a resolution of 0.01 SLPM. The deviation between the two flow meters at the same flow rate was less than 1%. The accuracy of the digital differential pressure meter was ±3% of the full reading ±0.08 Pa at 25 ℃, with a resolution of 0.01 Pa. The accuracy of the soil sensors was ±0.5 ℃ for the temperature reading and ±2% for the moisture reading.
The increase in the radon concentration in the accumulation chamber can be described as follows:
The boundary condition in Eq. (6) is C(0)=C0. The solution of Eq. (6) is
The exponential fit of Eq. (7) and the linear fit of Eq. (11) were applied during subsequent data processing to obtain the fitted radon exhalation rates of Ef-exp and Ef-lin, respectively, with the criterion R2>0.9. R2 depends on the residual sum of squares (RSS) and total sum of squares (TSS), which can be calculated as
The uncertainty of the radon exhalation rate can be determined as [29]
Numerical simulation methods
Geometric model
In the numerical simulation, the cylindrical accumulation chamber had a wall thickness of 5 mm, and the internal effective space of the chamber had a height and radius of 10 cm, as shown in Fig. 3. The two vent tubes (Ø6 mm) at the top of the chamber had a length of 8 cm, with four openings (Ø2 mm) in the walls of the tubes. Adjacent openings were spaced 2 cm apart and distributed at 90°, and the resultant confined jet improved the uniformity of the radon concentration inside the chamber. The dimensions of the radium-containing medium were 1 m (length) × 1 m (width) × 0.5 m (height).
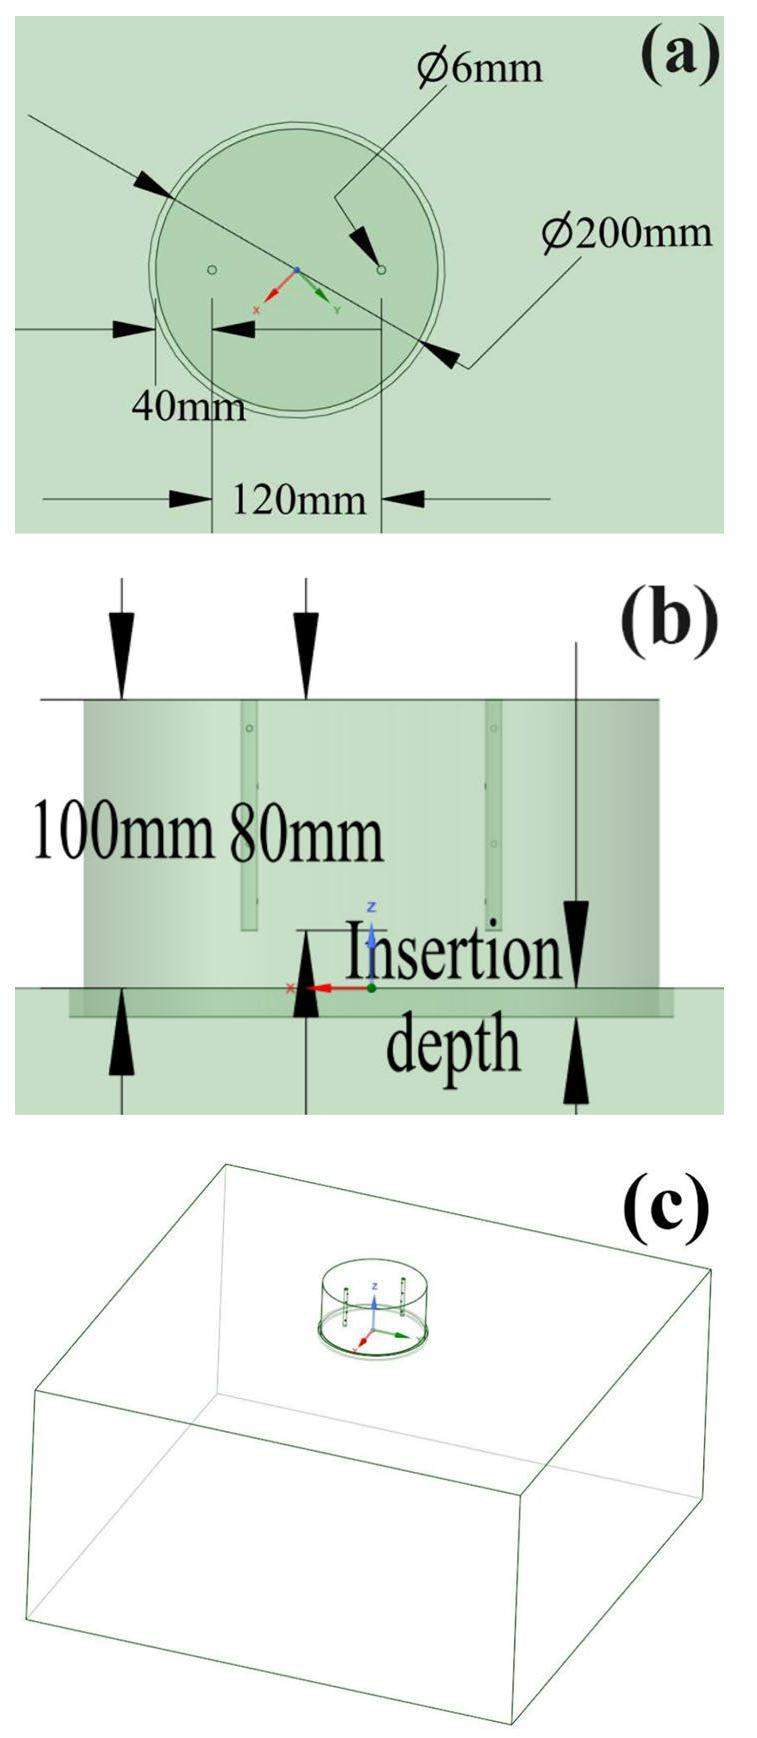
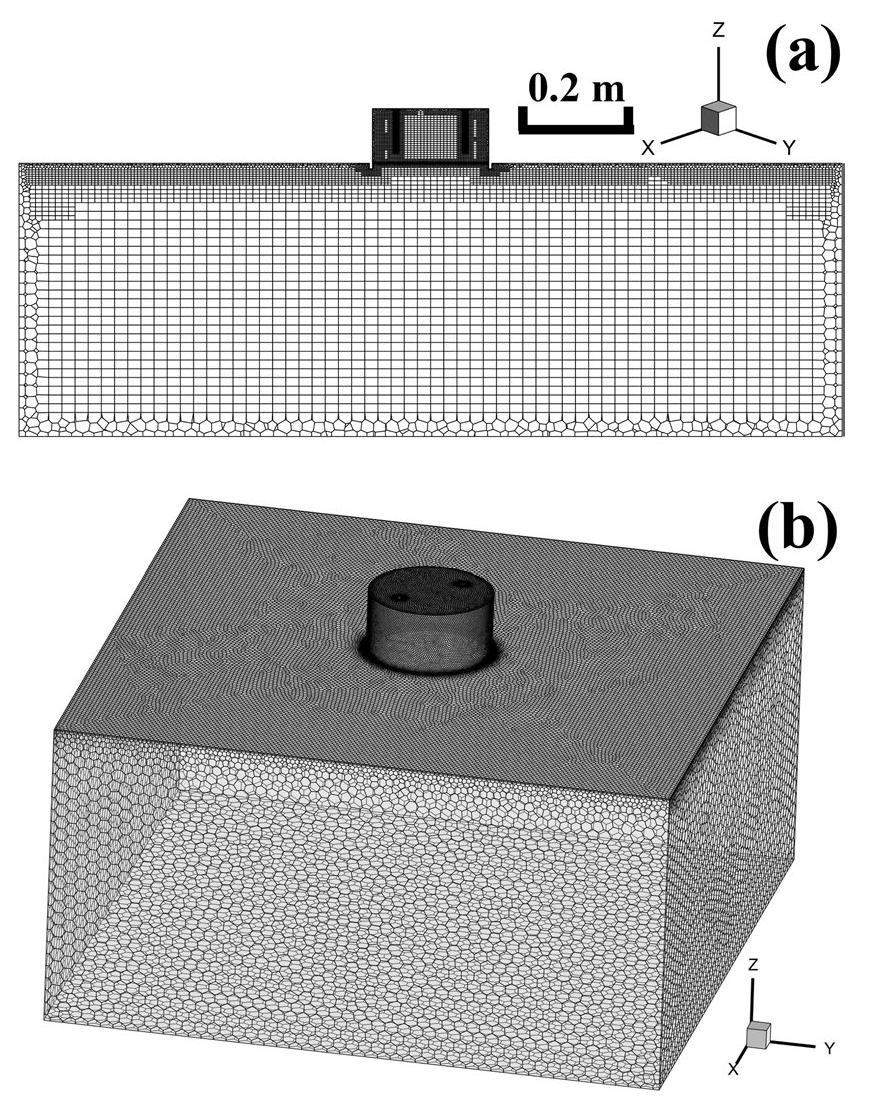
To discretize the geometry, Fluent meshing was used to generate hybrid meshes that included polyhedral and hexahedral elements. The mesh was refined in regions where the radon concentration and gas flow changed rapidly (for example, the porous medium–air interface and vent tube), as shown in Fig. 4.
Governing equations
The gas flows in the chamber and porous medium were assumed to be incompressible and followed the laws of mass and momentum conservation. According to the law of mass conservation, the mass-conservation equation can be expressed as follows:
Following the law of momentum conservation, the momentum-conservation equation can be expressed as follows [30]:
In a given porous medium, SRn is determined by the source and decay terms (
Simulation parameters
The simulated scenarios involved controlling the insertion depth (H1/H3/H5 corresponding to insertion depths of 1/3/5 cm), flow rate (0.5/1/2 L min-1), and permeability (1×10-11/1×10-10/1×10-9 m2). The free radon production rate (α) can be obtained as [27]
The radium activity concentrations in uranium mill tailings commonly range from less than 5 kBq kg-1 to as high as 10 kBq kg-1 [33], with an emission coefficient ranging from 0.1 to 0.35 [27], a dry bulk density of 1800±100 kg m-3, and an average porosity of 0.4, as measured for the samples in the laboratory.
The diffusion coefficient is defined as [27]
The calculated diffusion coefficient of radon was 6.93×10⁻⁶m2 s-1. Laminar flow in a porous medium follows Darcy’s law, and permeability, which is an intrinsic property of porous media, can be defined using the Kozeny–Carman empirical equation [35]:
After sieving the tailing sand in the laboratory, Dp was determined as 0.5 mm on average. K was calculated as 2.47×10⁻¹⁰ m2.
Based on theoretical analysis and references, the determined bulk density was 1800± 100 kg m-3, the radium activity concentration was 7500 Bq kg-1, and the emission coefficient was 0.1. Considering the linear relationship between the radon exhalation rate and free radon production rate in Eq. (5), the determined radon production rate was 3 Bq m-3 s-1 in the simulations. Owing to the short duration (30 min) of the flow-through measurement and the low saturated radon concentration in the chamber contributing to a smaller back-diffusion effect than that of the closed-loop method, the determined radon diffusion coefficient was 6.93×10⁻⁶m2 s-1. Because permeability is a key parameter representing the ability of gas to flow through a porous medium, the permeability ranges from 1×10-11 m2 to 1×10⁻⁹ m2, and the porosity is 0.4 based on references. The physical parameters for the simulations were ultimately determined, as listed in Table 1.
The finite volume method (FVM) was adopted for the numerical calculations. The
To simplify the model, the following assumptions were made: the porous medium was considered homogeneous, and the impacts of gravity and temperature were ignored.
For
Initial and boundary conditions
The initial radon concentration distribution in the porous medium was calculated prior to simulating the measurements, where the radon concentration at the porous medium–air interface was set to 0 Bq m-3. The measurement was conducted in transient mode with an initial radon concentration of 0 Bq m-3 at 0 s in the chamber. The detailed boundary settings are presented in Table 2.
| Boundary | Settings | |
|---|---|---|
| Inlet | Pressure-inlet | Radon concentration equals 0 Bq m-3; 0 Pa |
| Outlet | Velocity-inlet | Equivalent to 0.5/1/2 L/min, normal to boundary; radon concentration gradient equals 0 Bq. m-4 |
| The surface of porous medium not covered by the chamber | Pressure-inlet | Radon concentration equals 0 Bq m-3; 0 Pa |
| Openings of the vent tube inside the chamber | Interior | – |
| Gas-solid interface | Interior | – |
| Wall of the geometry | Wall | Radon flux equals 0Bq m-2 s-1 |
Mesh independence
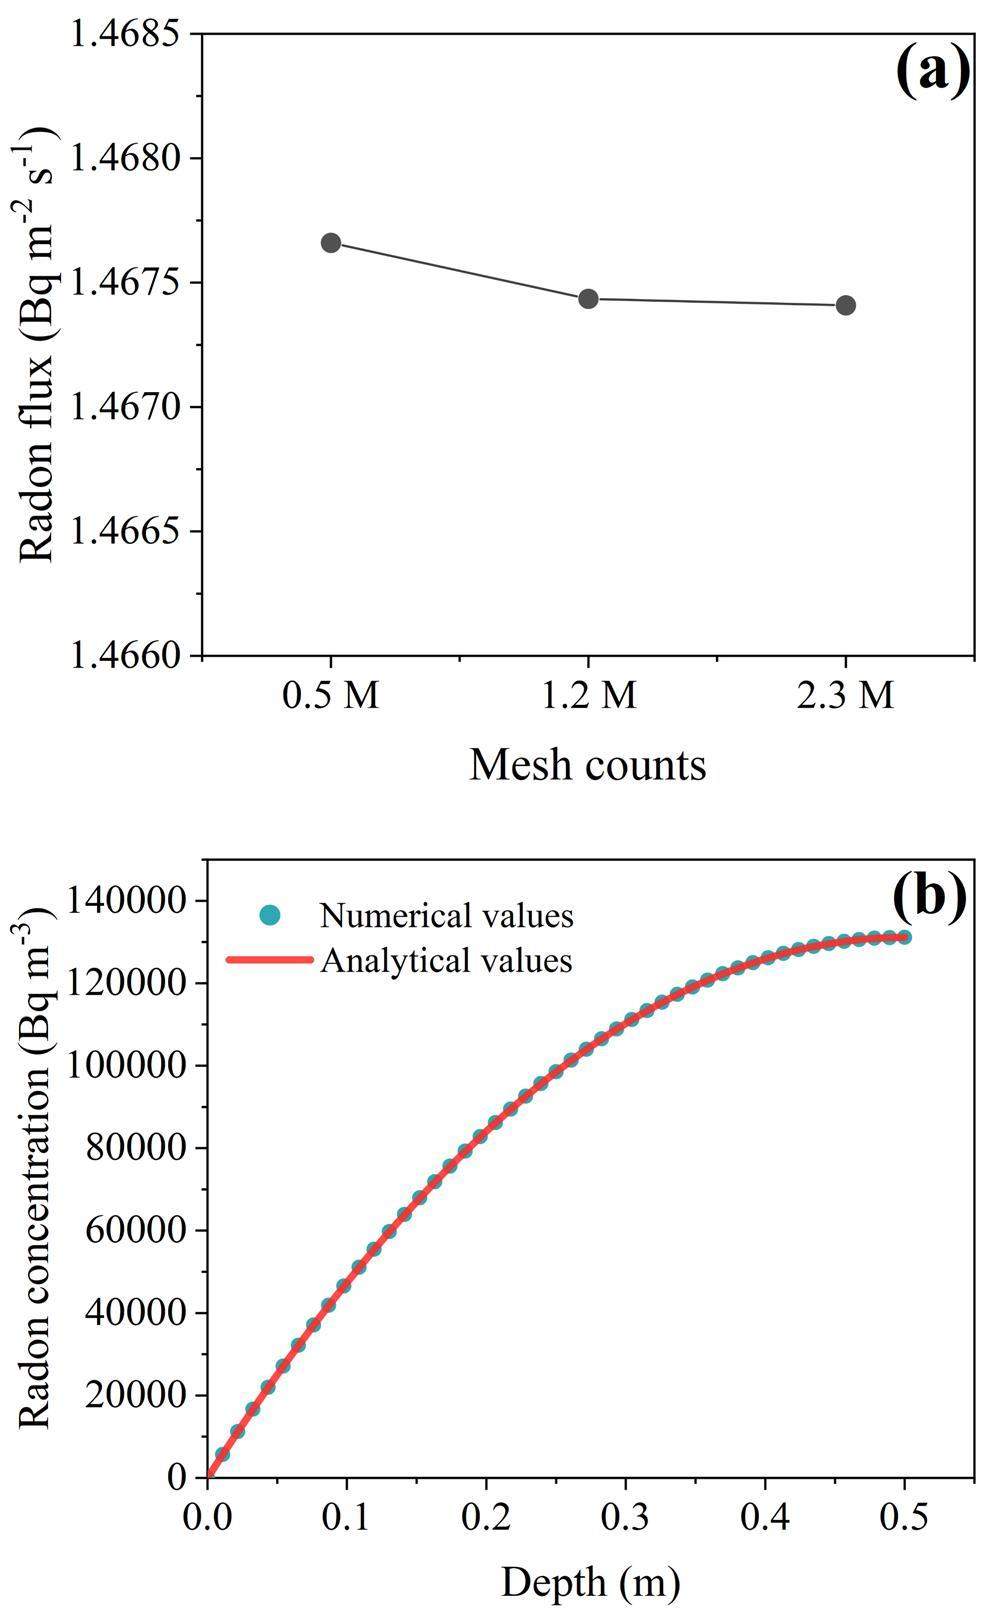
Coarse, medium, and refined (0.5 M, 1.2 M, and 2.3 M cells, respectively) hybrid meshes were generated for the geometric model. Subsequently, a mesh sensitivity analysis was conducted, as shown in Fig. 5. The radon exhalation rate approximately stabilized as the number of cells increased. The criterion for mesh discretization depends on minimizing the error between the numerical and theoretical results while reducing the calculation time. Thus, a medium mesh was used in subsequent simulations.
The Reynolds number ranged from 89 to 517 according to the minimum (0.66 m s-1) and maximum (3.8 m s-1) velocities at the interface of the opening in the wall of the vent tube. By refining the mesh, the mesh sizes for the inlet, outlet, and openings of the tubes ranged from 0.12 to 0.3 mm, and y+ reached a maximum value of 3.6 for the tube wall and 2.5 for the chamber boundary, which ensured that rapid flow near the wall was captured.
The simulations were conducted using Ansys Fluent. The steady-state radon-concentration fields of the analytical and numerical solutions were compared before the transient simulations. The analytical and numerical radon concentrations at different depths were determined, and the difference was found to be less than 0.2%. A detailed comparison is presented in Fig. 5b.
The convergence condition was a residual of less than 10-10 and a difference in the radon exhalation rate between two consecutive iterations of less than 10-7.
Data processing
The volume-averaged radon concentration (Cv-avg) in the chamber was obtained as follows:
The volume-averaged static pressure (Ps) inside the chamber was calculated as
In the transient mode, the transient radon exhalation rate for the diffusive component can be defined as
The overall transient radon exhalation rate is defined as follows:
Results and discussion
In-situ measurement of the radon exhalation rate
Radon accumulation curves for the closed-loop and flow-through methods are shown in Fig. 6a and b, respectively. The radon exhalation rate was exponentially fitted using Eq. (7), and R2 varied between 0.92 and 0.96, as shown in Fig. 6c. The radon concentration in the ambient air was monitored in all measurements, reaching 86 Bq m-3 on average. The flow rates at the chamber inlet ranged from 3.5×10⁻⁶ to 1.7×10⁻⁵ m s-1, as monitored using a digital flow meter.
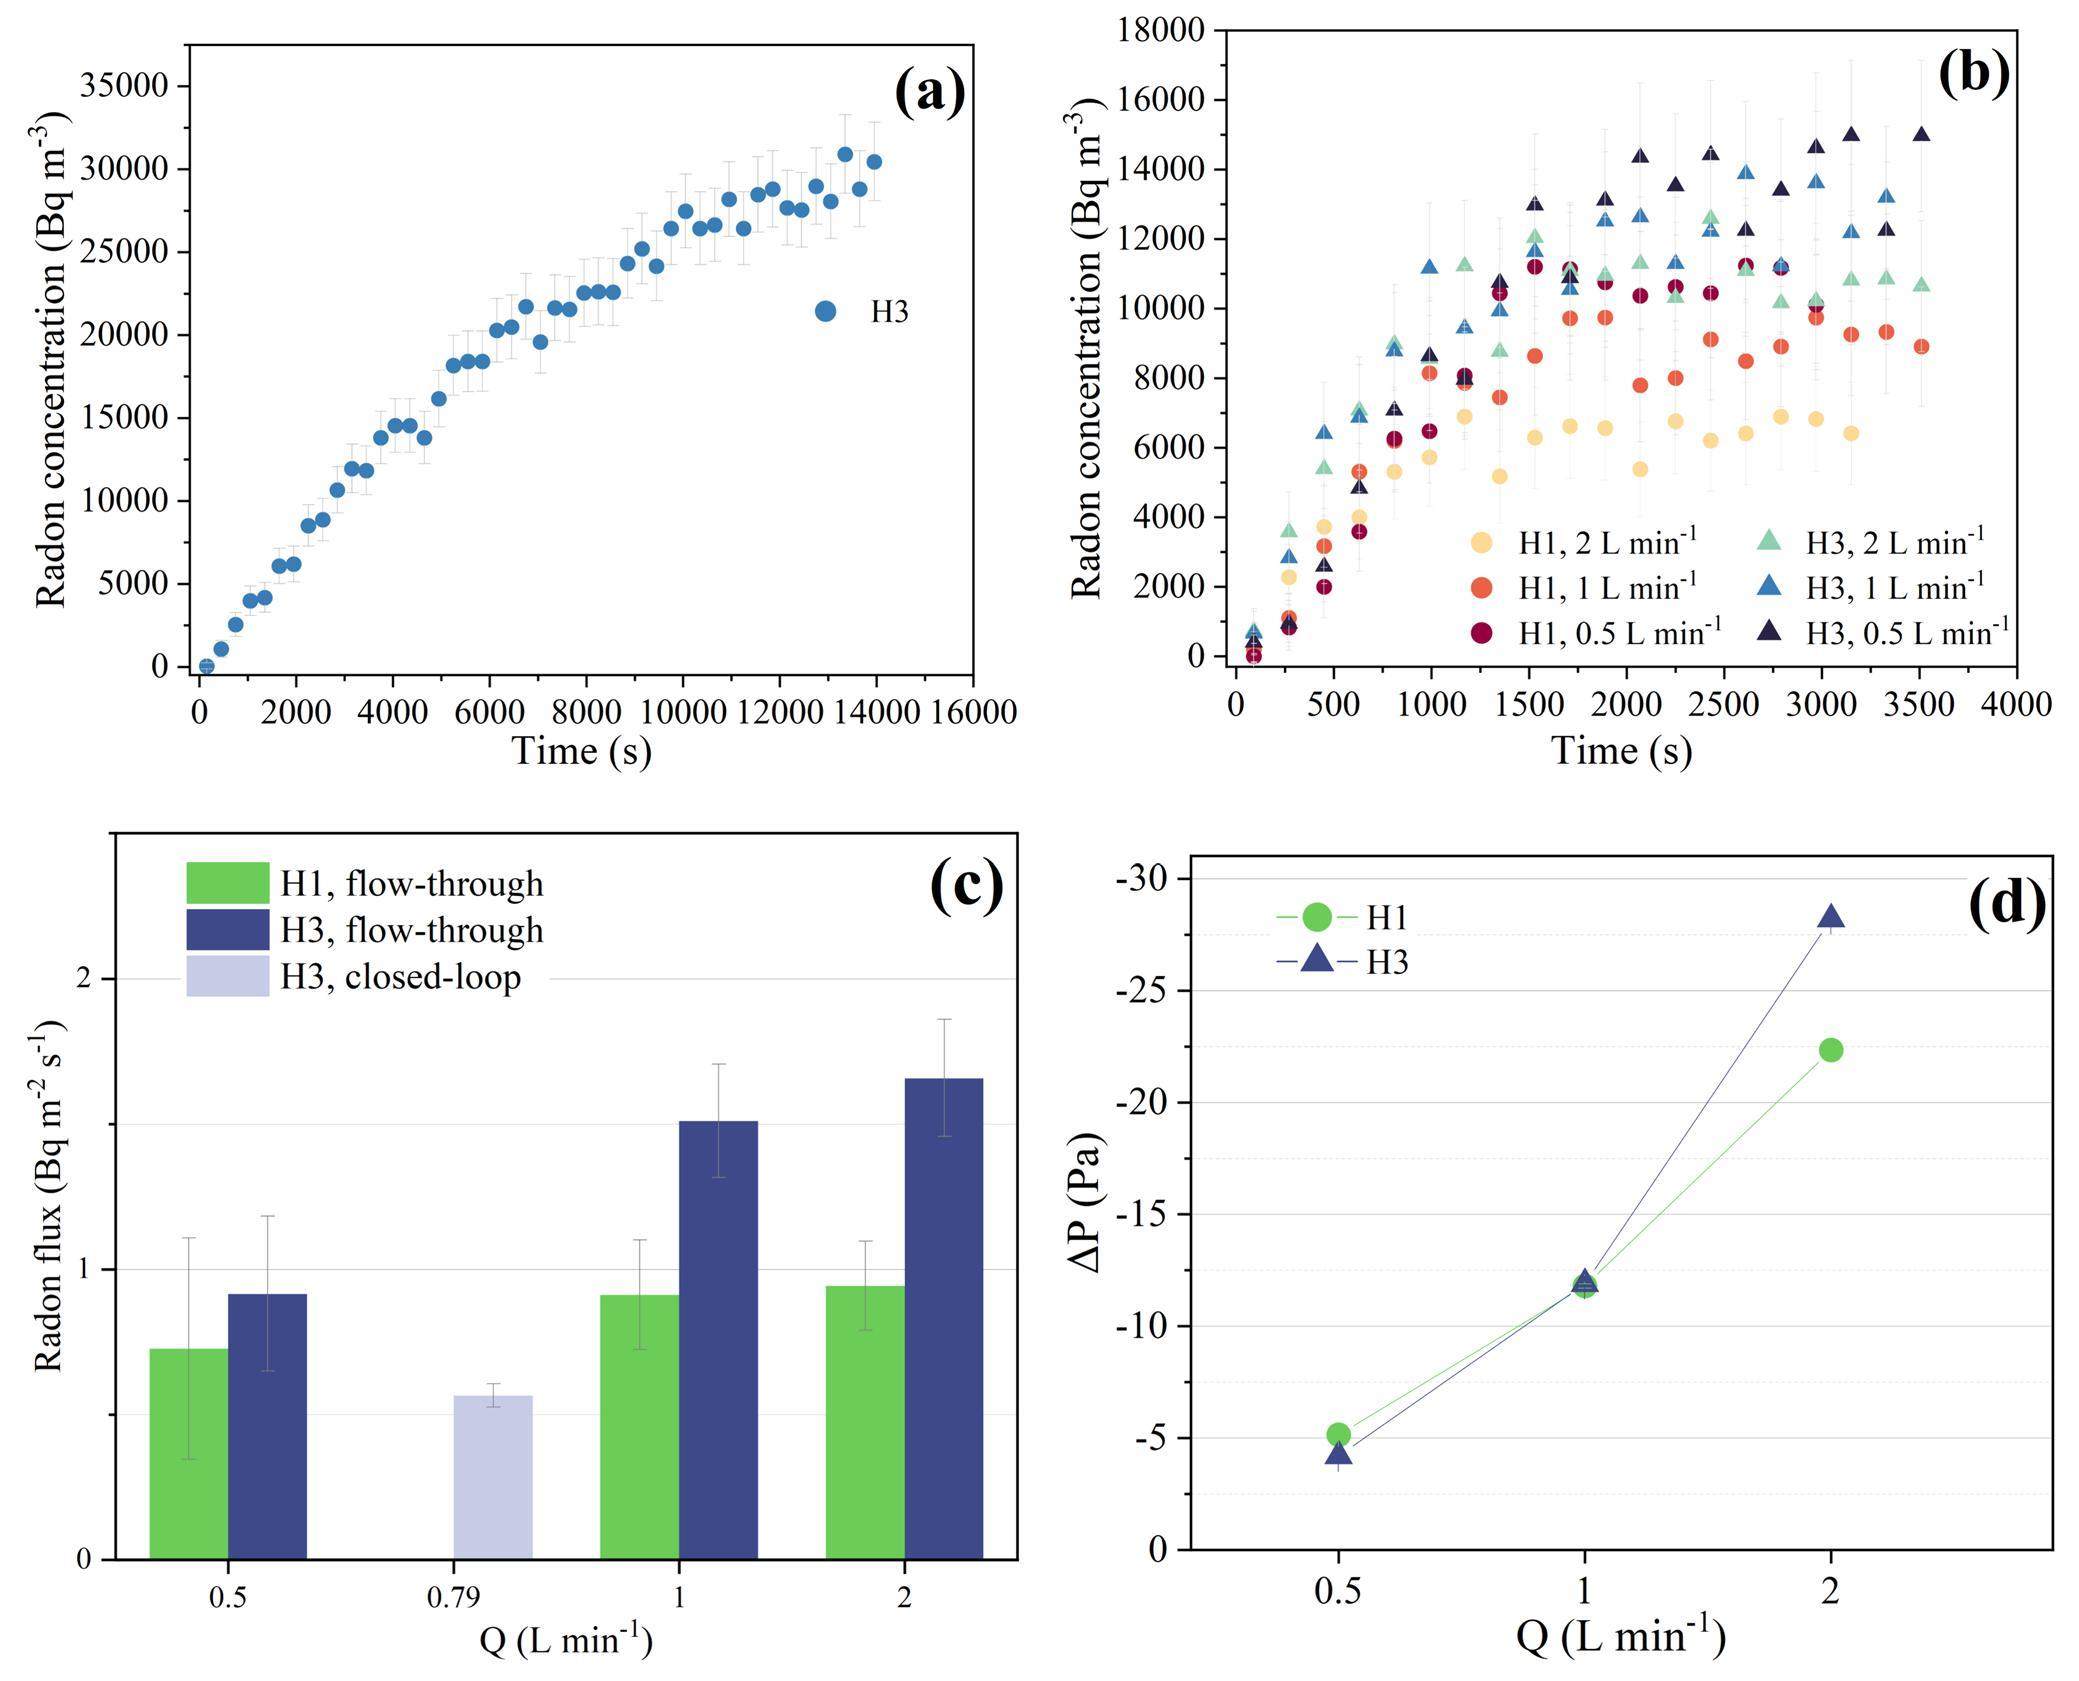
The radon exhalation rate measured using the flow-through method was higher than that measured using the closed-loop method and was positively correlated with the negative pressure difference and flow rate, that is, the higher the flow rate, the greater the radon exhalation rate or negative pressure difference, as shown in Fig. 6d. An increase of 161.88–293.2% (H3) was observed in the fitted radon exhalation rate determined using the flow-through method relative to that of the closed-loop method, with a slight increase at high flow rates between 1 and 2 L min-1. The negative pressure in the chamber was affected by the variation in the flow rate, with the negative pressure difference increasing by 433.98% for H1 and 671.43% for H3 from 0.5 to 2 L min-1.
Numerical simulation of the measurements via the flow-through method
Curve and linear fitting method
To comprehensively examine the impacts of the flow rate, insertion depth, and permeability of the porous medium on radon exhalation during the flow-through measurements, CFD-based techniques were employed to simulate the flow-through measurements at insertion depths of 1/3/5 cm, permeabilities of 1×10-11/1×10-10/1×10-9 m2, and flow rates of 0.5/1/2 L min-1. The radon exhalation rate was obtained by applying exponential and linear fits, excluding the first 60 s of the data. The time ranges for exponential fitting were 60–600 s, 720 s, 900 s, 1020 s, 1200 s, 1500 s, and 1800 s, whereas those for linear fitting were 60–240 s, 360 s, 480 s, 600 s, 720 s, 840 s, 960 s, 1080 s, 1200 s, 1320 s, 1440 s, and 1560 s. A minimum duration of 60–600 s was considered for the exponential fitting because of the potential failure to fit data points with a shorter duration. The minimum duration of 60–240 s for linear fitting ensured that three-minute data points could be fitted after excluding the initial first minute of the data, as shown in Fig. 7.
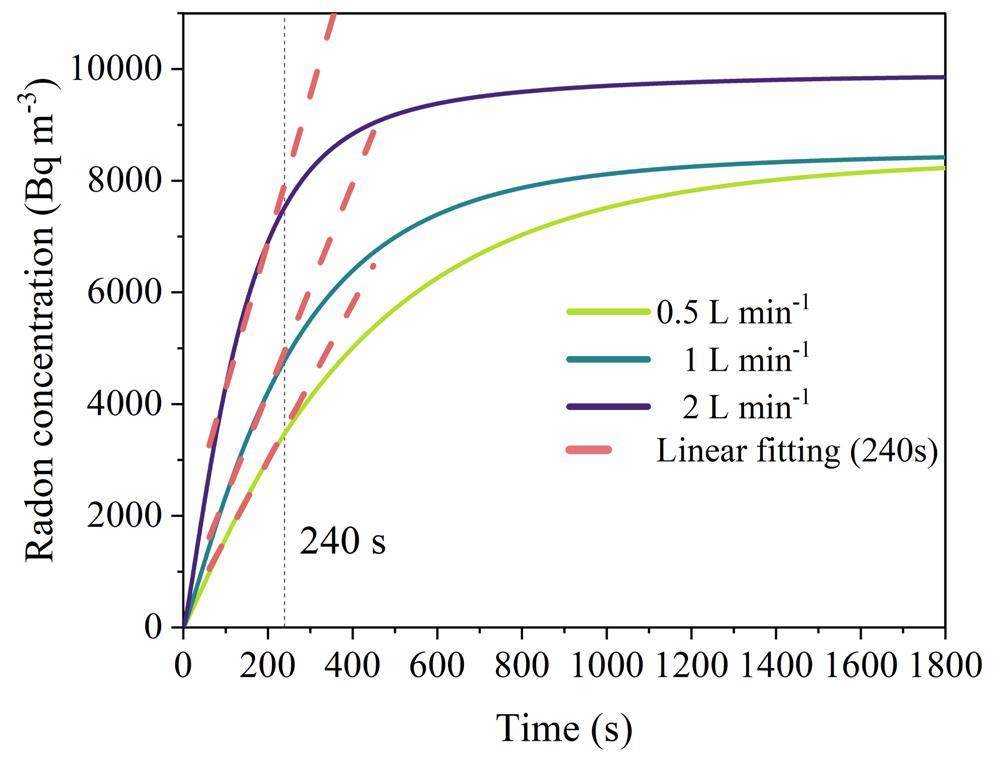
When a linear fit was applied, a short period of linear growth was observed in the flow-through measurements, as shown in Fig. 7. The slope of the linear fit at the same flow rate rapidly decreased with increasing time, whereas the slope differed for different flow rates. Therefore, a linear fit for the radon exhalation rate was not applicable to the flow-through measurements.
In addition, the radon accumulation in the chamber at 1800 s was close to saturation, and the steady-state radon concentrations were 8457.508, 8500.607, and 9714.73 Bq m-3 at flow rates of 0.5, 1, and 2 L min-1, respectively. The radon exhalation rates were calculated to be 3.93, 7.06, and 16.04 Bq m-2 s-1 using Eq. (9) and 1.89, 2.94, and 5.79 Bq m-2 s-1 using Eq. (8), respectively. The former values were significantly higher than the latter, suggesting that λeV in Eq. (8) cannot be ignored in the flow-through measurements because this term, rather than the negative value in the closed-loop method, can reach a positive value in view of the observed negative pressure difference in the field experiments. Therefore, calculating the radon exhalation rate using Eq. (9) is also inapplicable to flow-through measurements.
At
Effects of the permeability, insertion depth, and flow rate on radon exhalation
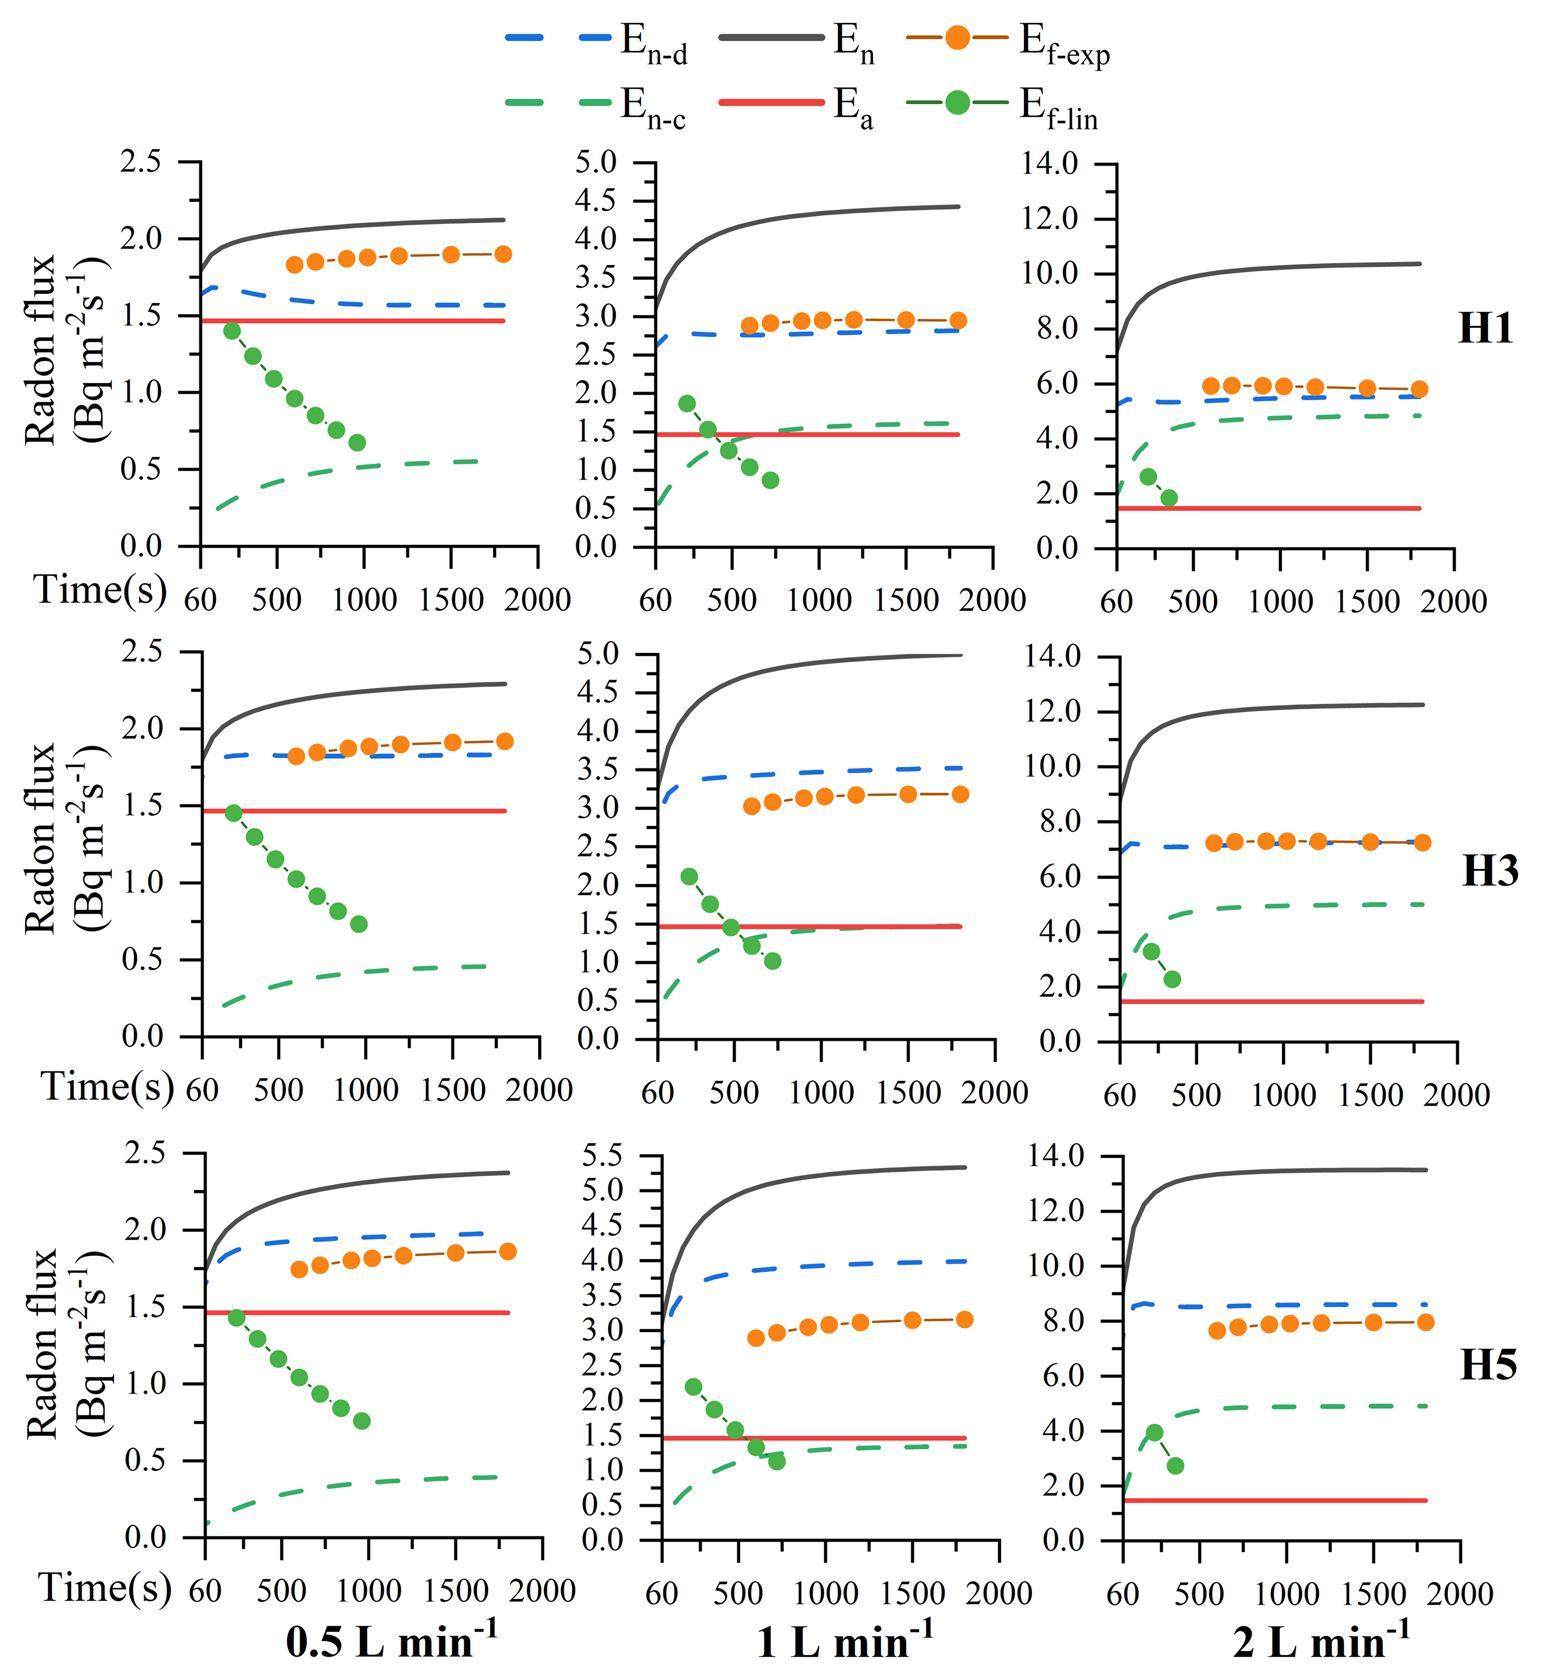
To investigate the effects of permeability, insertion depth, and flow rate on radon exhalation in the flow-through measurements, the fitted (exponential and linear fits), transient, and initial radon exhalation rates were compared for different time ranges. Both the insertion depth and flow rate affected the radon exhalation; however, the flow rate had a greater effect than the insertion depth, as shown in Fig. 8. With an increase in the flow rate from 0.5 to 2 L min-1 at an insertion depth of 1 cm and a permeability of 1×10⁻¹⁰ m2, the curve-fitted radon exhalation rate (Ef-exp) increased by 305.68%, whereas it increased by 427.66% for an insertion depth of 5 cm. With an increase in the insertion depth from 1 to 5 cm at a flow rate of 0.5 L min-1, Ef-exp increased by 97.99%, whereas it increased by 137.09% at a flow rate of 2 L min-1. Both the increased flow rate and insertion depth contributed to the emission of radon at high concentrations, which contributed to an increase in the radon exhalation rate.
Similar trends were observed for the variation in permeability, as shown in Fig. 9. With an increase in the flow rate from 0.5 to 2 L min-1 at an insertion depth of 1 cm and a permeability of 1×10-11 m2, Ef-exp increased by 135.66%, whereas it increased by 345.49% at a permeability of 1×10⁻⁹ m2. By increasing the permeability from 1×10-11 to 1×10⁻⁹ m2 at a flow rate of 0.5 L min-1, Ef-exp increased by 251.70%, whereas it increased by 640.99% at a flow rate of 2 L min-1. The variation in the radon exhalation rate influenced by permeability could be conveniently simulated based on the assumptions of fixed porosity and radon diffusion coefficient. Changes in the permeability affect the ability of a porous medium to allow fluids to pass through. Higher permeability indicates lower fluid resistance, which promotes convective radon exhalation.
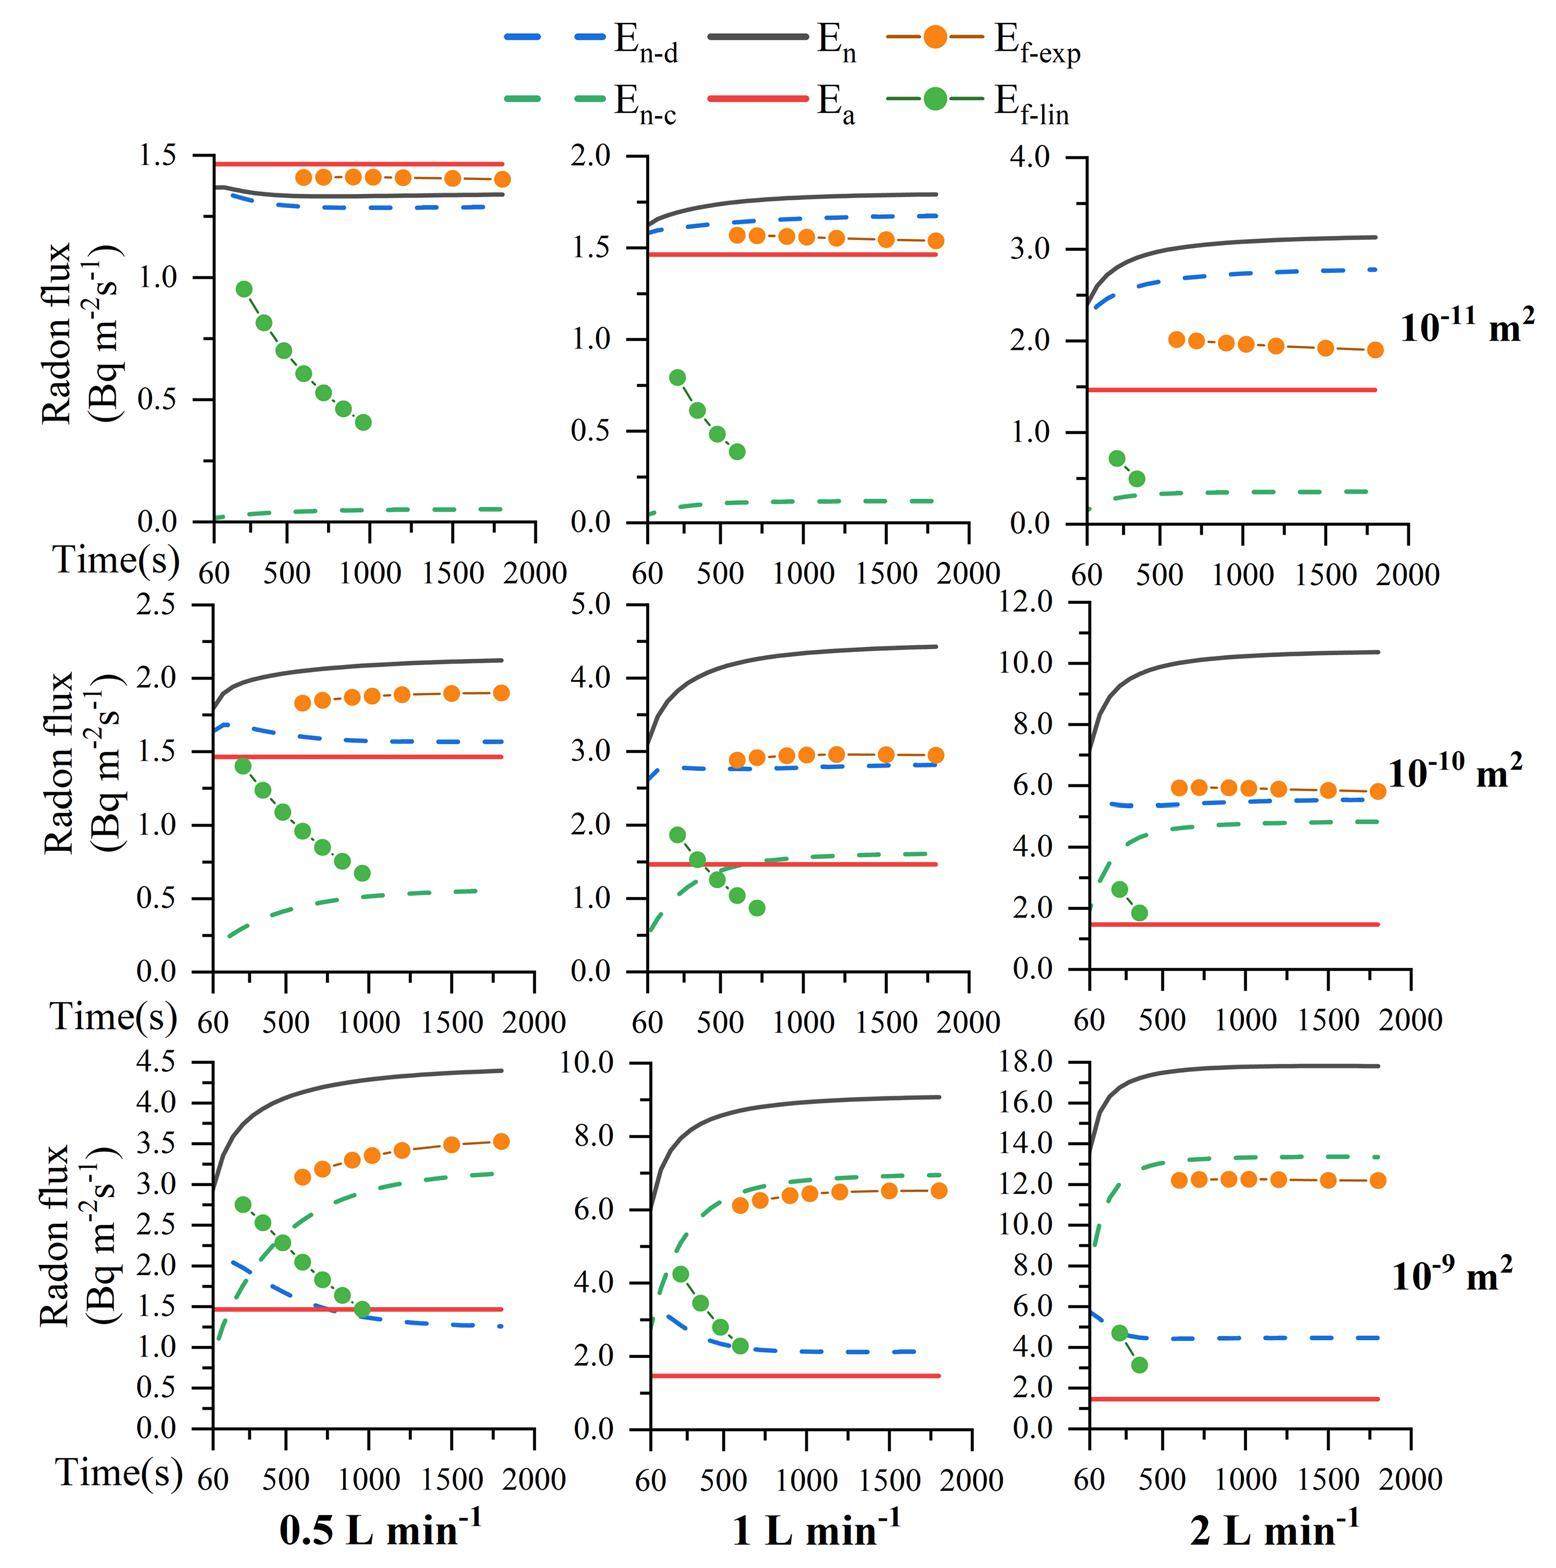
Both En-d and En-c gradually reached saturation after a certain period. In the case of a relatively low permeability (10-11/10-10m2), En-d was higher than En-c in most cases because the low permeability of the porous medium limited the radon at deeper layers from being drawn to the surface, and diffusive radon exhalation played a dominant role. In contrast, the case with higher permeability 1×10⁻⁹ m2 was dominated by convective radon exhalation. Moreover, the increased flow rate had a significant effect on En-d and En-c. Increasing the flow rate from 0.5 to 2 L min-1 with a permeability of 1×10⁻¹⁰ m2 resulted in increases of 353.26% for En-d and 871.34% for En-c at H1, and 434.65% and 1243.71% for En-d and En-c, respectively, at H5. The larger the insertion depth of the chamber, the greater the impact of the increased flow rate on En-c than on En-d, where the high radon concentration around the insertion position is drawn to the surface and is responsible for the high convective radon exhalation rate.
For an insertion depth of 1 cm, a permeability of 1×10⁻¹⁰/1×10-9 m2, and a flow rate of 0.5 L min-1, the transient radon exhalation rate for diffusion (En-d) first decreased and then gradually stabilized over time. This is because radon accumulation in the chamber led to a decreased radon concentration gradient at the porous medium-air interface and inhibited diffusive radon exhalation. In contrast, the transient radon exhalation rate for convection (En-c) gradually increased over time and reached equilibrium because of the higher radon concentration at the porous medium–air interface induced by convective radon exhalation. As En-c was not negligible relative to En-d, the transient radon exhalation rate (En) was higher than the initial radon exhalation rate (Ea), and the difference increased with increasing permeability, flow rate, and insertion depth.
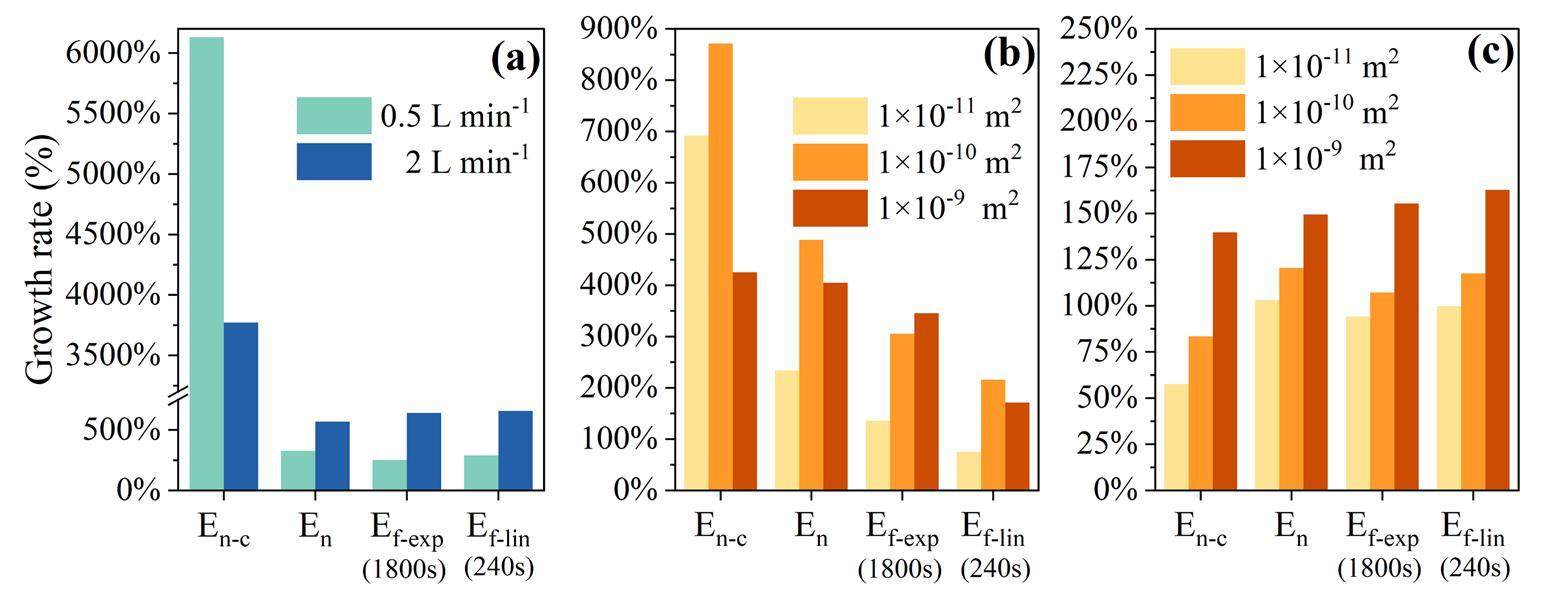
To quantify the effects of the permeability, insertion depth, and flow rate on the radon exhalation rate, En-c and En at 1800 s, Ef-exp for a duration of 1800 s, and Ef-lin for a duration of 240 s were extracted, as shown in Fig. 10. The effect of varying the permeability from 1×10-11 to 1×10⁻⁹ m2 on En-c was significant, with increases of approximately 3750% and 6100% at 2 and 0.5 L min-1, respectively. At an insertion depth of 1 cm, the permeability increased by approximately 251–650% for Ef-exp and Ef-lin, as shown in Fig. 10a. A flow rate ranging from 0.5 to 2 L min-1 increased En-c by approximately 870%, whereas it increased by 75–340% for Ef-exp and Ef-lin, as shown in Fig. 10b. At 1 L min-1, an insertion depth ranging from 1 to 5 cm resulted in a 58–162% increase in the radon exhalation rate, as shown in Fig. 10c.
En-c increased with flow rate or permeability at a fixed insertion depth, as shown in Figs. 8 and 9. Excessive convective radon exhalation during flow-through measurements was mainly responsible for the considerably higher measured radon exhalation rates than the initial values, which reasonably explains the abnormally high radon exhalation rate in the field.
Correlation between E, Δ P, and Q
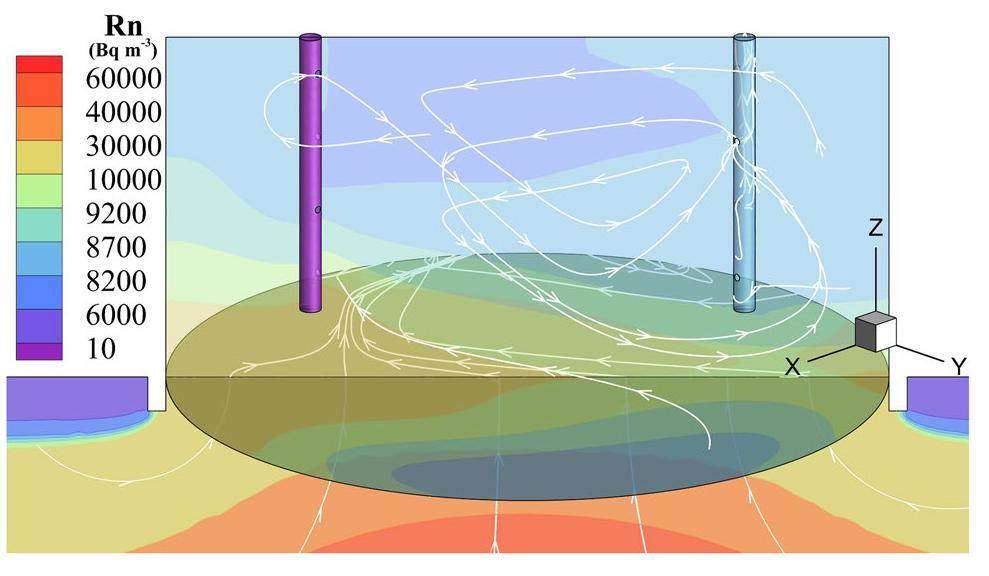
The previous line graphs revealed that both En-c and Ef-exp were greater than Ea under variations in permeability, flow rate, and insertion depth. Considering the negative pressure difference in the chamber observed in the field experiments, streamlines were obtained from the simulations, as shown in Fig. 11 (an insertion depth of 1 cm, permeability of 1×10⁻¹⁰ m2, and flow rate of 1 L min-1 at 1800 s). The negative pressure difference in the chamber caused the gas outside the chamber to flow into the porous medium before entering the chamber, during which a high concentration of radon was transported into the chamber. This explains why Ef-exp was greater than Ea.
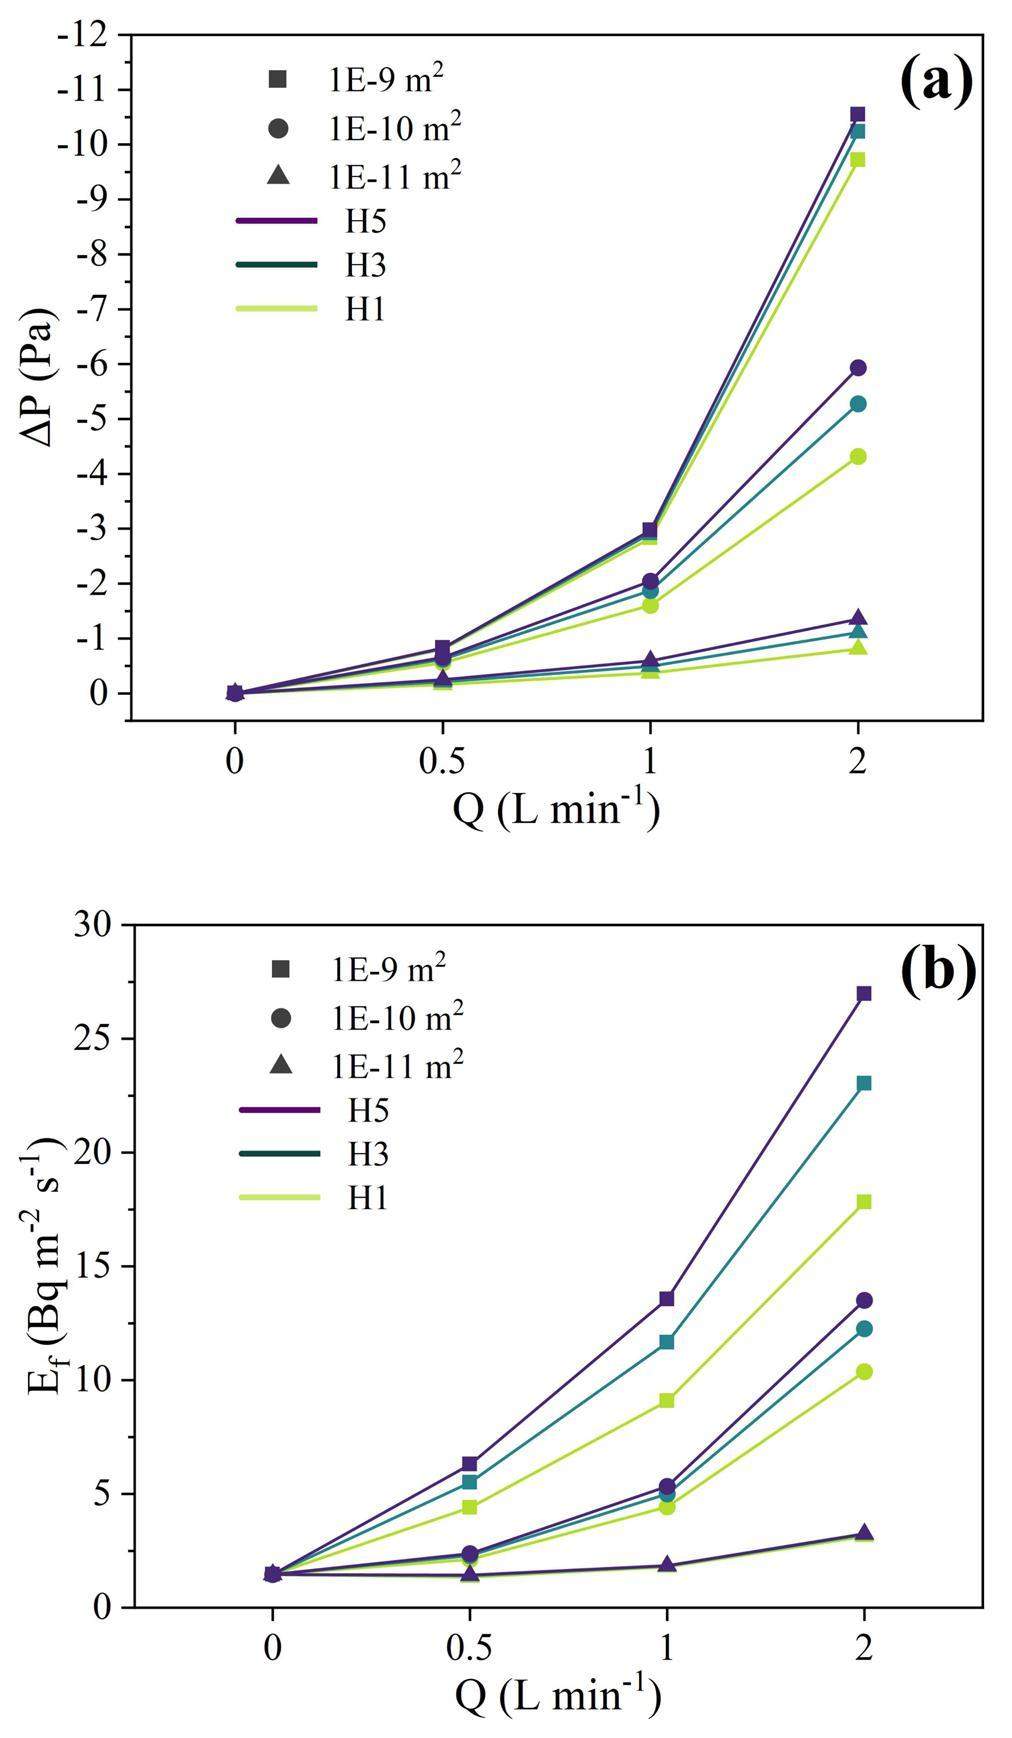
Furthermore, the correlations between the flow rate and negative pressure in the chamber and Ef-exp were obtained based on simulations, as shown in Figs. 12a and b, respectively, indicating positive relationships. At a high flow rate of 2 L min-1, the negative pressure difference (Δ P) for a permeability of 1×10⁻⁹ m2 increased by 779.4% (H5) and 1202.67% (H1) when compared to that at a permeability of 1×10-11 m2. At a medium flow rate of 1 L min-1, Δ P increased by 500.16% (H5) and 767.31% (H1) but increased by 332.92% (H5) and 495.74% (H1) at a low flow rate of 0.5 L min-1. A comparable trend in the radon exhalation rate is shown in Fig. 12. At 2 L min-1, Ef-exp at a permeability of 1×10⁻⁹ m2 increased by 640.99% (H1) and 1353.92% (H5) compared to that at a permeability of 1×10-11 m2. It increased by 229.44% (H1) and 699.46% (H5) at 1 L min-1, whereas it increased by 251.70% (H1) and 335.21% (H5) at 0.5 L min-1. Similarly, when the flow rate increased from 0.5 to 2 L min-1 (H1), Ef-exp increased by 135.66% and 345.49% at permeabilities of 1×10-11 and 1×10⁻⁹ m2, respectively. Clearly, permeability, flow rate, and negative differential pressure profoundly influence the radon exhalation rate.
The linear and nonlinear relationships between the negative pressure difference and the variables, that is, the insertion depth, permeability, and flow rate, can be represented using multivariate functions, as described by Eqs. (29) (R2=0.696) and (30) (R2=0.978):
Similarly, the nonlinear relationships of Ef-exp with the insertion depth, permeability, and flow rate can be expressed using multivariate functions, as described by Eqs. (31) (R2=0.93) and (32) (R2=0.983):
In the simulation with a permeability of 1×10-11 m2, Ef-exp decreased with increasing insertion depth, whereas for 1×10⁻⁹ m2, the correlation was positive. Interestingly, in the case of 1×10⁻¹⁰ m2, Ef-exp initially increased with increasing insertion depth before decreasing. This nuanced behavior was controlled by the terms
Both the simulation and experimental results suggest consistent trends in the variations in the radon exhalation rates and negative pressure differences under certain insertion depths and flow rates. Deeper insertion of the chamber resulted in a significant increase in the negative pressure difference at a high flow rate of 2 L min-1. This amplification of the negative pressure difference subsequently increased the radon exhalation rate. Therefore, the numerical method demonstrated reliability in revealing trends in the radon exhalation rates measured in the field.
Analysis of the variation in -λe
In Eq. (6), the term -λe can be interpreted as the radon dissipation inside the accumulation chamber, including radon decay, back-diffusion, and leakage. By applying an exponential fit to Eq. (7), the value of
| Insertion depth | Permeability (m2) | λe (s-1) | ||
|---|---|---|---|---|
| 0.5 L min-1 | 1 L min-1 | 2 L min-1 | ||
| H1 | 10×10-11 | 3.97×10⁻⁵ | -7.48×10⁻⁴ | -4.09×10⁻³ |
| 10×10-10 | -3.84×10⁻⁴ | -1.79×10⁻³ | -4.66×10⁻³ | |
| 10×10-9 | -6.48×10⁻⁴ | -1.59×10⁻³ | -3.40×10⁻³ | |
| H3 | 10×10-11 | -1.14×10⁻⁴ | -9.47×10⁻⁴ | -4.48×10⁻³ |
| 10×10-10 | -5.42×10⁻⁴ | -1.97×10⁻³ | -4.39×10⁻³ | |
| 10×10-9 | -7.61×10⁻⁴ | -1.48×10⁻³ | -2.53×10⁻³ | |
| H5 | 10×10-11 | -2.14×10⁻⁴ | -1.13×10⁻³ | -5.00 e-3 |
| 10×10-10 | -6.78×10⁻⁴ | -2.21×10⁻³ | -4.42×10⁻³ | |
| 10×10-9 | -8.84×10⁻⁴ | -1.46×10⁻³ | -1.86×10⁻³ | |
In most numerical simulations (except for H1, which involved a permeability of 10-11 m2 and a flow rate of 0.5 1×10-11 m2), a positive value of -λe indicated the reverse process of radon dissipation, in which more radon flowed in and accumulated inside the chamber. In this process, the back-diffusion effect increases with the accumulation of high radon concentration in the chamber, reducing the increase in -λe. Specifically, by increasing the permeability from 10-11 to 10-9 m2 with an insertion depth of H5, λe increased by 413.13% at 0.5 L min-1 and by 37.01% at 2 L min-1. When the flow rate increased from 0.5 to 2 L min-1 with an insertion depth of H5, λe increased by 2347.43% for 10-11 m2 and by 210.26% for 10-9 m2. These data indicate that the term -λe had a positive value, and a higher permeability or flow rate caused a higher radon concentration in the chamber, as well as a nonnegligible back-diffusion effect at the porous medium-air interface, inhibiting the increase in λe.
Conclusion
To explore the phenomenon of the considerably higher radon exhalation rate measured in field experiments using the flow-through method than the closed-loop method, a three-dimensional geometric model was established, and CFD techniques were employed to numerically simulate the radon transport and exhalation patterns in the accumulation chamber and porous medium under certain conditions of permeability, flow rate, and chamber insertion depth. The impacts of these factors on the radon exhalation rate were quantitatively analyzed and compared. The conclusions are as follows.
The radon exhalation rate measured in the same chamber in the field using the flow-through method was higher than that measured using the closed-loop method. The difference in the values between the two methods increased with the flow rate, which can be explained by the increase in the negative pressure difference between the inside and outside of the chamber caused by the variation in the flow rate.
The trend of the radon exhalation rate in the simulations, subject to variations in the flow rate and chamber insertion depth, was consistent with that of the field measurements. Using the simulations of the flow-through measurements, the evolution of the diffusive, convective, and total transient radon exhalation rates was obtained. The variation in the total radon exhalation rate with the flow rate was closely related to the convective radon exhalation rate induced by the negative pressure difference. In addition, applying a linear fit to the radon exhalation rates in flow-through measurements was not feasible because of the short time required for the radon concentration to stabilize. Additionally, the term -λe in Eq. (6) could not be ignored when calculating the radon exhalation rate as a function of the saturated radon concentration during flow-through measurements, as λe could reach a positive value, which suggests that more radon flowed into the chamber because of the negative pressure difference in the direction opposite to that of leakage in the chamber during closed-loop measurements.
Multivariate linear and nonlinear regression models were established for the fitted radon exhalation rate and negative pressure difference between the inside and outside of the chamber. Specifically, the negative pressure difference and fitted radon exhalation rates were positively correlated with the variation in permeability and flow rate, whereas the correlation with the insertion depth of the chamber depended on permeability. A negative correlation between the radon exhalation rate and the insertion depth was observed at a permeability of 1×10-11 m2, whereas a positive correlation was observed for 1×10⁻⁹ m2. At a medium permeability of 1×10⁻¹⁰ m2, the radon exhalation rate first increased and then decreased with increasing insertion depth. The better nonlinear fit than the linear fit was due to the synergistic effect of the insertion depth, permeability, and flow rate on the negative pressure difference, as well as the radon exhalation rate.
Study on migration of radon in geologic environment by SSNTD
. Nucl. Sci. Tech. 7, 52-53 (1996).Calculation and measurement of migration coefficient of radon under laboratory conditions
. Nucl. Sci. Tech. 17, 92-96 (2006). https://doi.org/10.1016/S1001-8042(06)60019-5Dynamic evolution characteristics of mining-induced fractures in overlying strata detected by radon
. Nucl. Sci. Tech. 22, 334-337 (2011). https://doi.org/10.13538/j.1001-8042/nst.22.334-337Evaluation of correlation between Pm2.5 and radon-progeny equilibrium factor in radon chamber
. Nucl. Sci. Tech. 29, 151 (2018). https://doi.org/10.1007/s41365-018-0481-2Rapid determination of radon monitor’s calibration factors
. Nucl. Sci. Tech. 27, 116 (2016). https://doi.org/10.1007/s41365-016-0118-2Simulation study of energy resolution with changing pixel size for radon monitor based on Topmetal-II- TPC
. Nucl. Sci. Tech. 30, 16 (2019). https://doi.org/10.1007/s41365-018-0532-8Natural radioactivity, radon exhalation rate and radiation dose of fly ash used as building materials in Xiangyang, China
. Indoor Built Environ. 25, 626-634 (2016). https://doi.org/10.1177/1420326X15573276Evaluation of the radon contribution rate in apartments through evaluation of the radon exhalation rate from building materials
. J. Environ. Health Sci. 47, 425-431 (2021). https://doi.org/10.5668/JEHS.2021.47.5.425Applicability of the closed-circuit accumulation chamber technique to measure radon surface exhalation rate under laboratory conditions
. Radiat. Meas. 133, 106284 (2020). https://doi.org/10.1016/j.radmeas.2020.106284Standard measurement procedure for soil radon exhalation rate and its uncertainty
. J. Radiat. Prot. Res. 43, 29-38 (2018). https://doi.org/10.14407/jrpr.2018.43.1.29Accurate measurement of the radon exhalation rate of building materials using the closed chamber method
. J. Radiol. Prot. 32, 315-323 (2012). https://doi.org/10.1088/0952-4746/32/3/315Experimental study of radon exhalation rate in uranium-like rock based on closed chamber method
. Proceedings of the 2018 26th International Conference on Nuclear Engineering. Volume 4: Nuclear Safety, Security, and Cyber Security; Computer Code Verification and Validation (A method to simultaneously and continuously measure the 222Rn and 220Rn exhalation rates of soil in an open loop
. Isot. Environ. Healt. S. 50, 531-537 (2014). https://doi.org/10.1080/10256016.2014.916705Comparison of radon exhalation rate measurements on reference device in open and closed loop by AlphaGUARD in flow-through mode
. Radiat. Prot. Dosim. 199, 1151-1157 (2023). https://doi.org/10.1093/rpd/ncad063Determination of radon exhalation rates from soil around buildings in Lagos environments using passive measurement technique
. J. Environ. Health Sci. Eng. 18, 129-135 (2020). https://doi.org/10.1007/s40201-020-00446-3Determination of radon exhalation rates in soil samples using sealed can technique and CR-39 detectors
. Journal of environmental health science and engineering. 16, 121-128 (2018). https://doi.org/10.1007/s40201-018-0298-2Evaluation and measurement methods for the surface radon exhalation rate of buildings
. Indoor Built Environ. 31, 2378-2385 (2022). https://doi.org/10.1177/1420326X221109754Study on a new charcoal closed chamber method for measuring radon exhalation rate of building materials
. Radiat. Meas. 134, 106308 (2020). https://doi.org/10.1016/j.radmeas.2020.106308Influence of the accumulation chamber insertion depth to measure surface radon exhalation rates
. J. Hazard. Mater. 393, 122344 (2020). https://doi.org/10.1016/j.jhazmat.2020.122344Characterization of Commercially Available Active-Type Radon–Thoron Monitors at Different Sampling Flow Rates
. Atmosphere-Basel. 12, 971 (2021). https://doi.org/10.3390/atmos12080971Study on the influence of sampling methods for measuring soil radon exhalation rates
. Radiat. Meas. 159, 106880 (2022). https://doi.org/10.1016/j.radmeas.2022.106880Influence of sampling flow rate on thoron exhalation rate measurements by the circulation method
. Radiat. Prot. Dosim. 198, 904-908 (2022). https://doi.org/10.1093/rpd/ncac004Optimizing laboratory-based radon flux measurements for sediments
. J. Environ. Radioactiv. 158-159, 47-55 (2016). https://doi.org/10.1016/j.jenvrad.2016.03.023Numerical simulation of 222Rn profiling in an experimental chamber using CFD technique
. J. Environ. Radioactiv. 220-221, 106298 (2020). https://doi.org/10.1016/j.jenvrad.2020.106298CFD Simulation and Experimental Measurements of Radon Distribution in a Traditional Hammam
. International Journal of Heat and Technology. 39, 963-968 (2021). https://doi.org/10.18280/ijht.390333An on-site measurement coupled CFD based approach for wind resource assessment over complex terrains
, 2018 IEEE International Instrumentation and Measurement Technology Conference (I2MTC)(A universal laboratory method for determining physical parameters of radon migration in dry granulated porous media
. J. Environ. Radioactiv. 177, 135-141 (2017). https://doi.org/10.1016/j.jenvrad.2017.06.012CHAPTER 2 Uncertainty propagation
, in Analytical Evaluation of Uncertainty Propagation for Probabilistic Design Optimisation.CFD simulation of an industrial steam methane reformer: Effect of burner fuel distribution on hydrogen production
. Fuel 352, 129008 (2023). https://doi.org/10.1016/j.fuel.2023.129008A CFD study with analytical and experimental validation of laminar and turbulent mass-transfer in electrochemical reactors
. J. Electrochem. Soc. 165, E81-E88 (2018). https://doi.org/10.1149/2.0971802jesRadioactivity in the environment around past radium and uranium mining sites of Portugal
. J. Environ. Radioactiv. 96, 39-46 (2007). https://doi.org/10.1016/j.jenvrad.2007.01.016A soil freezing-thawing model based on thermodynamics
. Cold Reg. Sci. Technol. 211, 103867 (2023). https://doi.org/10.1016/j.coldregions.2023.103867Simultaneous determination of the radon diffusion coefficient and the free radon production rate from compact porous emanation media
. Build. Environ. 144, 66-71 (2018). https://doi.org/10.1016/j.buildenv.2018.08.015Experimental study of the effect of seepage on radon exhalation in circular tubular porous emanation media
. Indoor Built Environ. 29, 701-710 (2020). https://doi.org/10.1177/1420326X19861781Experimental study on permeability characteristics and radon exhalation law of overburden soil in uranium tailings pond
. Environ. Sci. Pollut. R. 28, 15248-15258 (2021). https://doi.org/10.1007/s11356-020-11758-0The authors declare that they have no competing interests.

