Introduction
In the past few decades, γ-photon beams have been steadily developed with optimized beam properties that can be used for research and applications. Past and future developments in photon sources can generally be divided into five generations [1]. The first generation of photon sources utilizes various artificially induced γ radioactivity of various excited nuclei, such as 137Cs, 60Co, 27Al (p, γ) 28Si and so on. These sources are primarily used for detector calibration and irradiation experiments. The energy of this photon source is fixed.
The second-generation MeV range photon sources are generated using bremsstrahlung or positron annihilation. Electron bremsstrahlung is a simple method for producing a strong photon bath with a continuous energy distribution. Currently, the energy spectra of bremsstrahlung photons are typically calculated by using Monte Carlo simulation codes [2-4]. The main difficulty is in extracting the bremsstrahlung flux close to the end energy of the spectrum. The energy of the electron beam and its fluctuations play a decisive role. Therefore, careful monitoring of the electron beam energy is mandatory for many experiments. The bremsstrahlung γ-photon source adjusts the maximum gamma energy by altering the incident electron energy. It provides either broadband γ-photons or low-intensity beams with some energy resolution through electron energy tagging. These sources have significantly expanded the field of photonuclear science.
The Darmstadt High-Intensity Photon Setup (DHIPS) uses a continuous-wave electron beam to generate photon beams, typically with maximum energies of up to 10 MeV and currents of up to 60 μA [5]. The γELBE facilities use superconducting continuous electron linear accelerators with a current of up to 1 mA and a maximum energy of 13 MeV to produce a bremsstrahlung beam [3]. At the Flerov Laboratory of Nuclear Reactions of the Joint Institute for Nuclear Research in Dubna, Russia, the Bremsstrahlung facility of the MT-25 microtron delivers an electron beam in the energy range of 10–25 MeV with an average electron current of up to 20 μA [6]. The recently installed S-band accelerator PRISM at the Lawrence Livermore National Laboratory (LLNL), USA, operates with an electron energy between 15 and 25 MeV and currents up to 30 μA [7]. At the High-Voltage Research Laboratory (HVRL) of the Massachusetts Institute of Technology (MIT), an electron accelerator with an energy of up to approximately 3.5 MeV and currents in the 100 μA range can be used for Nuclear Resonance Fluorescence experiments [8]. The NSC KIPT in Kharkov, Ukraine operates an S-band e-linac (LUE-40) that can be used for photoactivation experiments in the energy range of approximately 35–95 MeV, with a typical average electron current of 6 μA [9]. At the Idaho State University, USA, four e-linacs with maximum electron energies of up to 40 MeV were utilized to generate a bremsstrahlung beam [10]. The maximum electron current was between 85 and 240 μA.
Owing to the provision of information about the energy of bremsstrahlung photons generated by the tagged photon technique, the photon nuclear reaction caused by bremsstrahlung photons can determine the energy-resolved reaction cross-sections. The photon tagger NEPTUN at S-DALINAC at TU Darmstadt covers photon energies from below the particle emission threshold to above the IVGDR region for photon scattering and total photoabsorption experiments, which determine the complete dipole strength [11].
Currently, the most common sources are third-generation sources, which scatter electrons in synchrotrons or storage rings using the principle of laser Compton backscattering. The high-intensity γ-Ray Source (HIγS) facility is the most productive example in the past [12, 13]. It is operated by the Triangle Universities Nuclear Laboratory at Duke University and can provide nearly monoenergetic polarized gamma-ray beams with an energy range of 1–100 MeV and a maximum total intensity of approximately 3×10¹⁰ photons/s near 10 MeV. The maximum gamma-ray energy of the laser Compton scattering gamma-ray source in the UVSOR-III storage ring was 5403 keV, and the total available flux was 1 × 10⁷ photons/s, which is sufficient for basic research on nondestructive three-dimensional isotopes [14]
Compared with existing facilities, new Laser Compton Backscattering (LCB) facilities with further improved parameters will be put into operation in the coming years. As an example, the Variable-Energy Gamma-ray system (VEGA) at the International Research Center Extreme Light Infrastructure-Nuclear Physics (ELI-NP) in Romania is briefly introduced. The energy range of the generated photon beam can be continuously varied between 1 and 20 MeV by selecting one of the two interacting lasers and adjusting the electron energy in the storage ring accordingly. A small electron beam emittance in Compton-backscattered laser photons produces a bandwidth of approximately 0.5% or even less. The total photon flux was greater than 1011 photons per second, and the time-averaged spectral intensity of the collimation at the maximum position was greater than 5×10³ photons per second and eV [1].
There are two main methods to increase the beam intensity in a fourth-generation gamma source. One method for achieving a higher intensity is based on the multibunch multipulse concept proposed by Barty et al., where a laser beam collides with an electron microbeam with a small temporal spacing [1]. Another method is superconducting radio-frequency (SRF) and superconducting multiturn energy-recovery linac (ERL). The international ERL community recently published a corresponding superconducting multiturn energy-recovery linac conceptual design report [15]. An SRF-ERL generates a continuous electron beam with extremely low emittance and very high current, which can generate LCB photon beams with a further reduced bandwidth (down to the per mille range) and higher intensity.
The relatively small cross-section of Compton scattering in the barn range limits the maximum photon flux that can be obtained from laser Compton backscattering devices. A few years ago, a principle was proposed to overcome this limitation, which is currently known as the fifth generation gamma source of the “Gamma Factory at CERN" [16, 17]. The idea is to use a partially stripped ultrarelativistic ion beam that undergoes atomic transitions after the resonant absorption of laser photons. Because the energy of the emitted photons is boosted by one factor, up to four times the square of the Lorentz factor of the particle beam, the energy range of the tunable photon beam at LHC is approximately 1-400 MeV. Compared to the laser Compton scattering on point-like electrons, the cross section of the laser photon absorption is much larger (within the Gbarn range), thus achieving an unprecedented γ beam intensity. Many possible applications were discussed, such as those in [18, 19].
SLEGS, which is a new LCS gamma source with a 3.5 GeV storage ring running a 200-mA electron beam current in the top-up injection mode, is one of the Phase II beamlines at the Shanghai Synchrotron Radiation Facility (SSRF) [20-28].
Photon-induced nuclear reactions with energies higher than the particle binding energy can provide information on the electromagnetic decay strength of the giant dipole resonance (GDR) with multipole selectivity and the coupling of the GDR to low-frequency collective modes [29-32]. The Pygmy Dipole Resonance (PDR) can be used to understand the entire E1 response of nuclei and the nuclear symmetry energy in the equation of state (EOS) for nuclear matter [33, 34]. Magnetic dipole resonance (MDR) above the neutron threshold, with PDR around the neutron threshold, constitutes the additional strength of the low-energy γ-ray strength function [35, 36]. Dedicated to GDR, PDR, and MDR measurements, the construction of SLEGS was completed in December 2021, and it was opened to users since September 2023 [37]. After experts in SSRF review, the first users from domestic universities and research institutes successively conduct experimental research on photonuclear reactions and photon activation analysis(PAA). In this study, we present a review of the facilities and experimental methods of the SLEGS beamline.
The Beamline
The gamma source
The main SLEGS beamline components that generate γ-rays include an interaction chamber, a multifunction chamber, and a CO2 laser [38]. Through the multi-function chamber, the laser generates back-scattered gamma rays with an energy of 21.7 MeV. In slant scattering mode, through the interaction chamber, the laser can produce γ-rays with a Compton-scattering energy range from 0.66 to 21.1 MeV, by adjusting the scattering angle from 20 to 160°. The gamma energy is continuously adjustable by changing the scattering angle between the laser and the electron.
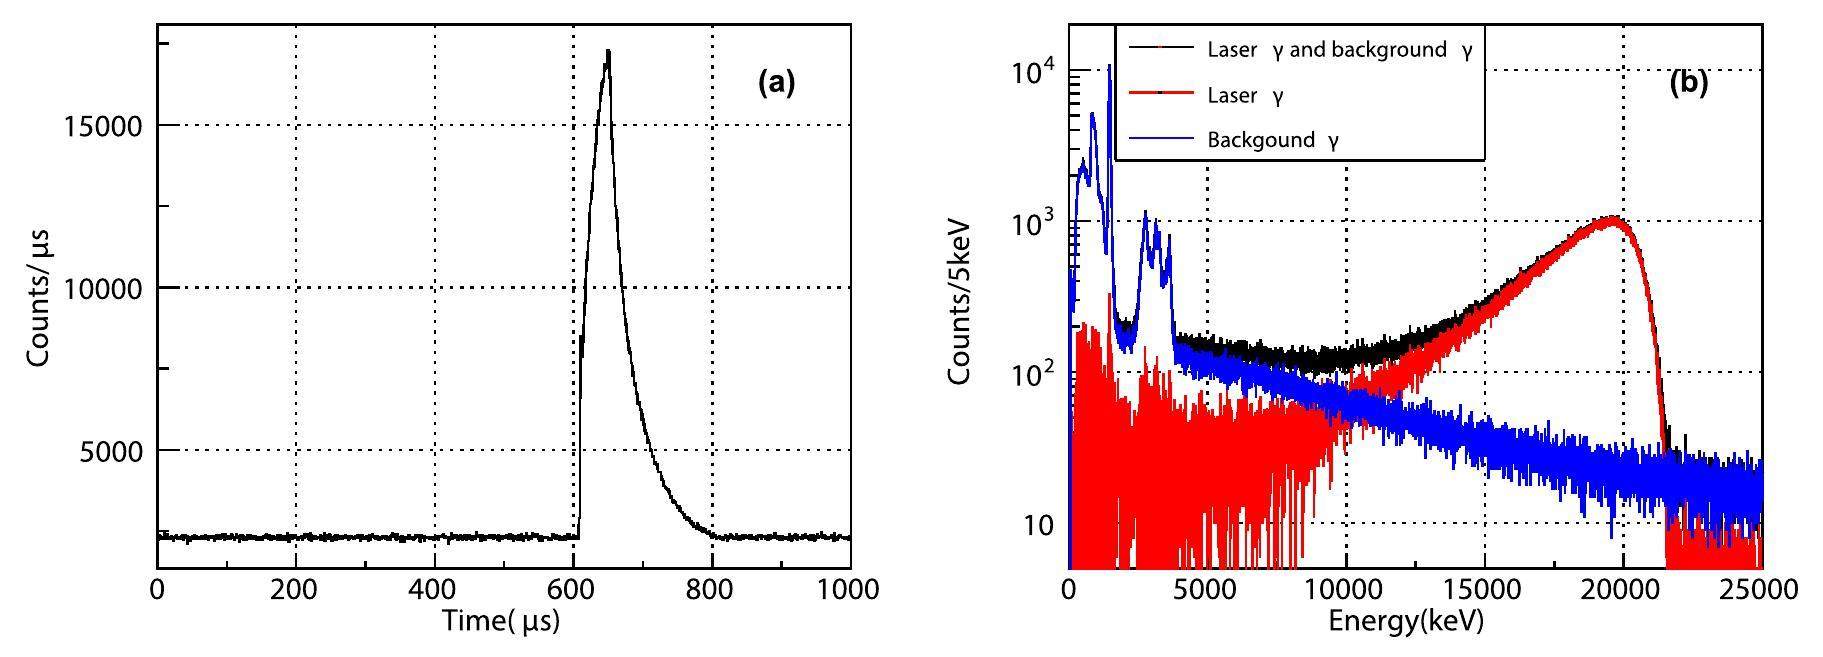
The frequency of the SLEGS gamma source was determined by a laser frequency 1 kHz. Therefore, the time distribution of the laser gamma rays within a millisecond time cycle can be obtained by utilizing the time of gamma events, as shown in Fig. 1 (a). This is consistent with the laser distribution within the clock cycle. Laser gamma events and background gamma events can be distinguished based on the time distribution. By using this method, the background events in the laser gamma rays can be deduced to obtain the energy spectrum distribution of the laser gamma rays, as shown by the red line in Fig. 1 (b). This method can reduce the measurement time of the experiment and improve the utilization of beam time. All spectrometers at the experimental station can also use this method to deduce the background.
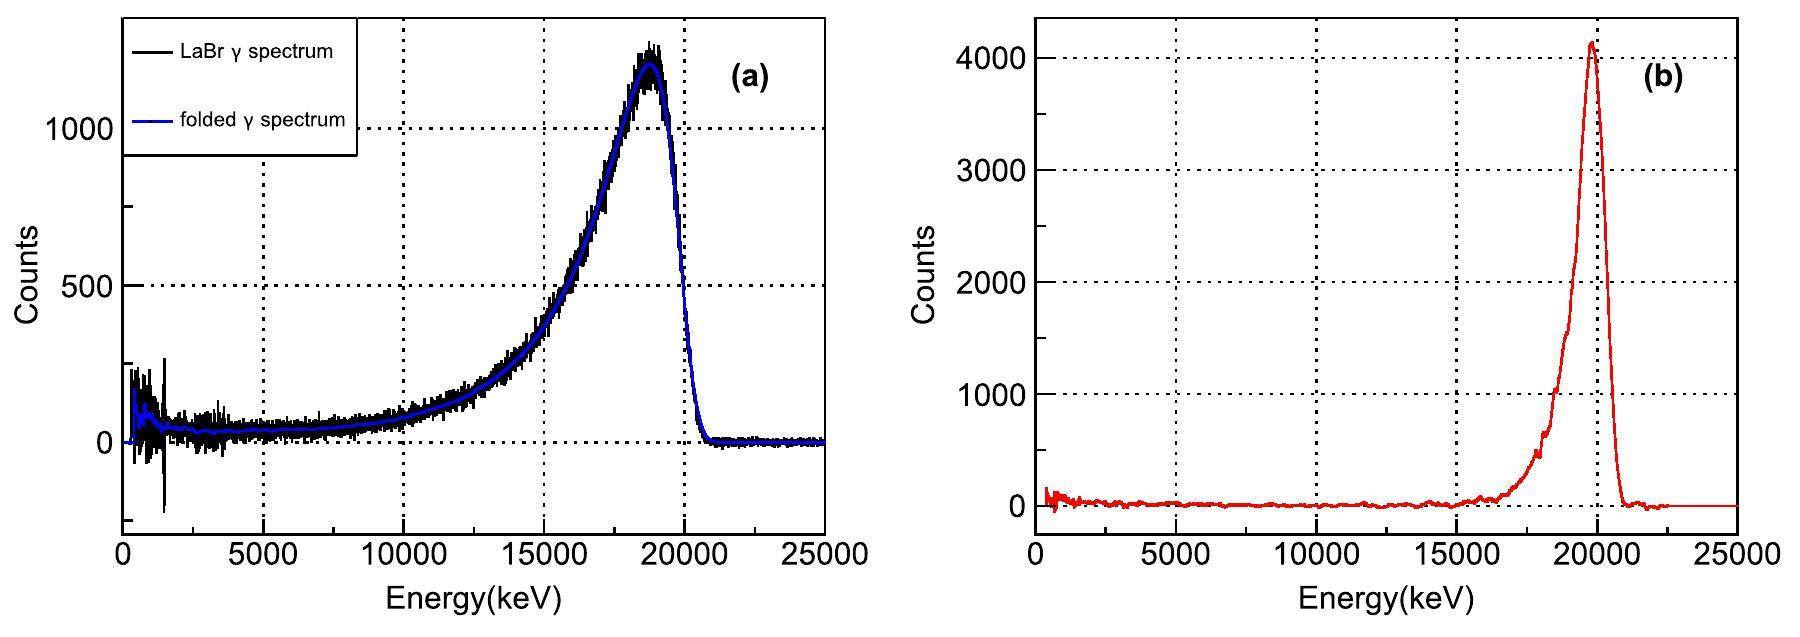
To successfully conduct experiments at the station, it is necessary to accurately obtain the gamma spectrum distribution of each laser angle; therefore, measuring the gamma spectrum is very important. Monoenergetic gamma sources of 6.13, 9.17, 10.76, and 17.6 MeV were obtained by bombarding 19F, 13C, 27Al, and 7Li targets with proton sources from the Chinese Institute of Atomic Energy to calibrate the LaBr3 detector, which was used for gamma spectrum [49-52]. The response of single-energy gamma rays in the LaBr3 detector was simulated using Geant4 software [53] and compared with the calibration data. They showed good agreement between the detection efficiency and energy deposition spectrum distribution. By simulating the response function of single-energy γ-rays in LaBr3 detector, the response matrix of LaBr3 detector to the γ-rays can be obtained. Using the response matrix, we developed software for inverse-solving laser gamma spectroscopy based on Bayesian theory [54].
The black line in Fig. 2 (a) represents the gamma spectrum of LaBr3 measured at a laser angle of 145°, whereas the blue line represents the result of the inverse-solved gamma spectrum folding of the response matrix. Their good agreement indicated that the inverse-solved gamma spectrum was reliable. The inverse-solved gamma spectra obtained using this software are shown in Fig. 2 (b) and the FWHM was 4.6%.
Collimaters and Attenuator
The coarse collimator was located 18 m away from the laser electron collision point and had ten different sizes of apertures, namely 0-5, 8, 10, 20, and 30 mm. The fine collimator was 36 m from the collision point and its aperture could be continuously changed between 0 and 40 mm [39]. The attenuator was composed of eight copper blocks of different thicknesses (1×200 mm, 3×100 mm, 2×50 mm, 1×25 mm, and 1×15 mm) and a diameter of 50 mm. The coarse and fine collimators jointly adjust the energy bandwidth and spot size of the gamma beam, whereas the attenuator adjusts the beam flux to satisfy the requirements of nuclear physics, irradiation experiments, and detector calibration.
Experimental station
Three types of detectors were used at the experimental station: gamma detectors, neutron detectors, and charged particle detectors. The gamma detectors consisted of two HPGe detectors with a diameter of 80 mm and a thickness of 90 mm, two CLOVER detectors composed of four crystals with a diameter of 50 mm and a thickness of 70 mm [40], eight LaBr3 detectors with a diameter of 76.2 mm and a thickness of 101.6 mm, and one BGO detector with a diameter of 76.2 mm and a thickness of 200 mm as the beam monitor detector. The energy spectrum and flux of the beam were mainly measured using BGO and LaBr3 detectors. There were 20 EJ-301 fast neutron detectors with a diameter of 127 mm and a thickness of 50.8 mm, six 3He tubes with a diameter of 25.4 mm and an effective length of 500 mm, and 20 3He tubes with a diameter of 50.8 mm and an effective length of 500 mm. The pressure values of all 3He tubes were 2 atmospheres. The charged particle detectors included six Frisch-grated ionization chambers (FGIC) with a height of 72 mm and thickness of 64 mm, four 65 μm, two 100 μm-thick single-sided silicon microstrip detectors, four 300 μm and two 500 μm double-sided silicon microstrip detectors, and six sets of sensitive area 64 mm × 64 mm cesium iodide arrays with a thickness of 20 mm. These charged-particle detectors were combined to form a charged-particle telescope system to identify light-charged particles, such as p, d, t, 3He, and α.
The experimental station had a vacuum chamber with a diameter of 1000 mm and a height of 800 mm. Its static vacuum can reach 10-6 millibars and its leakage rate was less than 1×10-11 Pa⋅m3/s.
Electronics and Data-acquisition system
The data acquisition system of the SLEGS experimental station mainly consisted of two types: the CoMPASS waveform digital data acquisition system [41] and the MVME of the Mesytec waveform digital data acquisition system [42]. Based on different detector signals, each type of acquisition system has two different acquisition modes. The CoMPASS data acquisition system has Pulse Shape Discrimination (PSD) and Pulse Height Analysis (PHA) modes, whereas the MVME of Mesytec data acquisition system has a charge-to-digital converter (QDC) and standard charge-sensitive Preamplifier (SCP) modes. The PSD and QDC modes correspond to several hundred nanosecond pulse signals output by photomultiplier tubes, and the PHA and SCP modes correspond to several tens of microseconds of signal output by preamplifiers. The CoMPASS data acquisition system consisted of six V1725s digitizers with a sampling frequency of 250 MHz and eight V1730s digitizers with a sampling frequency of 500 MHz. The Mesytec data acquisition system consists of 4 MDPP-16 digitizers and one MDPP-32 digitizer.
The acquisition control interface of the CoMPASS data-acquisition system mainly consists of five parts. The first part is the Run ID, where the user can set the name of the saved file and choose whether to add the serial number of the file automatically. The second part describes the acquisition settings, which were used to set the acquisition mode. There are two options: list-only mode, which does not save the waveform, and wave mode, which does. The acquisition time can be set and the configuration file can be selected. The third is board buffer saving, which allows the user to choose whether to save data on the board, mainly for offline data processing. The fourth part is the data-saving setting (list-saving). Users can choose to save raw, unfiltered, or filtered data. The format for saving data is generally ROOT, and users can choose to limit the file size. The user can choose one file for each channel or one file for all channels and choose whether to sort the events. The energy format can be an ADC, scale value, or both. The fifth part is spectra saving settings. The user can choose to save the spectrum at the end of the acquisition, save the spectrum for a certain period, or not save it. The user can select the data format for saving spectra and opt to save one or more of the following four types: energy, PSD, time distribution, and Δ T.
The main parameters of the CoMPASS acquisition system include polarity, discrimination mode, QDC gate, short gate, and pre-gate in PSD mode, rise time, flat top, and pole zero in PHA mode. The EJ-301 neutron detector achieved a time resolution of 230 ps using constant fraction discrimination (CFD), whereas the LaBr3 detector achieved a time resolution of 690 ps.
The control interface of the data-acquisition system, Mesytec, comprises four main parts. The first part is the data acquisition control interface, whose main functions are to start or stop data acquisition, set the connection mode with the data acquisition electronics, select whether to record data, set the time for data acquisition, set the name of the file for data recording, and select whether the file for recording the data is divided by the time period or file size. The second part is the VME electronic parameter configuration interface, whose main function is to set the waveform digitizers used for acquisition, their addresses to be consistent with the hardware settings, the firmware mode to be consistent with the hardware settings, and the integration and differential times for signal time filtering, shaping time, rise time, decay time, etc. The third part is the data analysis interface, whose main function is to select the data source to be analyzed, perform the necessary logical operations, and generate visualized one-dimensional or two-dimensional histograms. The fourth part is the log interface, which mainly outputs information during data acquisition operations, such as the time when the acquisition started, the configured electronic parameters, and the time when acquisition stopped, etc. If an error occurs during the configuration or acquisition process, it is displayed in red text on this interface, and the reason for the error can be found in this information.
Experimental spectrometers
Detailed knowledge of photonuclear reaction data is of great significance for various applications such as astrophysical applications, medical isotope production and radiation-shielding design, nuclear-waste transmutation, safeguards and inspection technologies, physics and technology of fission reactors (the influence of photonuclear reactions on the neutron balance), fusion reactors (plasma diagnostics and shielding-activation calculations), and analyses of absorbed doses in the human body during radiotherapy and radiation-transport calculations. According to the products detected in the photonuclear experiment, the experiment can be divided into five types.
Nuclear Resonance Fluorescence (NRF) spectrometer
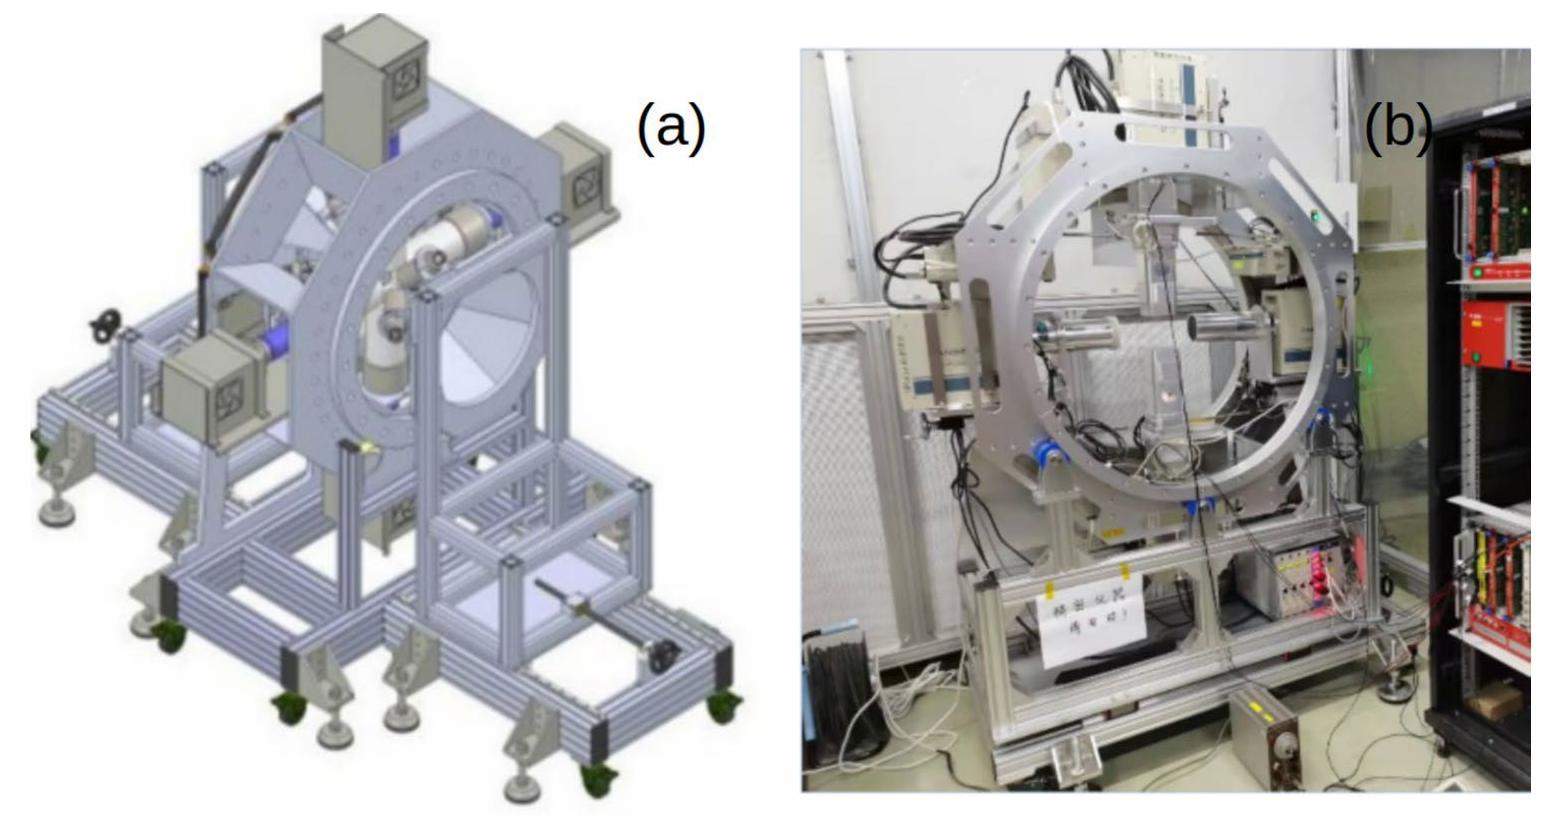
An NRF spectrometer is a nuclear resonance fluorescence experiment limited to below the neutron threshold that only detects gamma rays generated in the reaction. The NRF spectrometer measures the energy and angular distribution of the de-excited gamma rays generated in nuclear reactions using coincidence to determine the energy-level states of the nuclei. The spectrometer mainly consists of two HPGe detectors and two CLOVER detectors, with eight signal outputs through pre-amplifiers. Therefore, the data acquisition system of the spectrometer used Mesytec’s SCP mode. Figure 3 shows a 3D model and a picture of the nuclear resonance fluorescence spectrometer. The distance between the front surface of these detectors and the beam center was adjusted from 10 to 80 mm. To facilitate the polarization measurement, the positions of the detectors were rotated along the beam axis. In addition, other gamma detectors, such as LaBr3 can also be added to the NRF spectrometer to improve the detection efficiency [43].
Nuclear resonance fluorescence can be applied to non-intrusively interrogate a region of space and measure the isotopic content of materials in that space to identify elements heavier than helium. The prospect of NRF as a non-destructive analysis (NDA) technique in safety applications lies in its potential for directly quantifying specific isotopes in target analysis. This technology involves irradiating materials with intense photon beams and detecting the scattered photons using isotope-specific discrete energy distributions. Interrogating photons with energies between 2 and 8 MeV are the most penetrating probes and are effective when the isotopes of interest are shielded by steel or other materials.
Research based on NRF uses two detection schemes: scattering and transmission methods. In both methods, interrogation photons are used to induce resonance absorption, whereas de-excited photons are detected directly in the backward scattering position or indirectly in the forward self-absorption position. The investigated object was placed in the beam, and resonant photons were detected in the backward scattering position by detectors located off-beam during the scattering experiments.
It is worth mentioning that NRF-NDA technology can be used in other applications that require isotope identification. For instance, some have suggested applying this technology to cultural heritage research. The penetrability of γ enables the study of bulk objects, complex archaeological artifacts, and artwork. With an increase in beam intensity, these NDA methods will be further developed.
Flat-Efficiency Neutron Detector (FED) spectrometer
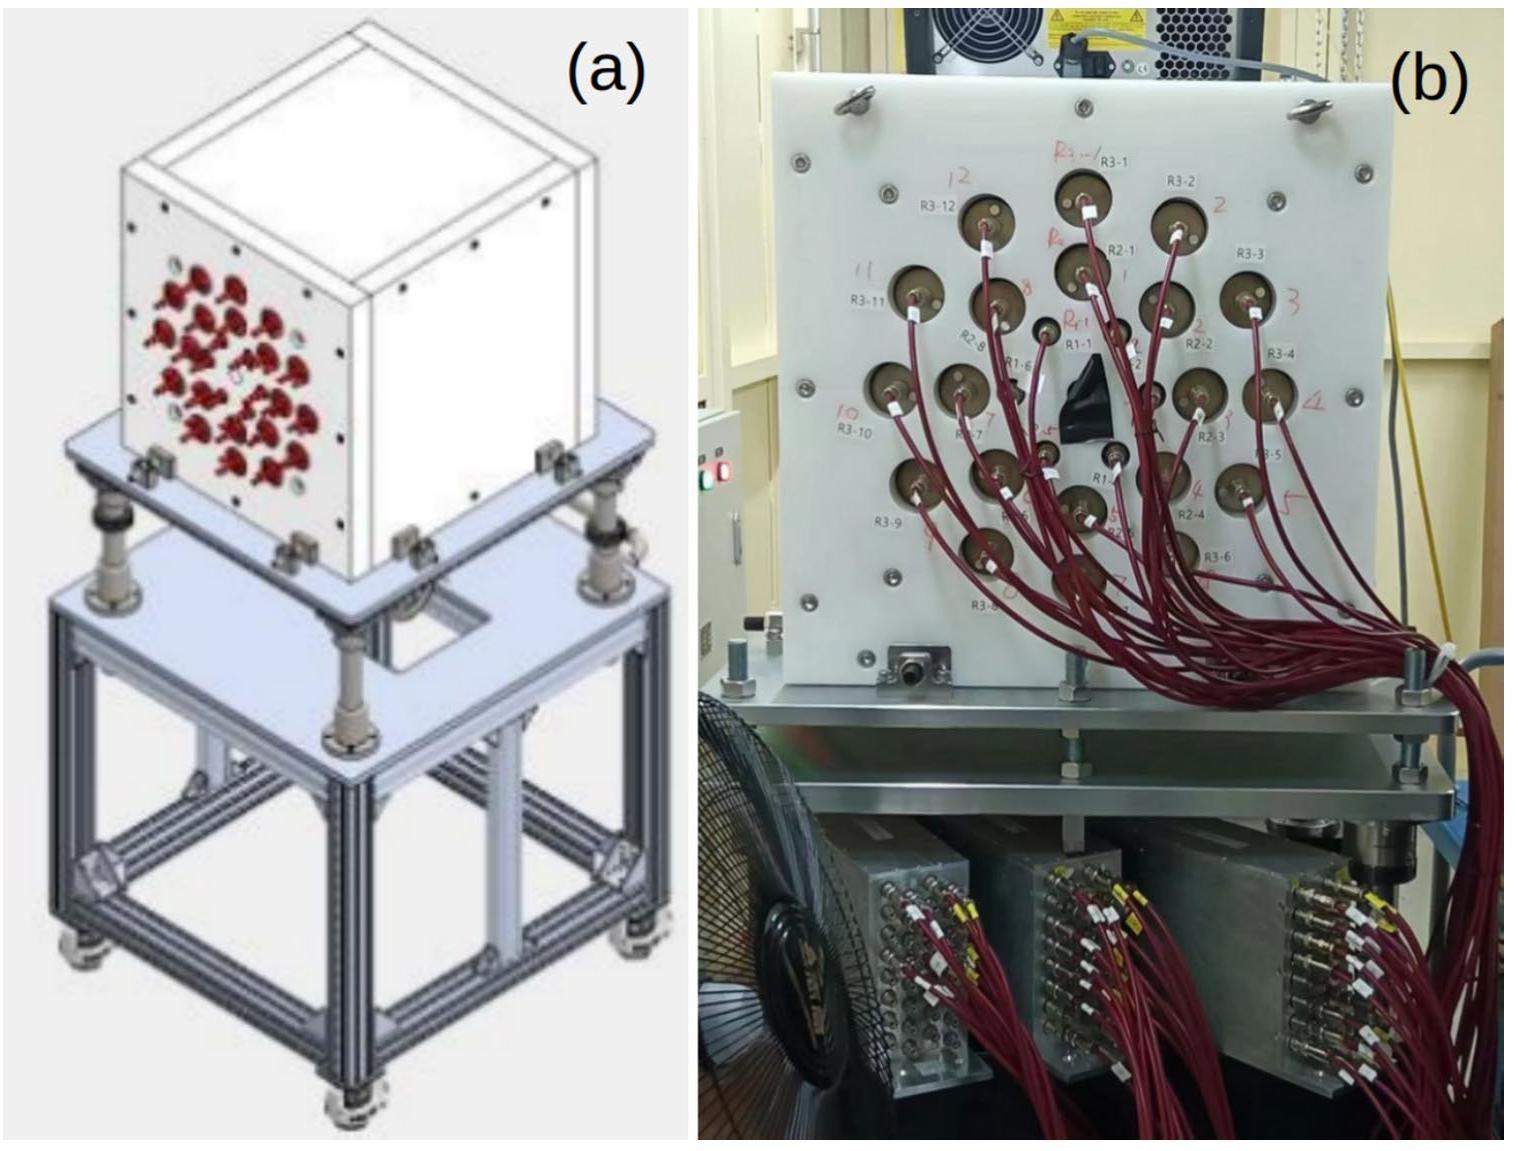
An FED spectrometer was used for experiments that exceeded the neutron threshold and only detected the neutrons produced in the reaction. The FED spectrometer consists mainly of 26 3He neutron tube detectors embedded in a 450 mm × 450 mm × 550 mm polyethylene moderator. There is a 2 mm cadmium layer and a 50 mm polyethylene layer on the outer surface of the moderator. The neutron tubes were divided into three rings with radii of 65, 110, and 175 mm. The first ring contained six neutron tubes with a diameter of 25.4 mm. The second and third rings had 8 and 12 neutron tubes each, with a diameter of 50.8 mm, respectively. The signal of the neutron tube was output by the preamplifier; therefore, the data acquisition system of the spectrometer used the SCP mode of the Mesytec acquisition system. Figure 4 shows a 3D model and a flat-efficiency neutron spectrometer. When calibrated with a californium source, its detection efficiency reached 42.1%. This spectrometer is mainly used for measuring the photoneutron cross-section, but it cannot accurately determine the neutron energy [44].
Photoneutron cross-section measurement is based on slowdown, that is, thermalization of neutrons, which are then converted into charged particles using a neutron detector. The neutron multiplicity of the moderated neutrons was measured experimentally. Two different techniques are used to estimate the number of measured neutrons: the flatness efficiency [45] and ring-ratio techniques [46]. This spectrometer uses a combination of flat efficiency and ring ratio technology.
The outermost ring is relatively more sensitive to high-energy neutrons than the innermost ring because there is more moderate material between the outermost detector and target. Therefore, the ratio of the number of neutrons detected in the outermost ring to the number of neutrons detected in the innermost ring, known as the ring ratio, varies with the average neutron energy. The goal of flat efficiency technology is to directly measure neutron multiplicity. The main design concept is to place the neutron counter in a moderator such that for energies up to 7 MeV, the detection efficiency does not depend on the neutron kinetic energy. Not only does it require a flat efficiency over a wide energy range, but it also requires a high detection efficiency for reactive neutrons.
It is impossible to achieve constant detection efficiency for an FED spectrometer with neutron energy. Therefore, we first used the ring ratio method to determine the energy of neutrons and then determined the detection efficiency of the FED spectrometer based on the variation in detection efficiency with the energy of neutrons. The neutron multiplicity was determined based on the detection efficiency of the FED spectrometer.
Neutron time-of-flight (TOF) spectrometer
The neutron time-of-flight spectrometer experiment is similar to the second experiment but requires neutron gamma coincidence measurements. Fig. 5(a) shows the structural design diagram of the neutron time of flight spectrometer, and its photograph is shown in (b). The lanthanum bromide gamma detector was located 30 cm below the target in the opposite direction of the beam. The EJ301 fast neutron detector was located 150 cm above the target in the opposite direction of the beam. The gamma detector provided the start time of an event, whereas the neutron detector provided the end time, thus obtaining the flight time of the neutron. The energy of the neutrons produced in photoneutron reactions can be obtained from their flight time. The neutron time of flight spectrometer mainly consisted of eight LaBr3 and 20 EJ301 neutron detectors, with a total of 28 signals. These signals are short-pulse signals output by the photomultiplier tubes. Therefore, the data acquisition system of the neutron time of flight spectrometer utilizes the PSD mode of the CoMPASS data acquisition system. The data acquisition system uses A3818 and V2718 fiber optic bridge modes to connect the data acquisition hardware with the computer software. Two V1730s waveform digitizers with a sampling frequency of 500 MHz were selected to collect the detector signal and perform analog-to-digital conversion. The two digitizers must synchronize their clocks to achieve neutron-gamma coincidence measurements. This spectrometer achieved a time-resolved half-maximum width of 1 ns to 1.5 ns. Therefore, high-neutron-energy accuracy measurements can be achieved.
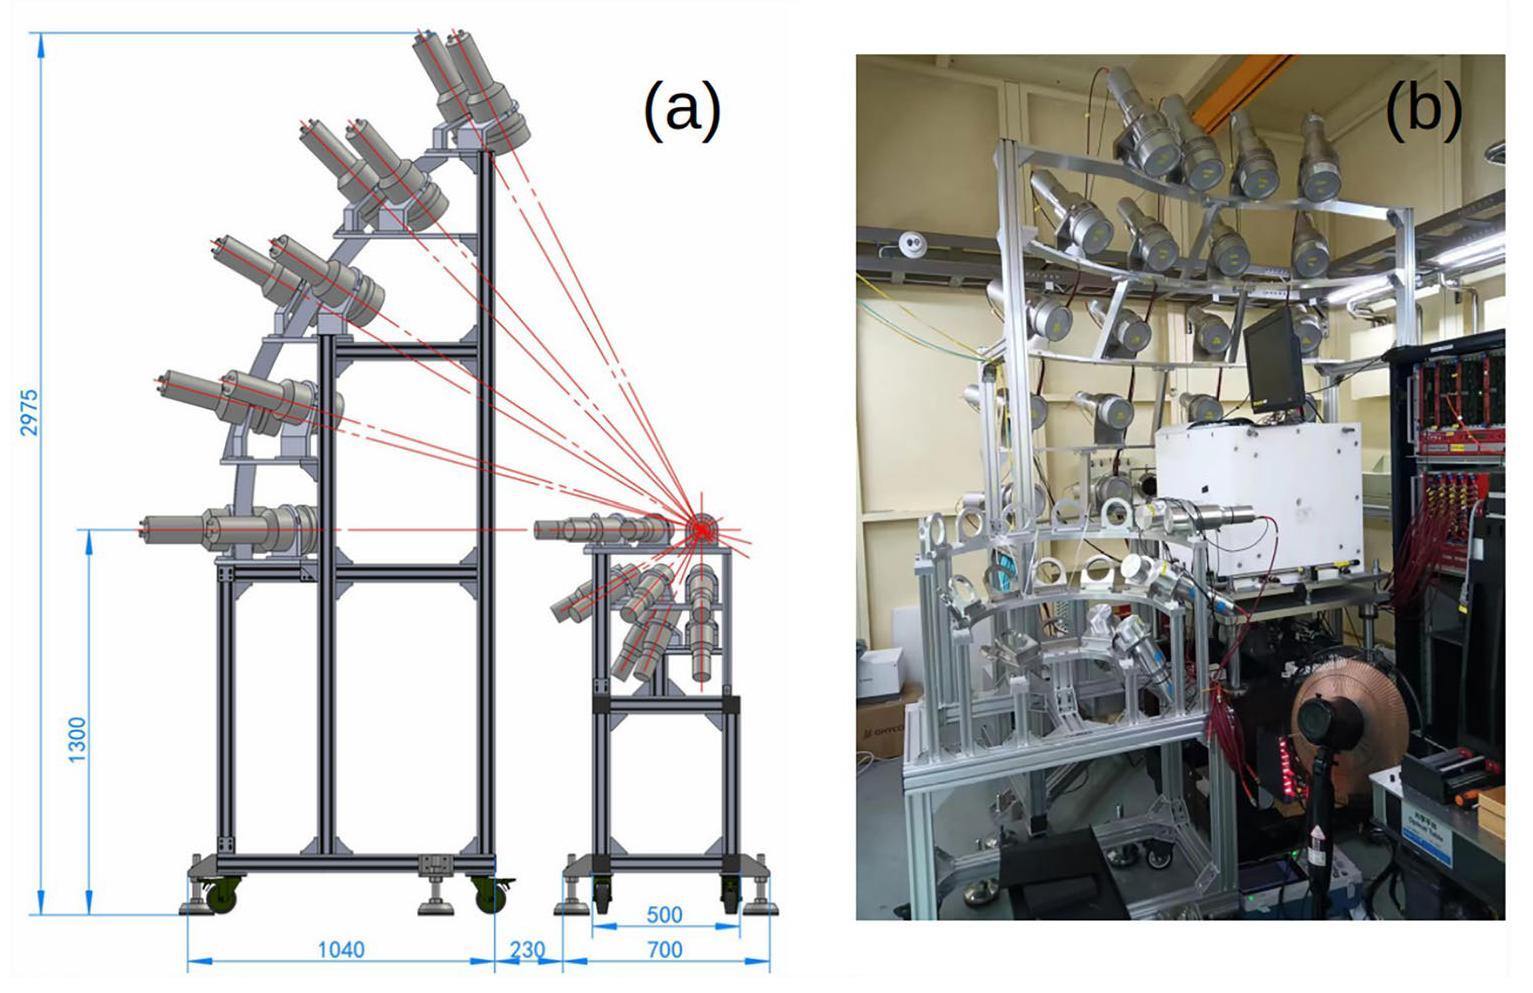
This spectrometer can be used to determine the partial energy level states of certain nuclei in photonuclear reactions. The types, granularity, and positions of the neutron and gamma detectors in the spectrometer can be redesigned according to experimental requirements, such as polarization experiments [47]. To measure the angular distribution of neutrons, the angle of the γ photons’s linearly polarized plane is tuned by changing the polarization plane of the incident laser.
Light charged particle (LCP) spectrometer
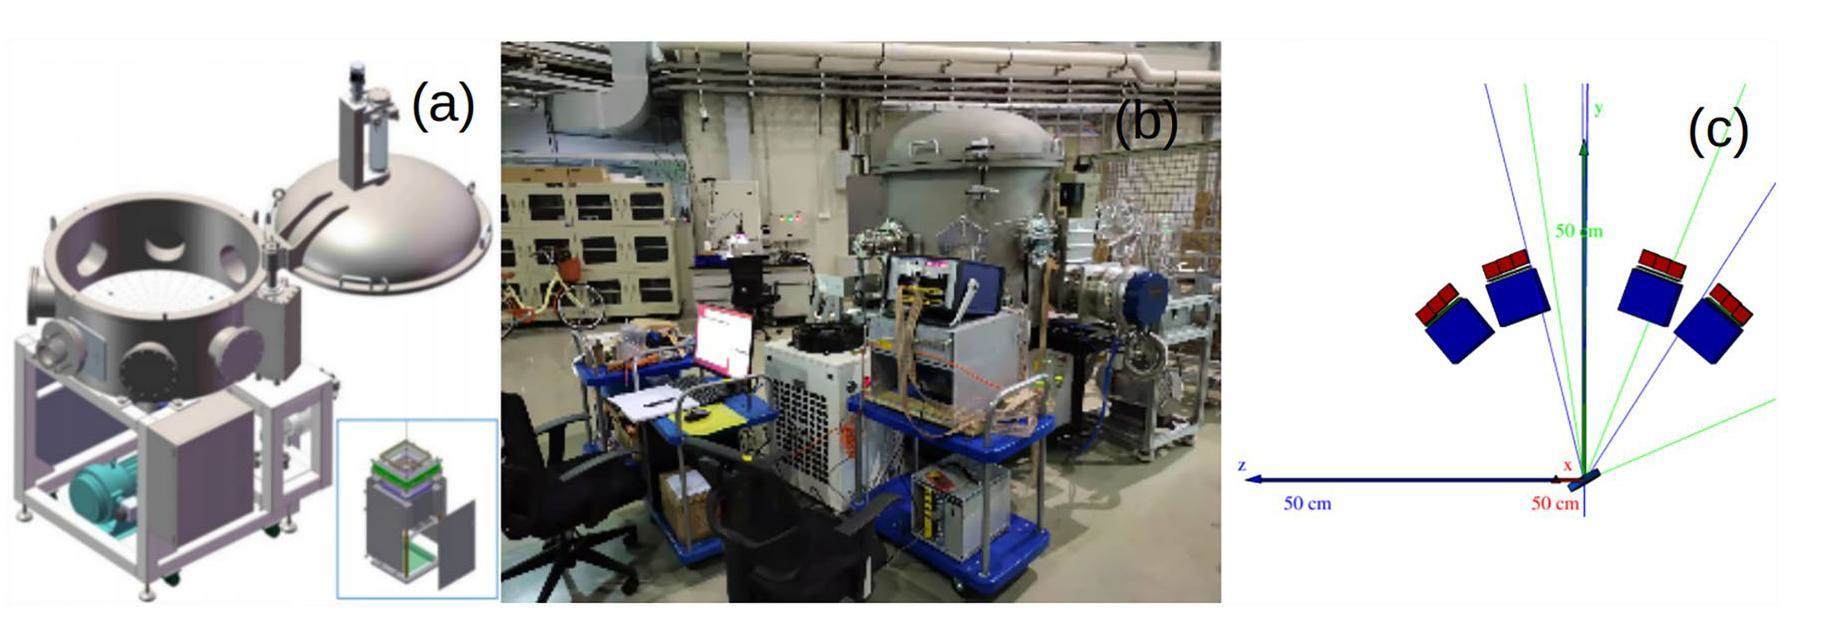
A light-charged particle spectrometer was used for experiments that exceeded the threshold of protons or other light-charged particles, mainly to detect various light-charged particles. Figure 6(a) and (b) show the 3D model of the light-charged particle spectrometer and an on-site test photo, respectively. Figure 6(c) shows the layout of the design scheme for a light-charged particle spectrometer. The gamma beam was incident in the positive direction along the Y-axis. The spectrometer was subsequently placed in a vacuum chamber. The spectrometer shown in the figure consists of four particle telescope systems placed at different angles on both sides of the beam at a distance of 25 cm from the target. Each particle telescope system consisted of a frisch-grated ionization chamber, a silicon microstrip detector, and a nine-unit cesium iodide detector array. Each telescope is an
Photon activation analysis spectrometer
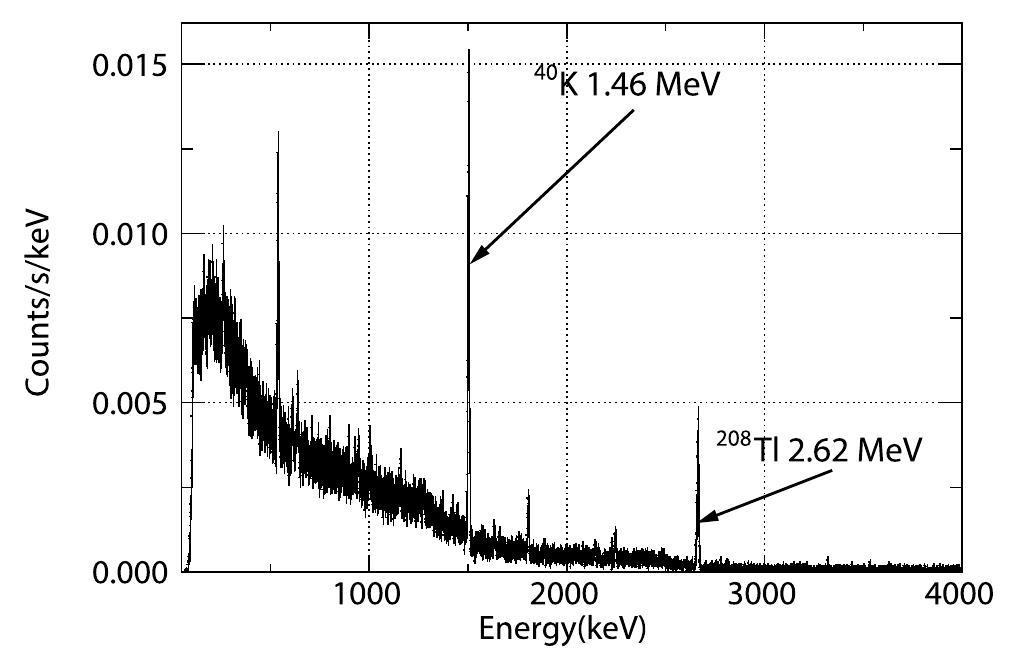
The photon activation analysis spectrometer was designed for offline measurement of gamma activation by measuring the gamma generated by product decay. The study of medical isotopes requires photon activation analysis. The experimental station was designed and constructed as a photon activation analysis spectrometer consisting of an HPGe detector with a diameter of 67mm and a length of 65mm. The background count rate of the spectrometer reached five counts per second. Figure 7 shows the background spectrum measured by using an HPGe detector in a shielded cavity.
Research on SLEGS in the field of medical radioactive isotopes will focus on evaluating the specific activity yields for medical radioactive isotopes produced in different photonuclear reactions and detailed cross-section calculations. Experimental research is designed to search for new production routes for medical radioactive isotopes, such as the measurement of the specific activity of medical radioactive isotopes produced in photonuclear reactions, measuring the production of medical radioactive isotopes of interest (γ, p) and (γ, n) cross-sections of the reaction, and finding the doorway state for the population of isomers in medical radioactive isotopes of interest.
Test experimental results of SLEGS
The photoneutron reaction cross sections of targets, such as 197Au and 159Tb, were measured using a flat-efficiency neutron detector spectrometer, and preliminary data processing was performed. The measurement results were in good agreement with those of other international laboratories. The (γ,n) reaction of natPb target was tested using neutron time-of-flight (TOF) spectrometry. Twenty EJ301 neutron detectors were used in the experiment at a distance of 150 cm from the target. Six LaBr3 detectors were used, with a distance of 30 cm from the target. The neutron time-of-flight spectra measured in the experiment ranged from 40 ns to 200 ns. The peaks of 569.6 keV, 897.3 keV of product 207Pb, and 803.1 keV of product 206Pb were clearly distinguished in the gamma spectrum. The gamma flux measured at various laser incidence angles using a photon activation analysis spectrometer is consistent with the flux measured using the LaBr3 detector. Experiments on the NRF and LCP spectrometers are also ongoing and planned.
Conclusion
The SLEGS beamline at SSRF is a powerful platform for investigating the GDR, PDR, and MDR for research in fields such as s-process and p-process nucleosynthesis, nuclear structure and nuclear medicine. Currently, photon-induced nuclear reaction data can be collected using neutron FED and neutron TOF spectrometry. In addition, the gamma NRF spectrometer and LCP spectrometer methods will be gradually available to users in the future.
Photonuclear reactions–From basic research to applications
. Prog. Part. Nucl. Phys. 122, 103903 (2022). https://doi.org/10.1016/j.ppnp.2021.103903Measurements and simulations of low energy, thick target bremsstrahlung spectra
. Nucl. Instrum. Meth. Phys. Res. Sect. A 300, 293-296 (1991). https://doi.org/10.1016/0168-9002(91)90439-WThe photon-scattering facility at the superconducting electron accelerator ELBE
. Nucl. Instrum. Meth. Phys. Res. Sect. A 555, 211-219 (2005). https://doi.org/10.1016/j.nima.2005.09.024Angular distribution of bremsstrahlung from copper and tungsten targets bombarded by 18, 28, and 38 MeV electrons
. J. Nucl. Sci. Technol. 47, 286-294 (2010). https://doi.org/10.1080/18811248.2010.9711956Real photon scattering up to 10 MeV: the improved facility at the Darmstadt electron accelerator S-DALINAC
. Nucl. Instrum. Meth. Phys. Res. Sect. A 423, 480-488 (1999). https://doi.org/10.1016/S0168-9002(98)01348-5Flerov Laboratory of Nuclear Reactions
, 2024, http://flerovlab.jinr.ru/mt-25-microtron/Accessed:Accelerating new discoveries in nuclear physics
, 2024, https://www.llnl.gov/article/45861/accelerating-new-discoveries-nuclear-physics Accessed:Nuclear resonance fluorescence excitations near 2 MeV in 235U and 239Pu
. Phys. Rev. C 78, 041601 (2008). https://doi.org/10.1103/PhysRevC.78.041601National Science Center Kharkov Institute of Physics and Technology
, 2024, https://www.kipt.kharkov.ua/en/Accessed:The Idaho Accelerator Center
, 2024, https://www.isu.edu/physics/facilities–research/idaho-accelerator-center- iac/Accessed:The low-energy photon tagger NEPTUN
. Nucl. Instrum. Meth. Phys. Res. Sect. A 62, 257-303 (2009). https://doi.org/10.1016/j.ppnp.2008.07.001Research opportunities at the upgraded HIγS facility
. Prog. Part. Nucl. Phys. 613, 232-239 (2010). https://doi.org/10.1016/j.nima.2009.11.038Nuclear physics research at the high intensity gamma-ray source (HIγS)
. Nucl. Phys. News 25, 19-24 (2015).Demonstration of tomographic imaging of isotope distribution by nuclear resonance fluorescence
. AIP Advances 9, 035101 (2019). https://doi.org/10.1063/1.5064866PERLE. Powerful energy recovery linac for experiments. Conceptual design report
, J. Phys. G Nucl. Part. Phys. 45, 065003 (2018). https://doi.org/10.1088/1361-6471/aaa171Novel high intensity gamma-source at CERN: the Gamma Factory Initiative
. PoS LHCP2018, (2018). https://doi.org/10.22323/1.321.0089High-luminosity Large Hadron Collider with laser-cooled isoscalar ion beams
. Prog. Part. Nucl. Phys. 114, 103792 (2020). https://doi.org/10.1016/j.ppnp.2020.103792Atomic physics studies at the gamma factory at CERN
. Ann. Phys. 532, 2000204 (2020). https://doi.org/10.1002/andp.202000204Research on properties and application of Compton backscattered gamma light source based on synchrotron radiation accelerator
. Prog. Phys. 23, 389 (2003). https://doi.org/10.3321/j.issn:1000-0542.2003.04.001(in Chinese)A high intensity beam line of γ-rays up to 22 MeV energy based on Compton backscattering
. Nucl. Instrum. Meth. Phys. Res. Sect. A 578, 457 (2007). https://doi.org/10.1016/j.nima.2007.05.32214An X-ray source based on Compton backscattering of CO2 laser and 100 MeV electrons
. Nucl. Instrum. Meth. Phys. Res. Sect. A 580, 1184-1190 (2007). https://doi.org/10.1016/j.nima.2007.07.00715Laser Compton scattering experiments and the latest developments in construction of experimental facilities at SINAP
. SPIE 7385, 73852D (2009). https://doi.org/10.1117/12.83557216A laser-Compton scattering(LCS) prototype experiment at 100 MeV Linac of Shanghai Institute of Applied Physics
. Rev. Sci. Instr. 81, 013304 (2010). https://doi.org/10.1063/1.328244517An X-ray spectroscopy system and its application to the Laser-Compton scattering experiments
. Nucl. Instrum. Meth. Phys. Res. Sect. A 624, 141-147 (2010). https://doi.org/10.1016/j.nima.2010.09.04518A 4D Monte Carlo laser-Compton scattering simulation code for the characterization of the future energy-tunable SLEGSA 4D Monte Carlo laser-Compton scattering simulation code for the characterization of the future energy-tunable SLEGS
. Nucl. Instrum. Meth. Phys. Res. Sect. A 660, 108-115 (2011). https://doi.org/10.1016/j.nima.2011.09.03519X-ray generation from slanting laser-Compton scattering for future energy-tunable Shanghai Laser Electron Gamma Source
. Appl. Phys. B 101, 761-771(2010). https://doi.org/10.1007/s00340-010-4100-020Current status and progresses of SSRF project
. Nucl. Sci. Tech. 19, 1-6 (2008). https://doi.org/10.1016/S1001-8042(08)60013-5Photo-fission in heavy elements
. Phys. Rev. 71, 3 (1947) https://doi.org/10.1103/PhysRev.71.3Giant dipole resonance in the hot and thermalized 132Ce nucleus: Damping of collective modes at finite temperature
. Phys. Rev. Lett. 97 (2006). https://doi.org/10.1103/2Atomic Data and Nuclear Data Tables
93 (549).Development and prospect of shanghai laser Compton scattering gamma source
. Nucl. Phys. Rev. 37, 53-63 (2020). https://doi.org/10.11804/NuclPhysRev.37.2019043 (in Chinese)Exotic modes of excitation in atomic nuclei far from stability
. Rep. Prog. Phys. 70, R02 (2007). https://doi.org/10.1088/0034-4885/70/5/R02Constraints on the symmetry energy and neutron skins from pygmy resonances in 68Ni and 132Sn
. Phys. Rev. C 81, 041301 (2010). https://doi.org/10.1103/PhysRevC.81.041301Photoneutron cross sections for 96Zr: A systematic experimental study of photoneutron and radiative neutron capture cross sections for zirconium isotopes
. Phys. Rev. C 81, 014615 (2010). https://doi.org/10.1103/PhysRevC.81.035801Systematic study of multifragmentation in asymmetric colliding nuclei
. Phys. Rev. C 81, 064610 (2010). https://doi.org/10.1103/PhysRevC.81.064610Commissioning of laser electron gamma beamline SLEGS at SSRF
. Nucl. Sci. Tech. 33, 87 (2022). https://doi.org/10.1007/s41365-022-01076-0Interaction chamber for laser compton slant-scattering in SLEGS beamline at shanghai light source
. Nucl. Instr. Meth. A 1033, 166742 (2022). https://doi.org/10.1016/j.nima.2022.166742Collimator system of slegs beamline at shanghai light source
. Nucl. Instrum. Meth. Phys. Res. Sect. A 1013, 165638 (2021). https://doi.org/10.1016/j.nima.2021.165638The clover: a new generation of composite Ge detectors
. Nucl. Instrum. Meth. Phys. Res. Sect. A 432, 90-110 (1999). https://doi.org/10.1016/S0168-9002(99)00277-6CAEN
:https://www.caen.it [online].2023.Mesytec
. https://www.mesytec.com [online].2023.Design and detector performance analysis of Shanghai Laser Electron Gamma Source (SLEGS) nuclear resonance fluorescence spectrometer
. Nucl. Phys. Rev. 40, 58-65 (2023). https://doi.org/10.11804/NuclPhysRev.40.2022040(in Chinese)Design and simulation of 4π flat-efficiency 3He neutron detector array
. Nuclear Techniques 43, 110501 (2020). https://doi.org/10.11889/j.0253-3219.2020.hjs.43.110501 (in Chinese)Polyethylene moderated 3He neutron detectors
. Nucl. Instrum. Meth. 72, 161-166 (1969). https://doi.org/10.1016/0029-554X(69)90152-9Photoneutron cross sections for 90Zr, 91Zr, 92Zr, 94Zr, and 89Y
. Phys. Rev. 162, 1098-1111 (1967). https://doi.org/10.1103/PhysRev.162.1098Simulation and test of the SLEGS TOF spectrometer at SSRF
. Nucl. Sci. Tech. 34, 47 (2023). https://doi.org/10.1007/s41365-023-01194-3Ion pulse ionization chamber for online measurements of the radon activity concentration
. Nuclear Techniques 44, 040403 (2021). https://doi.org/10.11889/j.0253-3219.2021.hjs.44.040403 (in Chinese)Thick-target yield of 17.6MeV γ ray from the resonant reaction 7Li(p,γ)8Be at Ep =441keV
. Nucl. Instr. Meth. B 529, 56-60 (2022). https://doi.org/10.1016/j.nimb.2022.08.005Use of the 27Al(p,γ)28Si, Ep = 992 keV resonance as a gamma-ray intensity standard
. Nucl. Instr. Meth. 147, 501-505 (1977). https://doi.org/10.1016/0029-554X(77)90393-7New measurement of thick target yield for narrow resonance at Ex=9.17MeV in the 13C(p,γ)14N reaction
. Chinese Phys. B 28, 060706 (2019). https://doi.org/10.1088/1674-1056/28/6/060706Study on γ-ray source from the resonant reaction 19F(p,αγ)16O at Ep= 340 keV
. Chinese Phys. B 29, 070702 (2020). https://doi.org/10.1088/1674-1056/ab96a0Geant4—a simulation toolkit
. Nucl. Instrum. Meth. Phys. Res. Sect. A 506, 250-303 (2003). https://doi.org/10.1016/S0168-9002(03)01368-8A multidimensional unfolding method based on bayes’ theorem
. Nucl. Instrum. Meth. Phys. Res. Sect. A 362, 487-498 (1995). https://doi.org/10.1016/0168-9002(95)00274-XThe authors declare that they have no competing interests.

