Introduction
Conventional X-ray tubes produce X-rays by bombarding the anode target with free electrons generated by the thermionic cathode [1-4]. These tubes are simple to manufacture but are limited by a fixed radiated volume, long warm-up time, and high operating temperature [5-7]. With increasing demand for high-resolution, high-speed, and low-dose imaging, flat-panel X-ray sources (FPXSs) have become promising alternatives for producing high-quality X-rays [8, 9]. FPXSs were developed based on cold cathode field-emission arrays (FEAs), where the anode is a transmission target and the cathode comprises millions of cold cathode electron sources with a two-dimensional array distribution [10-14]. Travish et al. presented an addressable FPXS that utilizes spontaneous polarization in pyroelectric crystals to generate high fields and field-enhanced emissions from micropatterned tips to create a large array of electron beamlets [10]. Posada et al. assembled an FPXS with an FEA prototype based on nitrogen-incorporated ultra-nanocrystalline diamond film as the electron source [11]. Our group fabricated a transmission-type FPXS in a diode structure using large-scale patterned ZnO nanowires grown on a glass substrate by thermal oxidation as the field-emitter electrode and a tungsten thin film coated on silica glass as the transmission anode. We obtained high-resolution X-ray images with a spatial resolution of less than 25 μm [12, 13]. We then fabricated a diagonal 4-inch cold cathode FPXS device with patterned Zn arrays of 2400×2400 distributed on a square area of 7.2 cm × 7.2 cm and realized projection imaging with a resolution of more than 5.0 lp/mm [14]. At present, the maximum stable operating voltage of the diagonal 2.7-inch and 4-inch FPXS fabricated by our group using ZnO nanowires can reach 50 kV, which was initially used for the projection imaging of various realistic objects.
Compared with conventional thermionic cathode X-ray tubes, FPXS significantly shortens the distance between the source and detector and has the advantages of low power consumption, a compact structure, a low operating temperature, high resolution, and greater addressability [15-17]. The advantages of FPXS make it a promising candidate for digital breast tomosynthesis, stationary computed tomography (CT) imaging, and low-dose imaging [18-21]. However, current FPXSs cannot achieve the theoretical high current density and long lifetime, and the limitations of cathode unreliability and projection overlapping must be addressed [22]. Imaging-system modeling and projection simulations are essential for assisting in the structural optimization and imaging-performance analysis of FPXSs. Computer-aided projection simulations of X-ray sources are recognized as a useful and effective experimental tool in diagnostic radiology [23]. Unlike realistic experiments, computer-aided projection simulations enable the specific simulation of arbitrary components within an X-ray imaging system and provide a reference [24]. In this study, we aim to develop efficient and accurate projection-simulation packages for FPXSs that can be utilized to support imaging-system design and structure optimization, imaging-performance prediction and evaluation, and reconstruction algorithm development.
To the best of our knowledge, three main methods are used for the projection simulation of conventional single-focal spot X-ray imaging systems: the conventional analytical method, Monte Carlo (MC) method, and hybrid method, each of which has its advantages and disadvantages. The conventional analytical method is a deterministic ray-tracing approach based on the Beer–Lambert law [25, 26], which is computationally simple and efficient and can be used to calculate the primary signal [27] as well as the scatter signal [28]. The MC method provides a good estimation of the average behavior of all photons by sampling the behavior of a representative fraction [29] and has superior accuracy. However, it requires a long simulation time and often requires parallel computing with a graphics processing unit (GPU) for acceleration [30-32]. The hybrid method combines the advantages of efficiency and accuracy, using the analytical ray-tracing approach to calculate the primary signal and scattering compensation techniques to obtain the scattering distribution, and it is increasingly favored for research [33, 34]. For large-area FEAs comprising thousands of patterns arranged in arrays, the analytical ray-tracing approach must calculate the projection of each pattern and then superimpose the projections of all patterns to calculate the final projection of the FPXS. The computation time increases proportionally with the number of patterns; therefore, the ray-tracing approach and hybrid method no longer have the advantage of high efficiency. In contrast, the MC method only needs to ensure that a sufficient number of particles reach the detector; therefore, the simulation time does not increase significantly with the size of the patterned arrays. Comparing the three methods described above applied to the FPXS, the GPU-based MC projection simulation guarantees efficiency and accuracy with significant advantages.
In this study, two MC projection simulators for FPXS are proposed: a GPU-based phase-space sampling MC simulator named gPSMC and GPU-based fluence sampling MC simulator named gFSMC. In addition, a phase-space optimization technique is added to gPSMC, and a new simulator named gPSMC-o is presented. To verify the accuracies of gPSMC, gPSMC-o, and gFSMC, projection simulations using the three simulators and ray-tracing approach are performed, along with the acquired realistic projections for the FPXS developed by our group [12-14, 16-21]. The imaging geometry includes a digital water phantom, two digital polymeric methyl methacrylate (PMMA) phantoms and a digital line-pair phantom created in this study, and two PMMA slabs and a realistic line-pair testing card. The calculated projections for these phantoms are compared qualitatively and quantitatively, and the computation time for the water phantom under the different patterned arrays is statistically analyzed.
Materials and methods
Structures of FPXS
Figure 1(a) shows a schematic of an FPXS with a bipolar structure, which comprises a cold cathode plate and transmission anode plate placed 5 mm apart. The main components of both the cathode and anode plates are fabricated on a 4.8 cm × 4.8 cm indium tin oxide (ITO) film and 9.4 cm × 12.4 cm glass substrate.
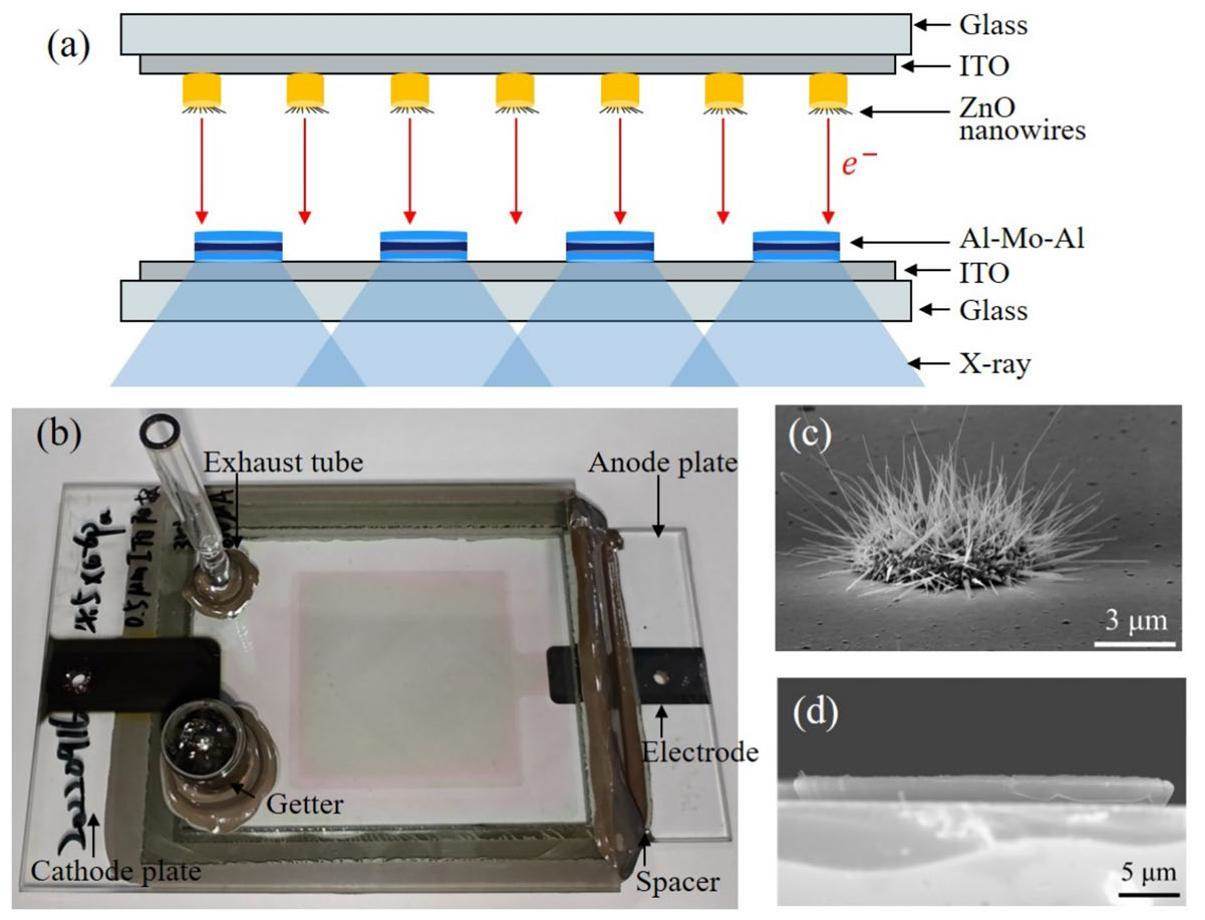
Figure 1(b) shows a photograph of a 2.7-inch full vacuum-sealed FPXS. The cathode and anode plates were fixed with spacers and vacuumed through an exhaust tube and a getter. For the cathode plate, 1600×1600 patterned ZnO nanowire arrays with a uniform alignment were deposited on a 0.5-μm-thick ITO film. Each ZnO pattern had a diameter of 5 μm and the center-to-center distance between adjacent patterns was 30 μm. A scanning electron microscopy (SEM, SUPRA-60, Zeiss, Germany) image of a ZnO pattern is shown in Fig. 1(c). The transmission-type anode target comprised a 50-nm-thick ITO film and 600×600 patterned Al-Mo-Al arrays distributed on the ITO film. The Al-Mo-Al pattern was a cylindrical sandwich structure consisting of 0.12-μm-thick Al, 1.07-μm-thick Mo, and 0.12-μm-thick Al. Figure 1(d) shows an SEM image of an Al-Mo-Al pattern; each pattern has a diameter of 30 μm and a center-to-center distance of 80 μm. The specific micro-fabrication technology used in the manufacture of the FPXS is presented in the following references [12-14]. By applying an enhanced electric field between the cathode and anode plates using a high-voltage power source, electrons overflowed from the ZnO nanowires, bombarded the anode target, and generated photons that passed through the glass substrate underneath the anode target to form a large-area X-ray beam. The maximum operating voltage of the FPXS exceeded 50 kV, and the maximum current obtained at an applied voltage of 40 kV was 3.27 mA [14].
Key techniques of gPSMC and gFSMC
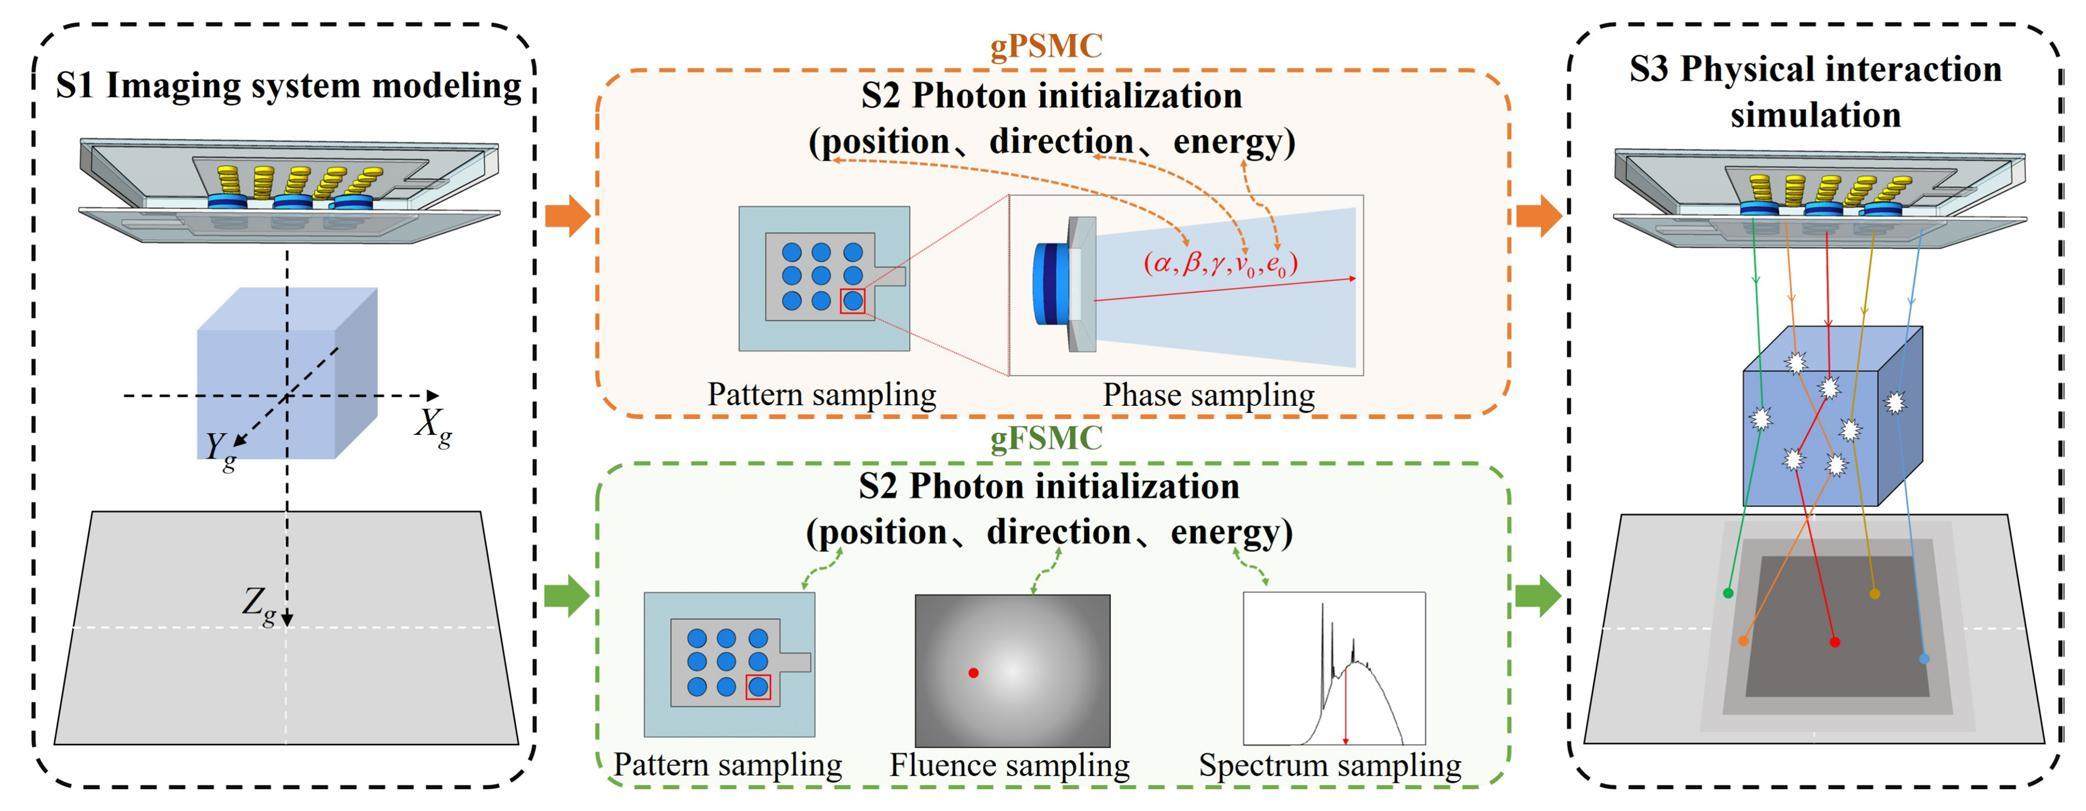
Figure 2 summarizes the projection simulation flowchart for FPXS using the gPSMC and gFSMC simulators, which were divided into three components: imaging-system modeling, photon initialization, and physical-interaction simulation in the phantom. The gFSMC simulator was identical to the gPSMC simulator in terms of imaging-system modeling and physical-interaction simulation; however, the approaches used for photon initialization were different. The structure of the FPXS, imaging geometry, detector in the imaging system, and unified coordinate system were simulated to realize the entire imaging-system modeling and obtain the required FPXS phase space (PHSP). Using the calculated PHSP, the pattern sampling and PHSP sampling techniques were proposed in gPSMC to obtain the state of arbitrarily sampled photons. gPSMC-o further incorporated a PHSP optimization technique based on gPSMC. For the gFSMC, energy-spectrum and fluence-map sampling techniques were performed for parameter initialization of the sampled photons. For the sampled initial photons, the entire physical-interaction process of the photons passing through the phantom to the detector was simulated by sampling the photon forward distance and various interaction types on the GPU kernels, and the projection was generated by counting the energy of the photons arriving at the detector. Detailed descriptions of the three components and key techniques of gPSMC and gFSMC are provided in the following sections.
Imaging-system modeling
Before starting the MC-based physical-interaction simulations, the FPXS, imaging geometry, and detector in the FPXS imaging system were modeled, and a unified coordinate system was established. In addition, the detailed geometric parameters and relative positions of each component were defined and determined.
To obtain the PHSP and analyze the beam characteristics of the X-rays generated by the FPXS, the BEAMnrc package (version 1.25) [35] was used to perform a structure modeling of the source. Since the cathode and anode of the FPXS include millions of patterns, directly simulating the structure of the entire FPXS to generate a PHSP is difficult and time-consuming. Under the premise that the fabrication process is stable and that all Al-Mo-Al patterns have exactly the same structure and output the same PHSP data, we propose an approach to represent the PHSP of the entire source by duplicating the pattern PHSP and sampling the pattern position. Under a strong electric field between the cathode and anode plates, the direction of motion of the electrons produced by the cathode is almost perpendicular to the anode target; therefore, a parallel electron beam is used to represent the electron beam emitted by the ZnO nanowires. Considering that the FPXS anode pattern had a diameter of 30 μm and spacing of 80 μm, numerous electrons were emitted from the ZnO nanowires bombarding the ITO in the gap of the Al-Mo-Al patterns, and the resulting X-rays significantly affected the FPXS spectrum. A square electron beam with a side length of 80 μm was used to completely cover each Al-Mo-Al pattern and the surrounding ITO. The kinetic energy of the simulated electron beam was 35 kV. Figure 3(a) shows the structure of the FPXS modeling. The FLATFILT module in BEAMnrc was used to simulate the Al-Mo-Al pattern of the anode with a diameter of 30 μm, and the outer region of the module was vacuum. Three square SLABS modules with side lengths of 4.80 cm were used to simulate the ITO film, glass, and virtual detector. A total of 20 billion electrons were simulated, and the 280 million photons generated were recorded by the virtual detector and saved as PHSP data. The states of each photon included energy, motion direction, and relative distance to the center of the pattern.
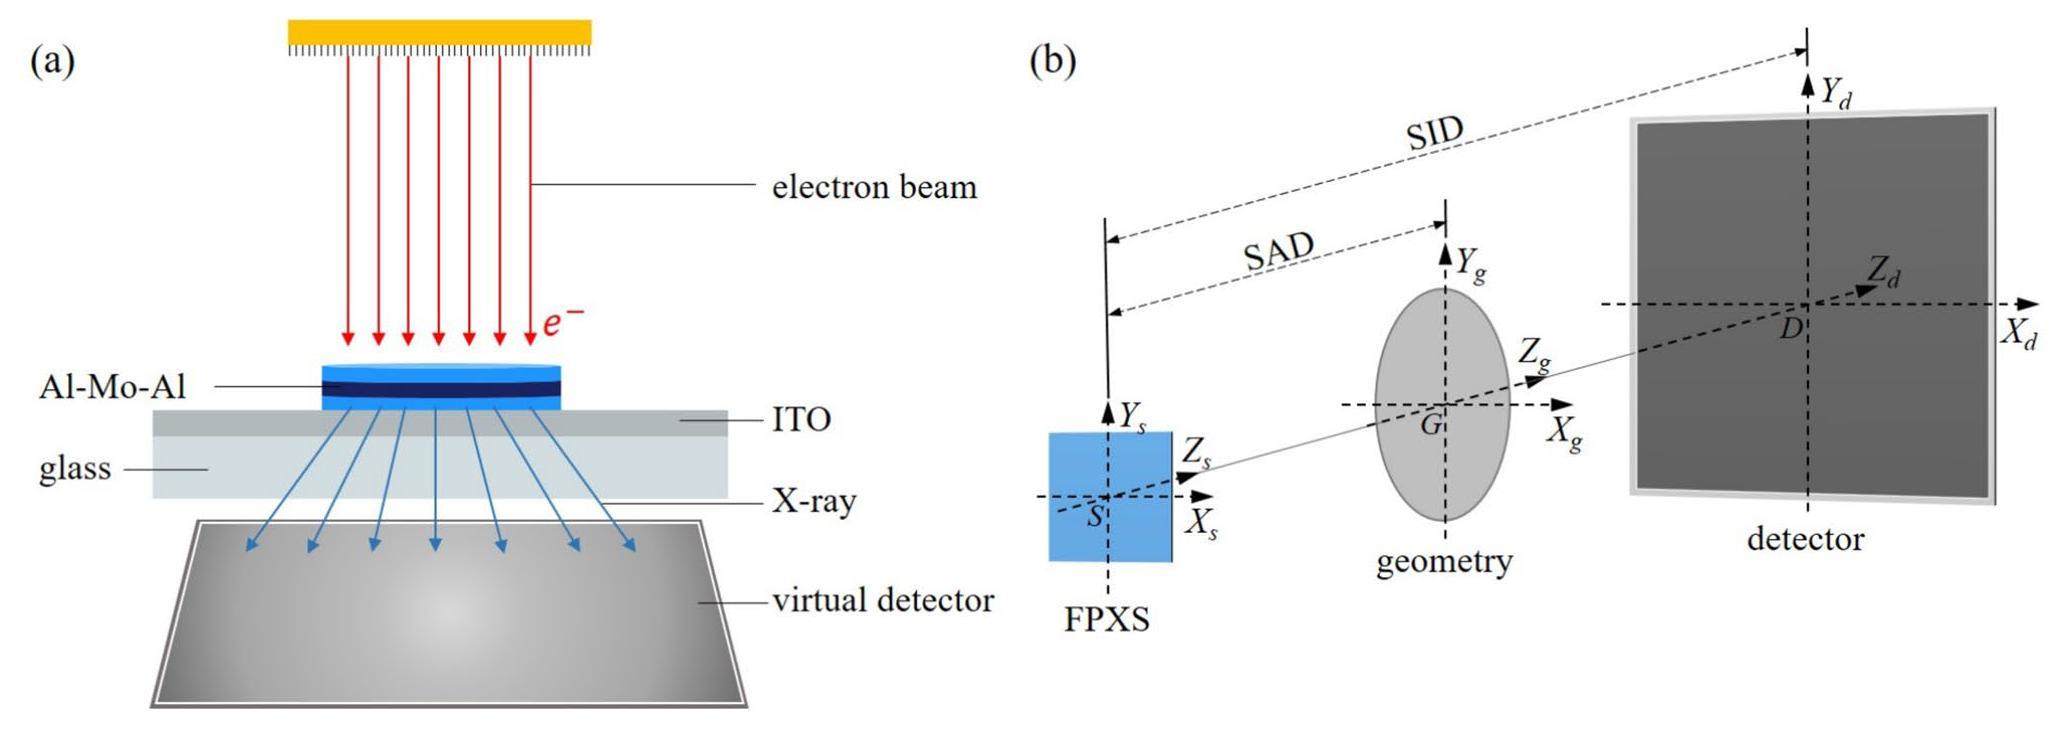
Imaging-geometry modeling and detector modeling were also performed, and a unified coordinate system for the FPXS imaging system was established. To model the imaging geometry, parameters such as the matrix size, resolution, and offsets of the geometric phantom were defined in the imaging system. The required parameters for the detector including pixel size, resolution, and offsets were defined, and the detector response function was defined to represent the probability of a photon being attenuated by the realistic detector material and the efficiency of converting the optical signal into an electrical signal. The input parameters of the detector response were the photon energy and position of the photon arriving at the detector. Figure 3(b) shows the unified coordinate frame of the entire imaging system. The geometric coordinate frame (Xg, Yg, Zg) was established by setting the center of the geometry as the origin G. For the FPXS, a coordinate frame (Xs, Ys, Zs) was defined, with its origin S at the center of the FPXS. For the detector, a coordinate frame (Xd, Yd, Zd) was established with its origin D at its center. Notably, the centers of the FPXS, geometry, and detector were all on the same line; the Xs axis was parallel to the Xg and Xd axes, and the Ys axis was parallel to the Yg and Yd axes. Through the transformation of different coordinate frames, the exact coordinates at which the photons were located in the process of physical interaction in the geometry can be determined. Furthermore, the relative positions of the FPXS, imaging geometry, and detector within the imaging system were determined by defining the source-to-axis distance (SAD) and source-to-imager distance (SID) values over three coordinate frames.
Photon initialization in gPSMC
Photon initialization determines the energy, position, and direction of motion of the initial photons in the FPXS imaging system. Photon initialization in gPSMC was performed by obtaining the initial photon state in the PHSP, including pattern sampling and PHSP sampling techniques in the FPXS coordinate frame (Xs, Ys, Zs), as indicated in Fig. 4. A pattern sampling technique was proposed to generate the pattern position to which the emitted photon belongs in the entire patterned array and calculate its center coordinates. Specifically, random sampling was used to determine the row and column indices of the sampled pattern in the patterned array, and the row and column indices were used to calculate the distance between the center of the sampled pattern (

Owing to the large range of the initial directions of the photons in the PHSP, preliminary experiments revealed that most of the sampled initial photons (up to 90%) obtained through the above steps could not reach the detector when the motion direction was constant without scattering; thus, the simulation of these photons was impractical. To improve the utilization of the initial photons and accelerate the subsequent simulation process, a PHSP optimization technique was proposed to screen the sampled initial photons, as depicted in Fig. 4(c). A new simulator gPSMC-o was proposed by incorporating the PHSP optimization technique into gPSMC. Considering that the direction of scattering changes when a photon interacts with the geometry, the screening process is based on whether the photon intersects the detector or the surface of the geometry when moving in the initial direction. In the unified coordinate system, the initial direction and coordinates of the initial photon were used to determine whether the photon could enter the geometry or reach the detector surface after an outward expansion of 2 cm. Only photons that can reach the geometry surface or detector region were used for subsequent physical-interaction simulations, and unreachable photons were discarded.
Photon initialization in gFSMC
For gFSMC, photon initialization was implemented based on the energy spectrum and fluence map, rather than on the PHSP. Because of the identical structure of all the patterns in the FPXS, the energy spectrum of a single pattern can represent the energy spectrum of the entire FPXS. The energy spectrum curve was calculated by counting the number of photons at different energy levels for all the photons in the PHSP generated as described in Sect. 2.2.1, shown in Fig. 5(a). In this study, the fluence map refers to the energy distribution of the photons reaching the detector without imaging geometry, and the values of different pixels in the distribution represent the probability density of the photons arriving at different locations on the detector. The fluence map can be obtained by acquiring or simulating an FPXS air-scan image, where the air-scan image corresponds to the energy-deposition distribution of all photons emitted by the FPXS reaching the detector in the absence of geometry. The projection of the air phantom simulated by gPSMC was used as the fluence map to ensure the consistency of the simulation conditions between the two MC simulators.
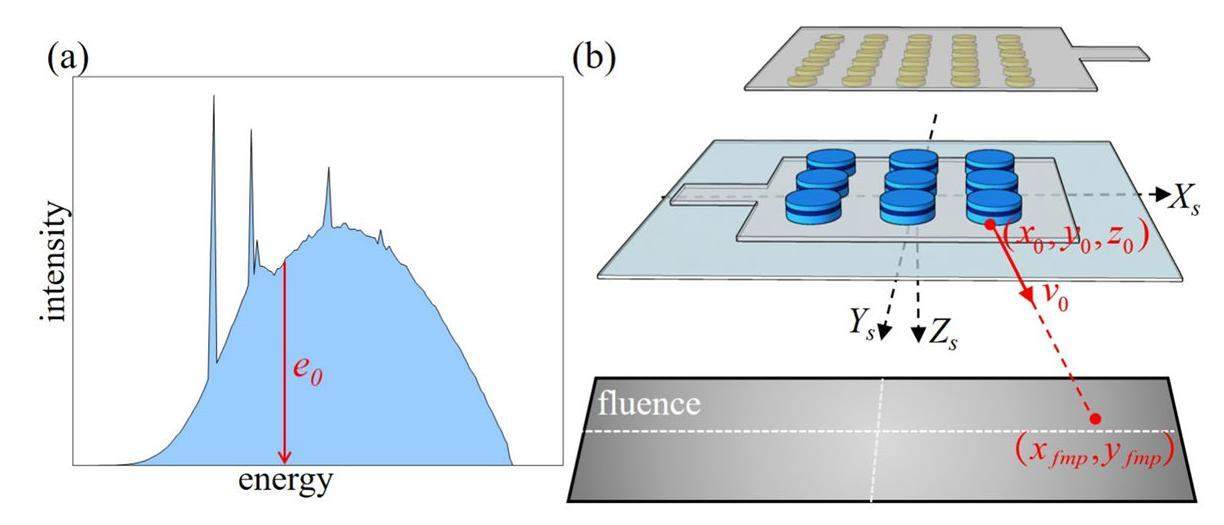
The proposed photon-initialization approach in gFSMC includes energy-spectrum, pattern, and fluence-map sampling techniques. Figure 5 presents a schematic of the photon-initialization process. The energy e0 of the initial photons was determined by performing Metropolis sampling [36] in 235 energy bins of the energy spectrum curve, e.g., the sampled energy corresponding to the red line in Fig. 5(a). To determine the direction of motion of the initial photon, a pattern-sampling technique was used to generate pattern positions from the entire patterned array. Notably, each pattern in the FPXS arrays was approximated as an infinitesimal spot source, and the center coordinates (
Physical-interaction simulation in phantom
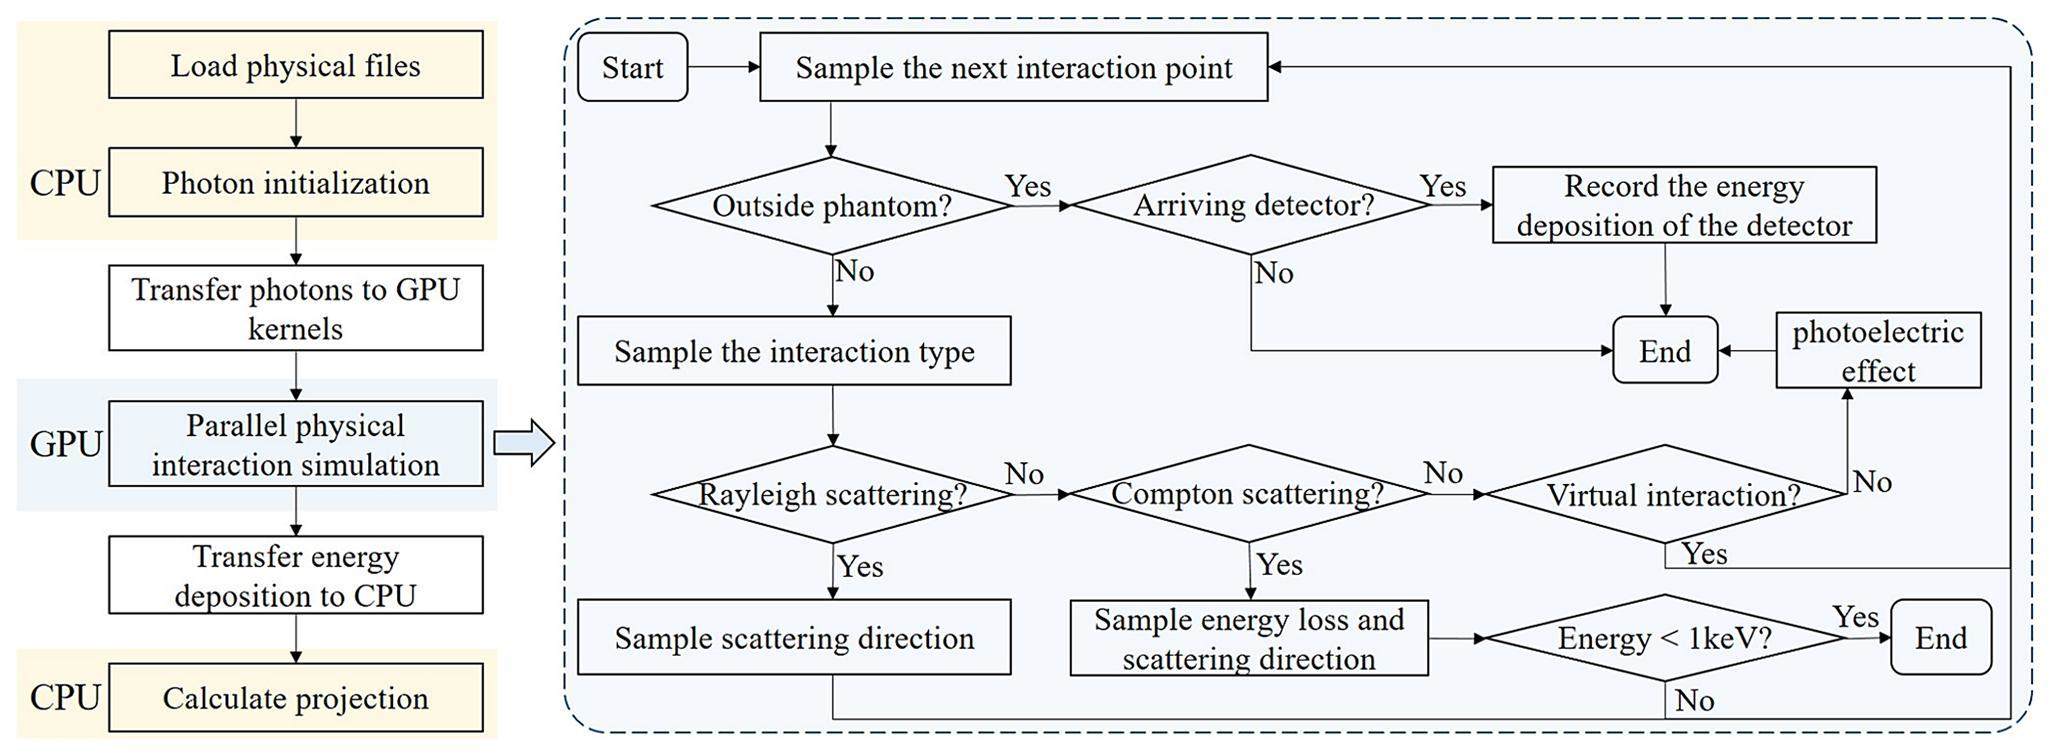
Physical files including differential cross-section (DSC) data, mass attenuation coefficient, and density-mapping data of various simulated materials need to be initialized to ascertain how the photons interact with multiple materials and determine the photon-path length within the phantom. For the initial photons that have completed initialization on the central processing unit (CPU), we propose a GPU-based MC approach for physical-interaction simulation in the phantom; the gPSMC and gFSMC simulators have the same simulation process.
The parallel-computing advantage of the GPU was exploited to accelerate the physical-interaction simulation, as shown in Table 1. The total histories were divided into multiple batches based on the energy of the initial photons sampled from the photon initialization, with each batch having similar energies. Batch division is used only for categorizing photons of different energies to speed up the simulation process rather than for sampling the energies of the initial photons. Ten batches were used in this study. For photons within the same batch, multiple GPU kernels were launched to simulate the transport of all the photons simultaneously, with one kernel tracking the history of multiple photons sequentially. The actual energy deposited on each pixel of the detector was calculated using the detector response function. By accumulating the energy deposition of the same batch of photons arriving at the detector, the energy deposition of different batches and total energy deposition were obtained and transferred to the CPU to calculate the final projection.
| Parallel MC simulation |
|---|
| 1. Initialize kernels, histories and batches, clear counters; |
| 2. Divide total histories into multiple batches; |
| 3. for each batch do |
| 4. for each GPU kernel do |
| 5. Transfer multiple photons to the GPU kernel; |
| 6. end for |
| 7. Perform physical-interaction simulation for all photons in this batch simultaneously; |
| 8. Calculate energy deposition for each batch; |
| 9. end for |
| 10. Accumulate energy deposition for all batches, transfer energy deposition to CPU. |
A detailed physical-interaction simulation workflow for a single photon is shown in Fig. 6. The Woodcock tracking [37] method was utilized in this study to avoid calculating the intersection of the photon paths with each voxel boundary to speed up the simulation. During the simulation, the forward distance of the initial photon was sampled and a new interaction point was calculated. Next, random sampling was used for the Woodcock method to determine the interaction type at the current position, including the photoelectric effect, Compton scattering, Rayleigh scattering, and virtual interactions. If the photoelectric effect occurred, the simulation of this photon was terminated and the generated electrons were deposited in situ. When Compton or Rayleigh scattering occurred, the scattering direction and energy of the scattered photons were determined by sampling the DSC data. The photons remained unchanged in the virtual interaction, which was utilized to speed up the simulation process. After photon simulation at the current position was completed, the forward distance was sampled again, and the above steps were repeated until the photon was absorbed or moved out of the phantom. We also determined if the photons moving outside the phantom could reach the detector. The position at which a photon reached the detector was calculated and transformed to the detector coordinate system (Xd, Yd, Zd) to determine the detector pixel that was hit, and the deposited energy of the photon was recorded. Another stopping condition was set to terminate the simulation of the photons with energies below 1 keV. Through the simulation of physical interactions in the phantom, the final projection consisted of two parts: the primary signal, which underwent attenuation during the propagation of X-rays, and the scatter signal, which underwent a change in the direction of the photons.
Materials and evaluation
A series of simulated and real experiments were conducted to verify the accuracy and efficiency of the two proposed MC-based simulators, gPSMC and gFSMC, as well as the effectiveness of the PHSP optimization technique used in gPSMC-o. For accuracy verification, three MC simulators and the conventional ray-tracing approach were used to calculate the projections of the three simulated digital phantoms, which were compared with realistic acquired projections. For the efficiency assessment, the computational time consumption of the three MC simulators was compared with that of the ray-tracing approach for FPXS with different patterned arrays.
Water phantom experiment
A simulated water phantom was created, and the projections (primary signal) of the phantom under the same simulation conditions were calculated using gPSMC, gPSMC-o, gFSMC, and the ray-tracing approach. Fig. 7(a) shows a schematic of the water-phantom imaging system. The ray-tracing approach superimposed the projections calculated using different patterns to obtain the final projection, which was suitable for comparison with the MC simulator proposed in this study. The water phantom was a three-dimensional matrix with a Housfield unit (HU) value of 0, the size of the phantom was 6.00 cm × 6.00 cm × 10.00 cm, and the dimensions were 120 × 120 × 200. In the imaging system, two small patterned arrays of 4 × 4 and 6 × 6 were utilized for projection calculation and comparison, with a distribution area of 4.80 cm × 4.80 cm and spacings of 1.60 cm and 0.96 cm, respectively. The size of the detector was 12.00 cm × 12.00 cm and the resolution was 1548 × 1548. The digital water phantom was placed close to the detector, the SAD was set to 35 cm, and the SID was set to 40 cm. The inputs of gFSMC and the ray-tracing approach were the same energy spectrum and fluence map of FPXS, and the fluence was calculated based on gPSMC using an air phantom with a size of 12.00 cm × 12.00 cm × 40.00 cm and dimension of 60×60×200. To evaluate the projections calculated using the three methods quantitatively, the mean absolute percentage error (MAPE), contrast-to-noise ratio (CNR), and full width at half maximum (FWHM) were used to calculate the differences between the projections, which are defined as follows:

PMMA phantom experiment
To further verify the accuracy of the two MC simulators in the projection (primary signal + scatter signal) simulation of the entire FPXS (with patterned arrays of 600×600 and a center spacing of 80 μm), a PMMA phantom experiment was designed, and the projections calculated by gPSMC, gPSMC-o, and gFSMC for the two PMMA phantoms were compared with the realistic acquired projections. Figure 7(b) shows a schematic of the PMMA-phantom imaging system. The two simulated PMMA phantoms had the same volume and density as the realistic PMMA slabs, where the 4-cm-thick PMMA phantom comprised four PMMA slabs with a size of 10.00 cm × 15.00 cm× 1.00 cm, and the 6-cm-thick phantom comprised one PMMA slab with a size of 10.00 cm× 10.00 cm× 2.00 cm and four PMMA slabs with a size of 10.00 cm × 15.00 cm × 1.00 cm. The sizes of the two simulated PMMA phantoms were 10.00 cm × 15.00 cm × 4.00 cm and 10.00 cm × 15.00 cm × 6.00 cm with dimensions of 200 × 300 × 80 and 200 × 300× 120, respectively. A photograph of the PMMA projection-acquisition devices is shown in Fig. 7(c). Given the size of the PMMA slab, a flat-panel CMOS X-ray detector (Xineos-2329, Teledyne DALSA, USA) with an active area of 22.80 cm × 29.20 cm and resolution of 4608 × 5888 was used for projection acquisition. The detector for the PMMA projection simulation had the same dimensions and parameters as those of a realistic detector. During the PMMA projection simulation and acquisition, the two PMMA phantoms were placed close to the detector with the SID set to 40 cm and SAD set to 38 cm and 37 cm.
Line-pair phantom experiment
A simulated line-pair phantom was generated with reference to a real line-pair testing card (Type18D, IBA, Germany), and the MC-calculated projections (primary signal + scatter signal) were compared with the actual acquired projections. A schematic of the line-pair phantom imaging system is shown in Fig. 8(a). The line-pair testing card used in this study had a resolution range of 0.50 lp/mm to 20.00 lp/mm, and the simulated line-pair phantom comprised 21 types of line-pairs with different resolutions (0.50 lp/mm to 5.00 lp/mm), with a size of 4.00 cm× 4.00 cm× 0.68 cm and dimension of 4000× 4000× 8. Figure 8(b) shows the simulated line-pair phantom. A line-pair phantom was utilized to investigate the variation in imaging resolution with the distance between the FPXS and detector, where the axis-to-imager distance (AID) remained unchanged (0.34 cm) and the SID varied from 16 to 90 cm, with a total of 13 groups. In the process of collecting realistic projections, a line-pair testing card and flat-panel CMOS X-ray detector (Xineos-1515, Teledyne DALSA, USA) were used for the projection acquisition of the FPXS. Figure 8(c) shows a photograph of the projection-acquisition devices, including the detector, lifting platform, and metal frame. The detector had an active area of 15.30 cm × 15.30 cm, a pixel size of 99.00 μm × 99.00 μm, and a resolution of 1548× 1548. The line-pair card was fixed at the center of the detector surface, and realistic projections at different SIDs from 16 to 90 cm were acquired and compared with the projections calculated using the three MC simulators.

To quantitatively evaluate the difference between the acquired and MC-calculated projections as well as the difference in the exact line-pair values, the contrast transfer-function (CTF) curve and maximum line-pair values corresponding to the 10% CTF curve were calculated, where the CTF curve reflects the square-wave response of the imaging system at different frequencies [38]. To calculate the CTF, the modulation value M0 at zero frequency was first calculated using high attenuation and background regions of the same size. Then, M0 was used to normalize M(ω) to obtain the discrete CTF(ω). ω is the spatial frequency (lp/mm) in one direction. The value corresponding to 10% CTF is the desired maximum line-pair value. CTF(ω) was calculated as follows:
Results
Water phantom experiment
The projections calculated using the ray-tracing approach and the gPSMC, gPSMC-o, and gFSMC simulators under two small patterned arrays of 4×4 and 6×6 are shown in Fig. 9(a)-(d), (j)-(m). The simulated histories were 5×10⁹ for all three simulators. The projection comparison showed that the projections calculated by the ray-tracing approach and gPSMC-o simulator were similar to those calculated by gPSMC, and the image quality of the projections calculated by gFSMC was better. All four error maps in Fig. 9(f)-(h) and (o)-(q) show larger errors in the central region. However, due to the gray values in the central region were close to 0, which affects the MAPE calculation, we performed MAPE calculations for the surrounding regions, and the results were 3.27%, 2.78%, 9.32%, 2.72%, 2.24%, and 6.50% for Fig. 9(f)-(h) and, (o)-(q), respectively. In addition, to explore the noise magnitude of the projections calculated using the four methods, five ROIs (orange boxes) were selected for each projection to calculate the CNR values, which were 9.69, 9.56, 36.57, 9.68, 14.27, 14.23, 40.05, 14.26 for Fig. 9(a)-(d) and (j)-(m), respectively. The results illustrated the same noise magnitude in the projections calculated using the ray-tracing approach, gPSMC, and gPSMC-o, whereas the gFSMC-calculated projections exhibited very little noise. The enlarged figures in the green boxes show the penumbras of the projections calculated by the four methods, all of which can be observed for the same number of penumbras. Fig. 9(e), (i), (n), and (r) depict the profiles of the four projections on the horizontal and vertical midlines (red and blue dashed lines, respectively), and the comparison indicated that the penumbra edges of the four projections were almost consistent. Quantitative comparisons also showed that the differences in FWHM values between the profiles of the three MC-simulated projections and the ray-tracing-calculated projection were less than 1.50%.

PMMA phantom experiment
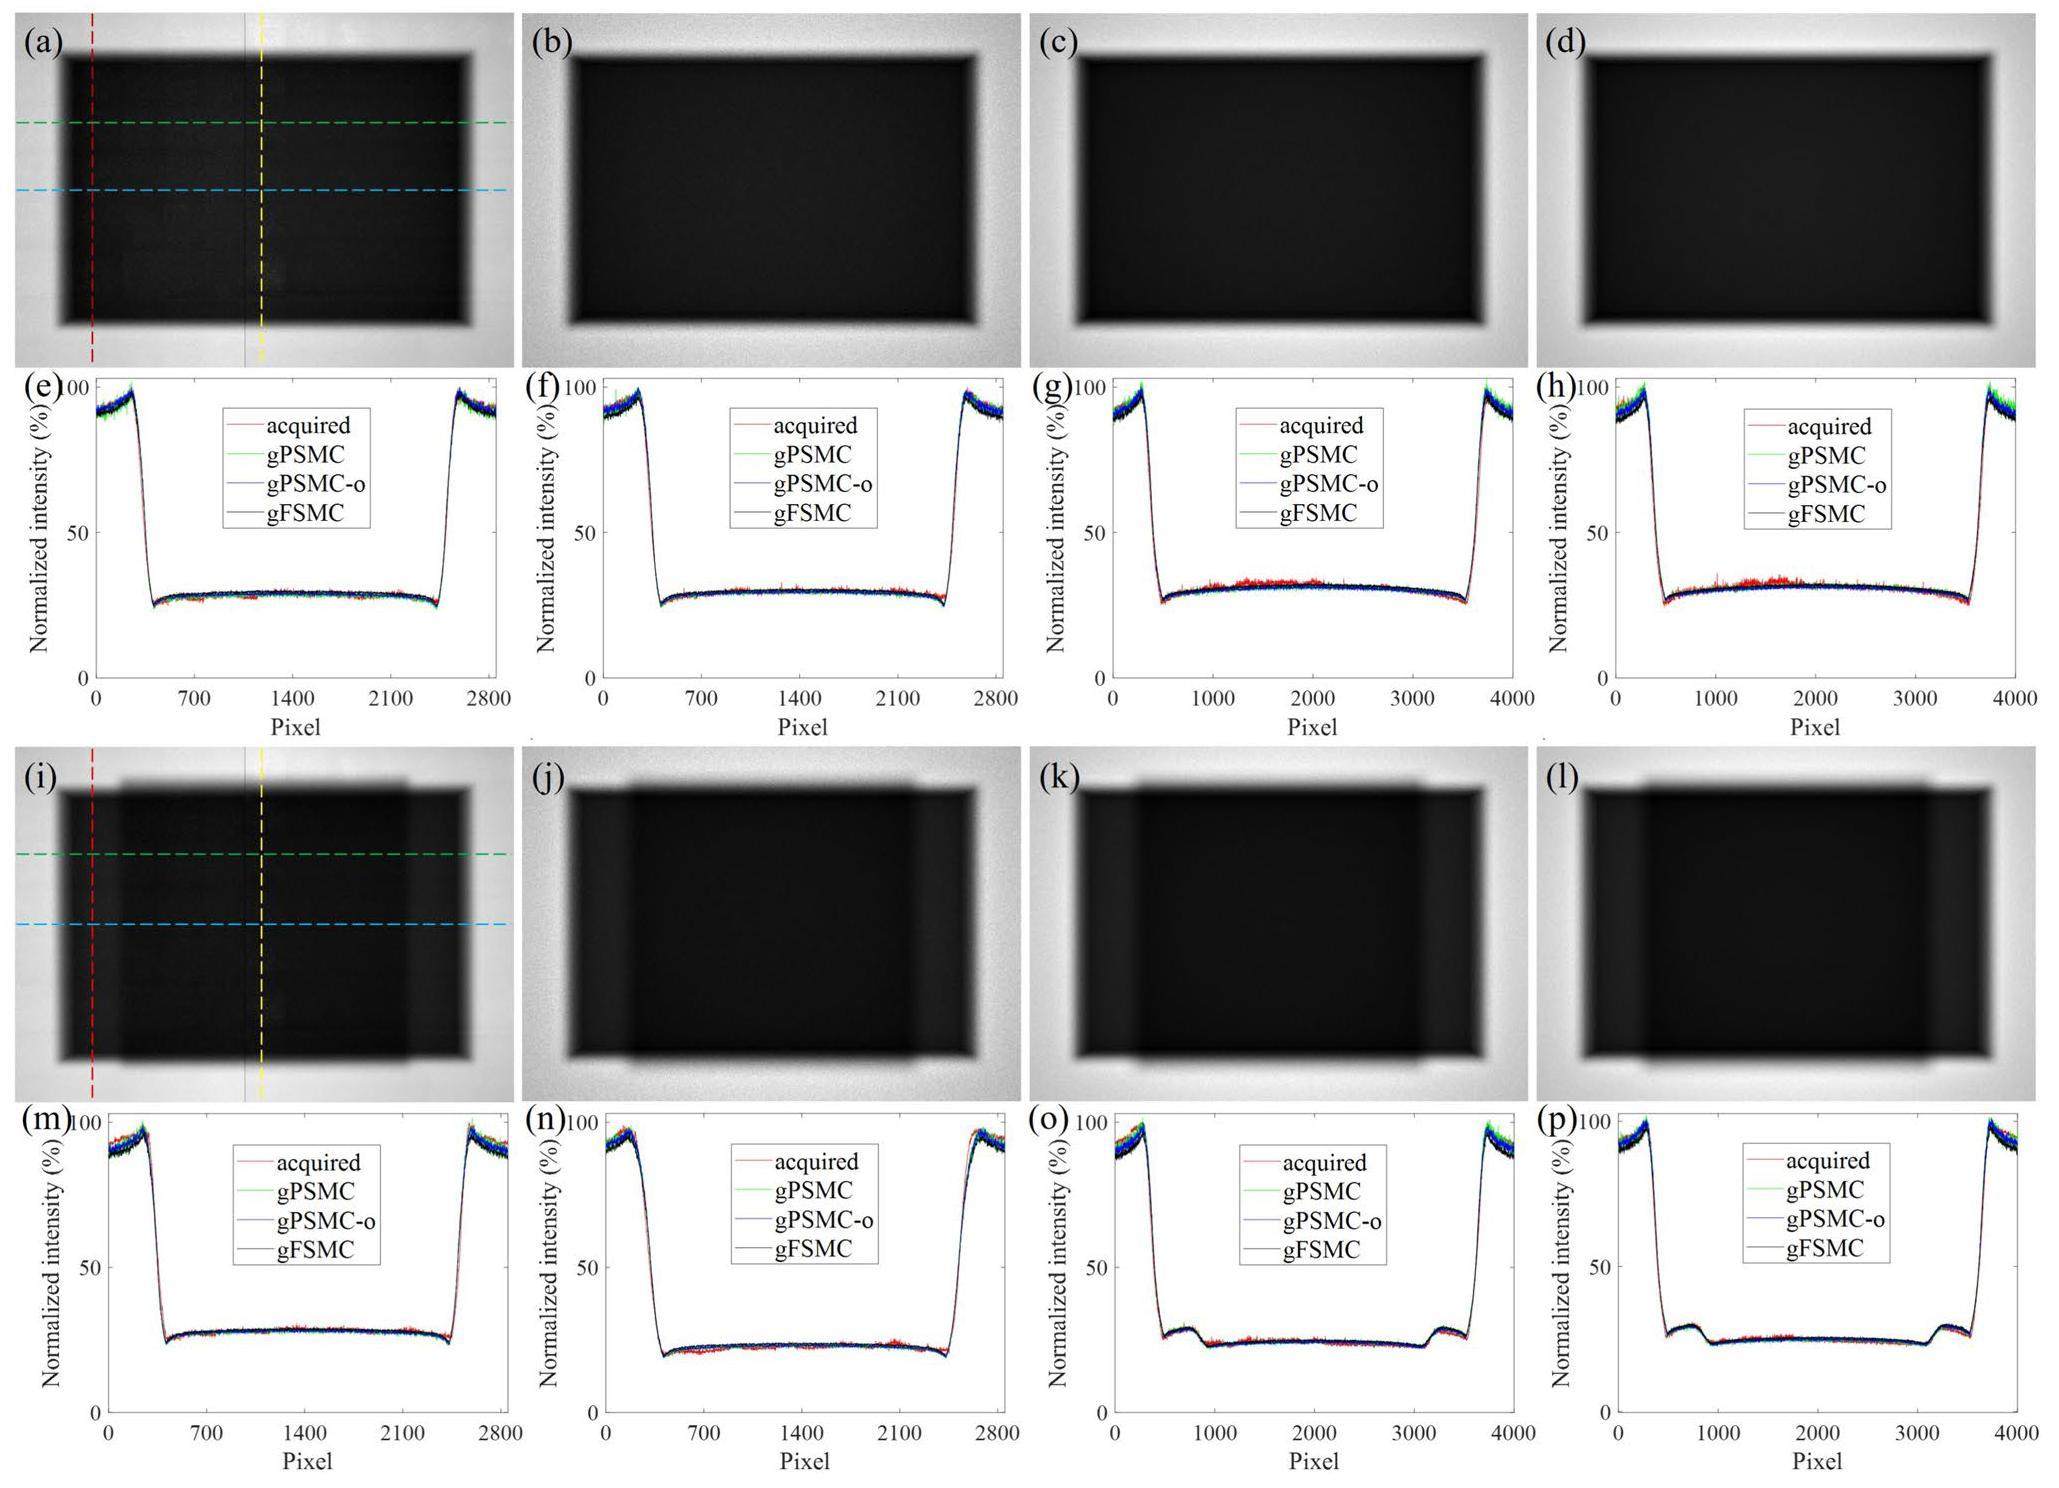
Projection calculations were performed using three simulators, gPSMC, gPSMC-o, and gFSMC, for the 4-cm-thick and 6-cm-thick PMMA phantoms, with simulated histories of 5×10¹⁰ in this experiment. The projections calculated using the three simulators were compared with the acquired projections of realistic PMMA slabs, as shown in Fig. 10. The projection comparison shown in Fig. 10(a)-(d) and (i)-(l) indicates that the projections calculated using the three simulators were similar to the acquired projections. The profiles of the measured and calculated projections in the vertical (red and yellow lines) and horizontal (green and blue lines) directions were extracted and compared, as shown in Fig. 10(e)-(h) and (m)-(p). The profile comparison showed consistency between the calculated and acquired projections, except for the partial error of the profiles in the central region of the acquired projections. A quantitative comparison of the profiles indicated that the differences in the FWHM between the calculated and acquired projections were less than 0.8% for all profiles.
Line-pair phantom experiment
Qualitative comparison
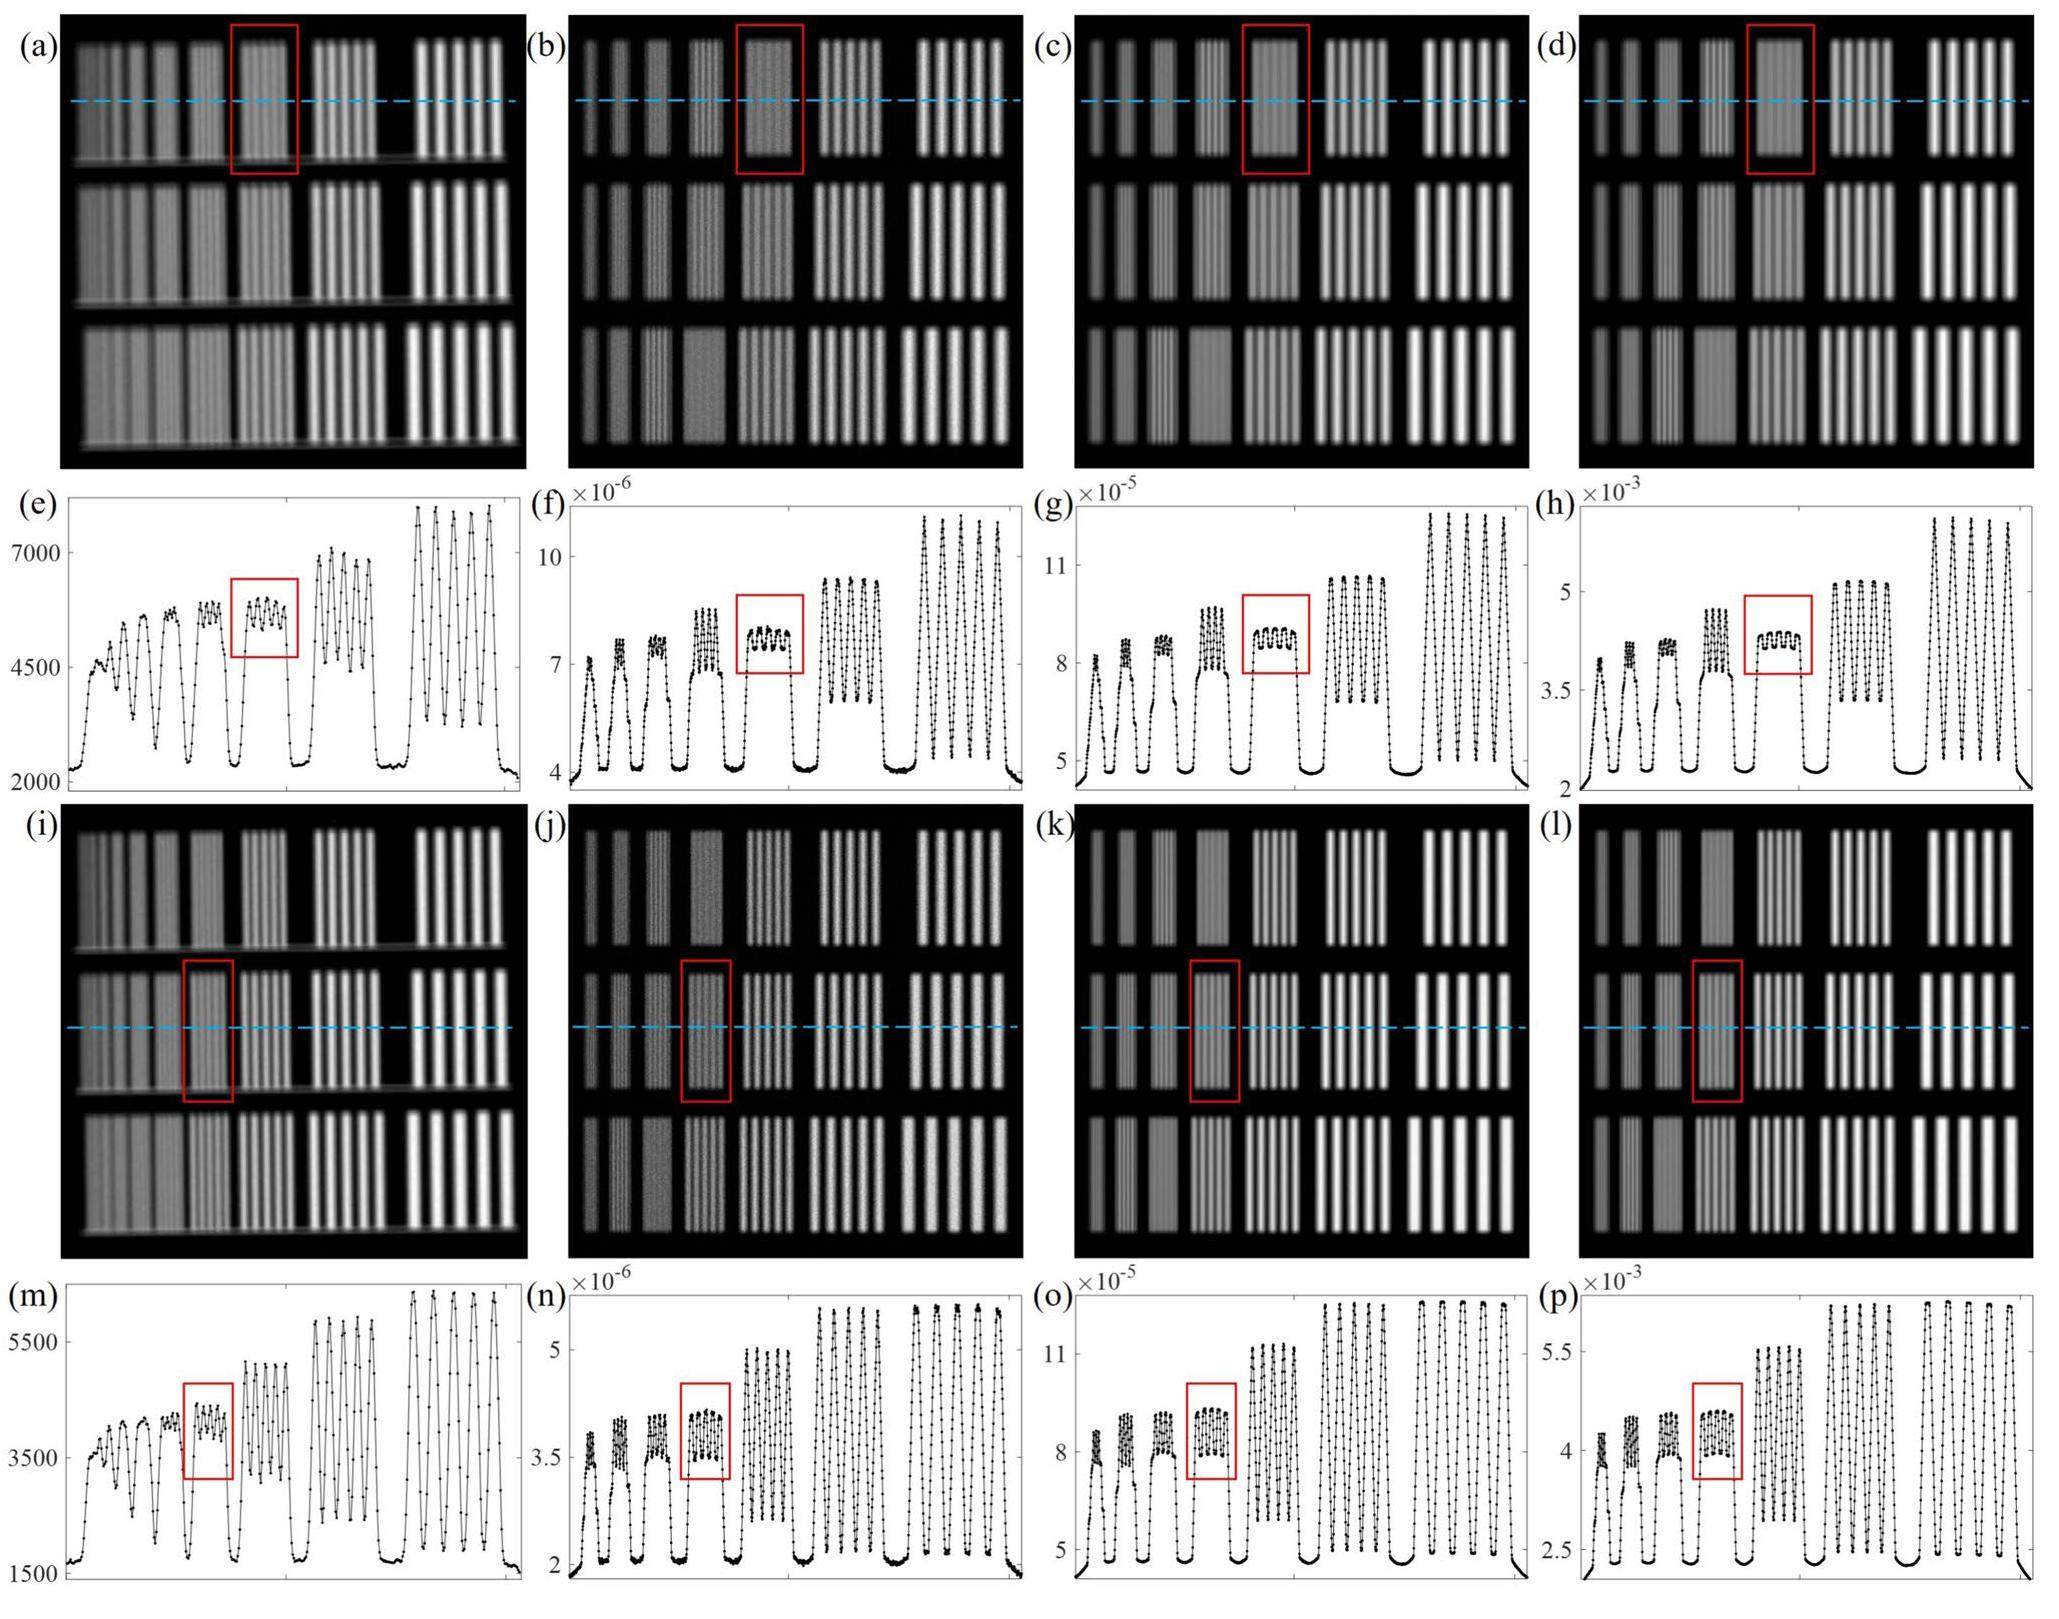
The gPSMC, gPSMC-o, and gFSMC simulators were used to calculate the projections of the simulated line-pair phantom with simulated histories of 1×10¹², and the projections were compared with the actual acquired projections of the line-pair testing card. In the line-pair phantom experiment, the simulated line-pair phantom and actual testing card were fixed close to the detector, and the projections were calculated and acquired under an SID from 16 to 90 cm. Figure 11(a)-(d) show the acquired and calculated projections using gPSMC, gPSMC-o, and gFSMC at SID = 35 cm. The maximum line pairs that can be recognized in the projections are marked in red boxes, and the line-pair values for all four projections reached up to 1.25 lp/mm. The profiles of the four projections represented by the blue line are shown in Fig. 11(e)-(h), from which five distinct peaks (red boxes) at the maximum line pair can be clearly recognized. Figure 11(i)-(l) present the projection comparison at SID = 50 cm, with maximum line-pair values of 1.60, 1.61, 1.61, and 1.61 lp/mm, respectively. The profiles in Fig. 11(m)-(p) exhibit five distinct peaks. The maximum line-pair values of the calculated and acquired projections for the different SIDs were the same. The projection and profile comparisons also indicated that the gPSMC-o- and gFSMC-calculated projections were less noisy than that of gPSMC, and the edges of the line pairs in the projection were sharper.
Quantitative evaluation
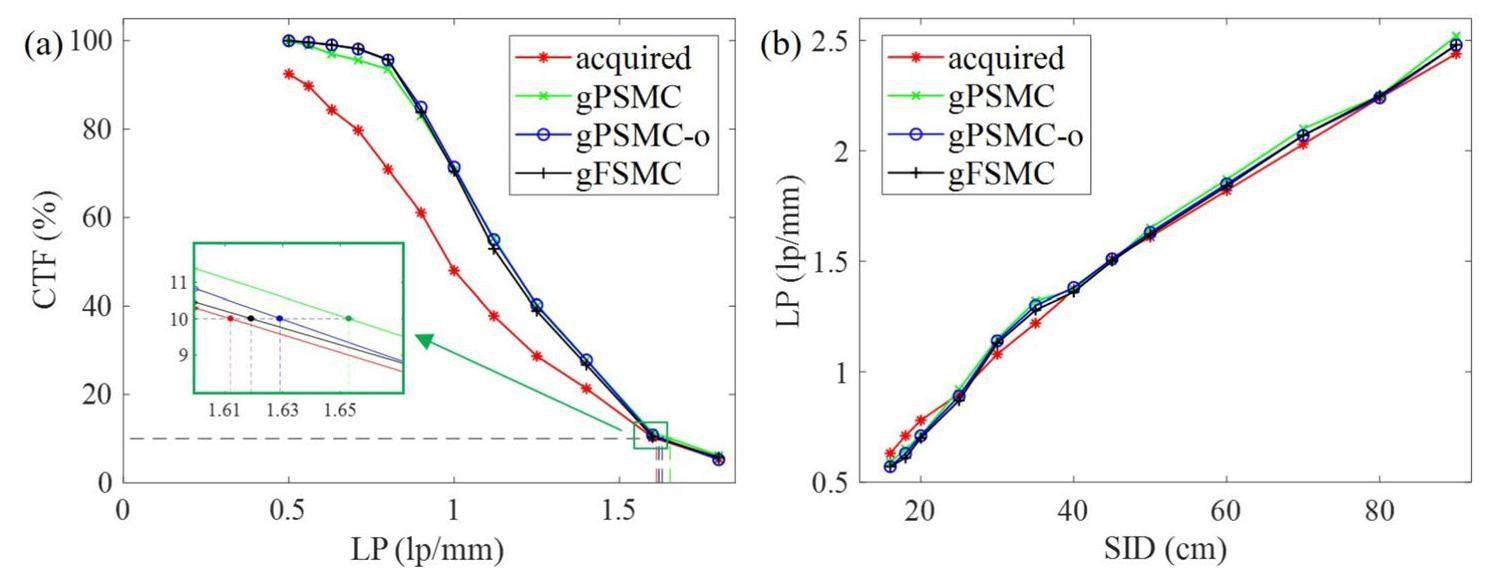
For each calculated and acquired projection, the maximum line-pair values were quantitatively evaluated. Specifically, the CTF values were calculated for all line pairs at the corresponding frequencies in each projection, and the CTF curves were plotted. Figure 12(a) shows the CTF curves for the acquired and simulated projections at an SID of 50 cm. The line-pair values of the acquired and calculated projections start from 0.50 lp/mm, and the CTF values decrease gradually with an increase in line-pair values. For the acquired projections, M0 was calculated based on the specific no-lead and background regions in the projections, whereas for the simulated projection, the CTF of the 0.50 lp/mm line pair was taken as M0. For line pairs with low frequencies, the CTF values of the gPSMC-, gPSMC-o-, and gFSMC-calculated projections were close to 100% and decreased gradually as the line-pair values increased. Moreover, the CTF curves of gPSMC, gPSMC-o, and gFSMC were consistent. The inset (green box) in Fig. 12(a) presents the 10% CTF values for the acquired and calculated projections at an SID of 50 cm, which were 1.61, 1.65, 1.63, and 1.62 lp/mm. Figure 12(b) summarizes the maximum line-pair values (10% CTF values) of the acquired and calculated projections for different SIDs. The line-pair values of the acquired and calculated projections were consistent, with errors of 4.13%, 3.86%, and 4.15%. Moreover, all maximum line-pair values increased with increasing SID, which indicated that the imaging resolution increased with increasing imaging distance while keeping the AID unchanged.
Computation-time analysis
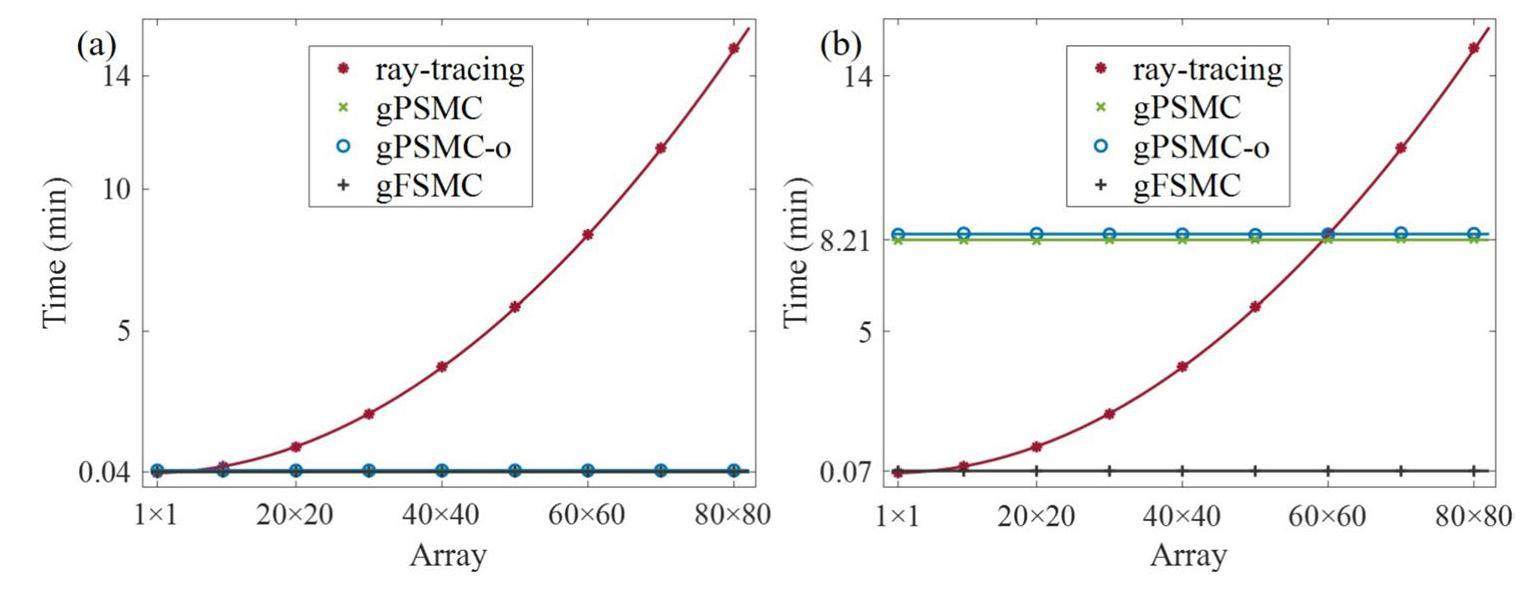
The times required for the projection calculation of the water phantom using gPSMC, gPSMC-o, gFSMC, and the ray-tracing approach under different patterned arrays were compared. All the calculations were performed on the same computer with an NVIDIA GeForce RTX 4090 GPU (24 GB memory, 16384 CUDA kernels). A total of 5×10⁹ histories were simulated for the three MC simulators. The parameters of the simulated water phantom and imaging system were the same as those in Section 2.3.1, and the size of the simulated patterned arrays in the FPXS gradually increased from 1×1 to 600×600. The pure computation time on the GPU and the total time consumed (including the time spent on physical file loading) were calculated using the four methods summarized in Table 2. Based on the photon-initialization approaches proposed in gPSMC and gFSMC, the number of patterned arrays in the FPXS had no effect on the computation time, which was only related to the number of simulated histories. For gPSMC, the average pure computation time was 0.04 min, and the average total time was 8.21 min. Therefore, loading all the physical files, including the PHSP, took approximately 8.17 min. For gPSMC-o, the average pure computation time and average total time were 0.09 min and 8.41 min, just 0.03 min and 0.20 min more than gPSMC, respectively. For gFSMC, the average pure computation time and average total time were 0.04 min and 0.07 min, respectively, and only 0.03 min were required to perform the physical file loading (excluding PHSP data). For the same number of simulated histories, little difference was observed in the pure computation times of the three simulators proposed in this study. In contrast, the ray-tracing approach must calculate projections at the center of each pattern; therefore, the computation time increased proportionally with the number of patterns and exponentially with the size of the patterned arrays. A comparison of the pure computation times and total computation times under different patterned arrays for the four methods and the fitting curves with the array size are depicted in Fig. 13. For the 2.7-inch FPXS with a patterned array of 600×600, approximately 13.98 h were required to calculate the projection using the ray-tracing approach, which was approximately 100 and 12000 times longer than the times required for gPSMC and gFSMC, respectively. For a 4-inch FPXS with a patterned array of 900×900, the ray-tracing approach required approximately 230 and 27000 times longer to calculate the projection than gPSMC and gFSMC, respectively.
| 1×1 | 10×10 | 20×20 | 30×30 | 40×40 | 50×50 | 60×60 | 70×70 | 80×80 | 600×600 | |
|---|---|---|---|---|---|---|---|---|---|---|
| Spacing (mm) | - | 5.33 | 2.53 | 1.66 | 1.23 | 0.98 | 0.81 | 0.7 | 0.61 | 0.08 |
| gPSMC cal (min) | 0.04 | 0.04 | 0.04 | 0.04 | 0.04 | 0.04 | 0.04 | 0.04 | 0.04 | 0.04 |
| gPSMC all (min) | 8.19 | 8.20 | 8.18 | 8.21 | 8.21 | 8.22 | 8.22 | 8.24 | 8.23 | 8.20 |
| gPSMC-o cal (min) | 0.09 | 0.09 | 0.09 | 0.09 | 0.09 | 0.09 | 0.09 | 0.09 | 0.09 | 0.09 |
| gPSMC-o all (min) | 8.39 | 8.43 | 8.42 | 8.40 | 8.40 | 8.38 | 8.40 | 8.44 | 8.42 | 8.45 |
| gFSMC cal (min) | 0.04 | 0. 04 | 0. 04 | 0. 04 | 0. 04 | 0. 04 | 0.04 | 0.04 | 0.04 | 0. 04 |
| gFSMC all (min) | 0.07 | 0.07 | 0.07 | 0.07 | 0.07 | 0.07 | 0.07 | 0.07 | 0.07 | 0.07 |
| ray-tracing (min) | 0.003 | 0.23 | 0.92 | 2.08 | 3.75 | 5.86 | 8.4 | 11.45 | 14.98 | 839(est.) |
Discussion
To solve the problem of the analytical ray-tracing approach not being applicable to the projection computation of FPXS, we developed two MC-based projection-calculation simulators and constructed an accuracy evaluation and efficiency assessment. Both of the two simulators, gPSMC and gFSMC, implemented imaging system modeling and accurate projection simulations of FPXS; however, they differed in the photon-initialization process. The gPSMC calculated the state of the initial photons using pattern sampling and PHSP sampling techniques, whereas energy-spectrum sampling and fluence-map sampling techniques were proposed for the gFSMC. Furthermore, gPSMC-o incorporated the PHSP optimization technique into the gPSMC simulator to improve the utilization of the initial photons. The different inputs and initialization processes of gPSMC and gFSMC enabled different application scenarios. In a scenario in which measuring the energy spectrum and fluence map is convenient, the gFSMC simulator is suitable for calculating the projection of the FPXS in a short computation time. In scenarios where measurements cannot be acquired and only MC simulations are available to obtain simulator inputs, gPSMC is suitable for calculating projections, whereas gFSMC requires additional processing of the PHSP to calculate the energy spectrum and fluence map, resulting in additional time consumption. In addition, the proposed gPSMC simulator used the output of the pattern modeling performed by BEAMnrc as the input to the GPU-based MC module, which was assumed to be the most accurate of the three simulators. Consequently, the gPSMC-calculated projection could be used as the ground truth in some cases to validate the precision of the other methods. The accuracies of the three simulators were verified by comparing the calculated projections of the three simulators with the analytical ray-tracing approach and acquired realistic projections. In addition, a comparison of the computation time between the three simulators and ray-tracing approach under the same phantom was conducted, and the advantages of all the proposed MC-based simulators were analyzed for the projection simulation of FPXS.
In the water phantom experiment, the projections calculated using the ray-tracing approach and gPSMC-o were similar to those calculated using the gPSMC simulator, with MAPE values of less than 4.00%; however, the MAPE values for the gFSMC-calculated projection were higher than 6.00%. The projections calculated using the three simulators and ray-tracing approach had consistent profiles with FWHM values of less than 1.50%. In addition, a comparison of CNR values indicated the same noise magnitude in projections calculated using gPSMC, gPSMC-o, and the ray-tracing approach as well as a lower noise magnitude in gFSMC-calculated projections. With the same small patterned arrays and number of simulated histories in the three simulators, more photons in gFSMC reached the detector, resulting in less noise in the projection and larger MAPE values than those of the gPSMC simulator. In the PMMA phantom experiment, the projections calculated using the three simulators for the two PMMA phantoms under the entire source were similar to the acquired projections, and the profiles were identical, with FWMH values less than 0.80%. In the line-pair phantom experiment, the projections calculated using the three MC simulators and acquired projections showed consistent maximum identifiable line-pair values at different SIDs, as well as distinct wave crests in the profiles. With the PHSP optimization technique added to gPSMC-o, the noise in the line-pair projection was reduced compared to gPSMC. A comparison of the CTF curves calculated under different SIDs also illustrated that the maximum identifiable line-pair values of the projections calculated using the three simulators were similar to those of the acquired projections, with an error of less than 5.00%, and all line-pair values increased as the SID increased. Regarding the comparison of computation times, the pure computation times of the three simulators were comparable, and the total computation times of gPSMC and gPSMC-o were also relatively similar. The total computation times of gPSMC and gFSMC were 1/100 and 1/12000 that of the ray-tracing approach for the 2.7-inch FPXS with a patterned array of 600×600, and 1/230 and 1/27000 that of the 4-inch FPXS with a patterned array of 900×900.
Although the two proposed MC-based simulators were validated in terms of accuracy and efficiency, several issues still need to be discussed. First, gPSMC requires more time to import the physical files compared to the pure computation time (8.17 min vs. 0.04 min). The main reason for this is that the PHSP file is too large, resulting in increased data-import time and memory. Although the proposed PHSP-optimization technique screens the initial photons, this step must also be performed after loading the PHSP data. Therefore, other methods to speed up physical file import must be considered, such as a faster hard disk, a graphics card with a larger video memory, or optimized PHSP storage methods. Another issue that needs to be discussed is the generation of fluence used in the gFSMC simulator and the ray-tracing approach. Two methods were used to generate fluence in this study. The first was to take the realistic projection acquired at particular distances as the fluence. This method required the fabrication of the FPXS with a specific patterned array and the measurement of fluence at a specific distance from the detector, which implies a large workload and cost. Moreover, special attention should be paid to noise effects in the acquired projections. The second method used in this study was to calculate the projection of the source under a particular depth of air using the MC method, which was fast and convenient, but not as accurate as using the actual fluence. In future work, we will explore accurate and convenient fluence-calculation methods and further investigate the application of fluence in FPXS imaging.
Conclusion
Since the analytical ray-tracing approach is not applicable to the projection computation of FPXS, two MC-based simulators, gPSMC and gFSMC, were proposed for the imaging-system modeling and projection simulation of FPXS. The accuracy and computational-time evaluation demonstrated the improved efficiency and accuracy of the two proposed MC-based simulators over the traditional analytical ray-tracing approach for the projection simulation of large-area FEAs.
X-ray computed tomography
. Phys. Med. Biol. 51, R29 (2006). https://doi.org/10.1088/0031-9155/51/13/R03An outlook on x-ray CT research and development
. Med. Phys. 35, 1051-1064 (2008). https://doi.org/10.1118/1.2836950Medical X-ray sources now and for the future
. Nucl. Instrum. Methods Phys. Res. Sect. A-Accel. Spectrom. Dect. Assoc. Equ 873, 43-50 (2017). https://doi.org/10.1016/j.nima.2017.05.038Beam and image experiment of beam deflection electron gun for distributed X-ray sources
. Nucl. Sci. Tech. 30, 1-12 (2019). https://doi.org/10.1007/s41365-019-0561-yCarbon nanotubes as electron source in an x-ray tube
. Appl. Phys. Lett. 78, 2578-2580 (2001). https://doi.org/10.1063/1.1367278A compact X-ray tube with a field emitter based on carbon nanotubes
. J. Commun. Technol. Electron. 52, 714-716 (2007). https://doi.org/10.1134/S1064226907060186Improvements to conventional X-ray tube-based cone-beam computed tomography system
. Nucl. Sci. Tech. 29, 43 (2018). https://doi.org/10.1007/s41365-018-0370-8Stable, high density field emission cold cathode
. J. Appl. Phys. 31, 782-789 (1960). https://doi.org/10.1063/1.1735699Generation of continuous and pulsed diagnostic imaging x-ray radiation using a carbon-nanotube-based field-emission cathode
. Appl. Phys. Lett. 81, 355-357 (2002). https://doi.org/10.1063/1.1492305Addressable flat-panel x-ray sources for medical, security, and industrial applications
.Nitrogen incorporated ultrananocrystalline diamond based field emitter array for a flat-panel x-ray source
. J. Appl. Phys. 115, 134506 (2014). https://doi.org/10.1063/1.4870928Transmission type flat-panel X-ray source using ZnO nanowire field emitters
. Appl. Phys. Lett. 107, 243105 (2015). https://doi.org/10.1063/1.4938006A double-sided radiating flat-panel X-ray source using ZnO nanowire field emitters
. Vacuum 144, 266-271 (2017). https://doi.org/10.1016/j.vacuum.2017.08.015Diagonal 4-in ZnO nanowire cold cathode flat-panel X-ray source: Preparation and projection imaging properties
. IEEE Trans. Nucl. Sci. 68, 338-345 (2021). https://doi.org/10.1109/TNS.2021.3051008Fundamental physics of vacuum electron sources
. Rep. Prog. Phys. 69, 181 (2005). https://doi.org/10.1088/0034-4885/69/1/R04Tungsten target optimization for photon fluence maximization of a transmission-type flat-panel X-ray source by Monte Carlo simulation and experimental measurement
. IEEE Trans. Radiat. Plasma Med. Sci. 2, 452-458 (2018). https://doi.org/10.1109/TRPMS.2018.2849099Fully Vacuum-Sealed Diode-Structure Addressable ZnO Nanowire Cold Cathode Flat-Panel X-ray Source: Fabrication and Imaging Application
. Nanomaterials 11, 3115 (2021). https://doi.org/10.3390/nano11113115Fabrication of large-area ZnO nanowire field emitter arrays by thermal oxidation for high-current application
. Appl. Surf. Sci. 484, 966-974 (2019). https://doi.org/10.1016/j.apsusc.2019.04.169High current field emission from large-area indium doped ZnO nanowire field emitter arrays for flat-panel X-ray source application
. Nanomaterials 11, 240 (2021). https://doi.org/10.3390/nano11010240Pulsed voltage driving enhanced electron emission in ZnO nanowire cold cathode flat-panel X-ray source
. Vacuum 199, 110970 (2022). https://doi.org/10.1016/j.vacuum.2022.110970Transparent Flat Panel X-Ray Source Using ITO Transmission Anode and ZnO Nanowire Cold Cathode
. IEEE Trans. Electron Devices 70, 3302-3307 (2023). https://doi.org/10.1109/TED.2023.3267757Deep learning based de-overlapping correction of projections from a flat-panel micro array X-ray source: Simulation study
. Phys. Medica 111, 102607 (2023). https://doi.org/10.1016/j.ejmp.2023.102607Image quality of the proton imaging from computer-simulated data
. Nucl. Sci. Tech. 21, 20-23 (2010). https://doi.org/10.13538/j.1001-8042/nst.21.20-23A review of GPU-based medical image reconstruction
. Phys. Medica 42, 76-92 (2017). https://doi.org/10.1016/j.ejmp.2017.07.024The beer-lambert law
. J. Chem. Educ. 39, 333 (1962). https://doi.org/10.1021/ed039p333The modified Beer–Lambert law revisited
. Phys. Med. Biol. 51, N91 (2006). https://doi.org/10.1088/0031-9155/51/5/N02ImaSim, a software tool for basic education of medical X-ray imaging in radiotherapy and radiology
. Front. Physics 1, 22 (2013). https://doi.org/10.3389/fphy.2013.00022Rapid simulation of X-ray scatter measurements for threat detection via GPU-based ray-tracing
. Nucl. Instrum. Methods Phys. Res. Sect. B-Beam Interact. Mater. Atoms 449, 86-93 (2019). https://doi.org/10.1016/j.nimb.2019.03.006THUDose PD: a three-dimensional Monte Carlo platform for phantom dose assessment
. Nucl. Sci. Tech. 34, 164 (2023). https://doi.org/10.1007/s41365-023-01315-yAccelerating Monte Carlo simulations of photon transport in a voxelized geometry using a massively parallel graphics processing unit
. Med. Phys. 36, 4878-4880 (2009). https://doi.org/10.1118/1.3231824Study of a GPU-based parallel computing method for the Monte Carlo program
. Nucl. Sci. Tech. 25, S010501 (2014). https://doi.org/10.13538/j.1001-8042/nst.25.S010501GPU-based cross-platform Monte Carlo proton dose calculation engine in the framework of Taichi
. Nucl. Sci. Tech. 34, 77 (2023). https://doi.org/10.1007/s41365-023-01218-yA GPU tool for efficient, accurate, and realistic simulation of cone beam CT projections
. Med. Phys. 39, 7368-7378 (2012). https://doi.org/10.1118/1.4766436A correlated sampling-based Monte Carlo simulation for fast CBCT iterative scatter correction
. Med. Phys. 50, 1466-1480 (2023). https://doi.org/10.1002/mp.16073Large efficiency improvements in BEAMnrc using directional bremsstrahlung splitting: directional bremsstrahlung splitting
. Med. Phys. 31, 2883-2898 (2004). https://doi.org/10.1118/1.1788912Monte Carlo assessment of parameter uncertainty in conceptual catchment models: the Metropolis algorithm
. J. Hydrol. 211, 69-85 (1998). https://doi.org/10.1016/S0022-1694(98)00198-XPerformance of Woodcock delta-tracking in lattice physics applications using the Serpent Monte Carlo reactor physics burnup calculation code
. Ann. Nucl. Energy 37, 715-722 (2010). https://doi.org/10.1016/j.anucene.2010.01.011A comparison of the ball, wire, edge, and bar/space pattern techniques for modulation transfer function measurements of linear x-ray detectors
. J. X-Ray Sci. Technol 6, 205-221 (1996). https://doi.org/10.3233/XST-1996-6207The authors declare that they have no competing interests.

