Introduction
Radiotherapy is among the most efficient cancer treatments, and approximately 80% of cancer patients require radiotherapy during treatment [1]. In recent years, proton therapy has gained increasing interest owing to its superior physical properties compared to conventional radiotherapy [2-7]. The dose of the proton beams increases slowly with depth within the entrance region and drastically increases at the end of the range, forming a Bragg peak. Thereafter, it declines rapidly in the distal fall-off region [8-10]. Because of the advantage of the Bragg peak in the physical dose, a proton beam can accurately deliver a dose to the target volume and improve dose distribution and target volume conformality. This further protects patients and reduces damage to adjacent normal tissue caused by radiotherapy. Therefore, proton therapy is superior to traditional photon therapy for the treatment of tumors located close to organs at risk (OAR) [11-13]. Owing to the distinctive dose distribution of proton beams and the high sensitivity of the proton beam range to Hounsfield Unit(HU) values, proton therapy requires more frequent imaging information to improve the effect of therapy and reduce physical uncertainties [14, 15].
Owing to the rapid development of radiation and medical imaging technologies, the era of image-guided therapy is constantly developing in the field of radiotherapy. Utilizing a vast array of applicable and effective technologies ensures that the radiation dose corresponds to the anatomical structure of the radiation target to the greatest extent possible, thereby improving the treatment quality [16-18]. Cone-beam computed tomography (CBCT) has become among the most important components of image guidance equipment in the field of medical image guidance technology because of its multiple advantages, such as short scanning time, high spatial resolution, low exposure dose, and the ability to be located at the treatment site [19, 20]. CBCT is typically used either daily or weekly to verify patient position and monitor the patient’s anatomical structural changes. The patient need not be moved to avoid errors in positioning over the course of treatment. However, CBCT is a three-dimensional image reconstructed from two-dimensional projection images, and its scattering noise artifacts are more severe than those produced by conventional fan-beam CT (FBCT). Moreover, the CBCT imaging method is not promising for clinical dose calculations. However, CBCT is typically performed on patients during radiation treatment, although the CBCT images contain severe artifacts. The relatively more accurate results of dose calculations based on CBCT images would provide more medical information about the anatomical changes in patients [21-24].
In recent years, many studies have been conducted to reduce the noise in CBCT images. Theoretically, the HU values in CBCT images can be recovered by deforming the planning CT(pCT) images using deformable image registration (DIR) [25-28]. However, the DIR-based methods are complicated and require careful evaluation. Once the anatomical structure of the patient changes significantly, the accuracy of DIR for CBCT image improvement is limited [29]. The process of generating an image using DIR can take a few minutes to complete. The other frequently used method is the intensity correction method, which scales CBCT image intensities to the HU range of pCT images using population-based lookup tables. However, the limitations of this method are intrinsic to CBCT, specifically the shadowing effect artifacts, which cannot be corrected by the intensity correction method [30]. The application of the Monte Carlo (MC) method for CBCT noise reduction has also been investigated. MC-based correction techniques, which may require hours for calculation, are not suitable for clinical applications in adaptive radiotherapy [31], although this method has good performance, and certain GPU-based MC dose calculation methods have reduced computational cost [32]. With the development of computer technology and artificial intelligence, the application of artificial intelligence technologies for CBCT noise reduction has garnered attention. The use of deep learning as a method for CBCT noise reduction offers various benefits, including excellent image quality, continual learning, and quick computation after the model has been trained. CBCT and CT image noise-reduction technologies have been improved using techniques based on convolutional neural networks (CNNs) [33, 34]. Ronneberger et al. developed a U-Net network architecture in 2015 [35] that demonstrated exceptional performance in applications involving biological segmentation. In 2020, based on U-Net, Chen et al. created sCTU-Net for CBCT noise reduction and realized the function of CBCT to CT. The sCTU-Net may enable improved CBCT technology to be employed in adaptive treatment planning [36].
This study developed a CBAM-U-Net network that integrates convolutional block attention modules, also known as CBAM blocks, into sCTU-Net down-sampling and up-sampling modules [37]. In this small module, the feature map was assigned different weights to increase the accuracy of the output results. The noise reduction performance of the proposed network was evaluated using the mean absolute error (MAE), root mean square error (RMSE), peak signal-to-noise ratio (PSNR), and structural similarity (SSIM). In addition to the traditional image evaluation, the IDD curve analysis of a single-energy proton beam and the γ-index pass rate of the proton beam square field and simple plan were used to evaluate the performance of the network in noise reduction. This technology will be used in the CBCT imaging system of the proton therapy center [38] at Ruijin Hospital after verification.
Materials and Methods
Dataset and image preprocessing
The preliminary data processing in this study was based on the analysis of the original data, which included 1477 head and neck CT slices and 1477 CBCT slices obtained from a cohort of 20 different patients. The original CBCT images were processed using the Varian iCBCT technology for noise reduction during image acquisition. The tube voltage for CT was 120 kVp and CBCT was 100 kVp. The voxel size of the CT images was 0.511 mm × 0.511 mm × 1.989 mm with an image resolution of 512×512. Further, the voxel size of CBCT images was 0.976 mm × 0.976 mm × 3 mm with an image resolution of 512 × 512.
The acquisition time of CBCT images is about one month after that of CT images. Owing to the different acquisition times of the CT and CBCT images, there was a minor difference in deformation. Therefore, image registration between CT and CBCT images is required. The anatomical deformation registration technique was selected in 3D Slicer software and optimized using an adaptive stochastic gradient descent algorithm [39]. The CT images were registered to the CBCT images to maintain the anatomical geometry consistent, and the registered CT images were resampled to a resolution of 0.976 mm × 0.976 mm × 3 mm, the same with the CBCT images.
In this study, we strictly followed the registration results to produce CT-CBCT image pairs for training and testing. We randomly selected 1267 CT-CBCT image pairs from 17 patients as the training datasets and 210 CBCT-CT image pairs from the remaining three patients as the testing datasets where each patient dataset contained approximately 70 pairs.
Network structure
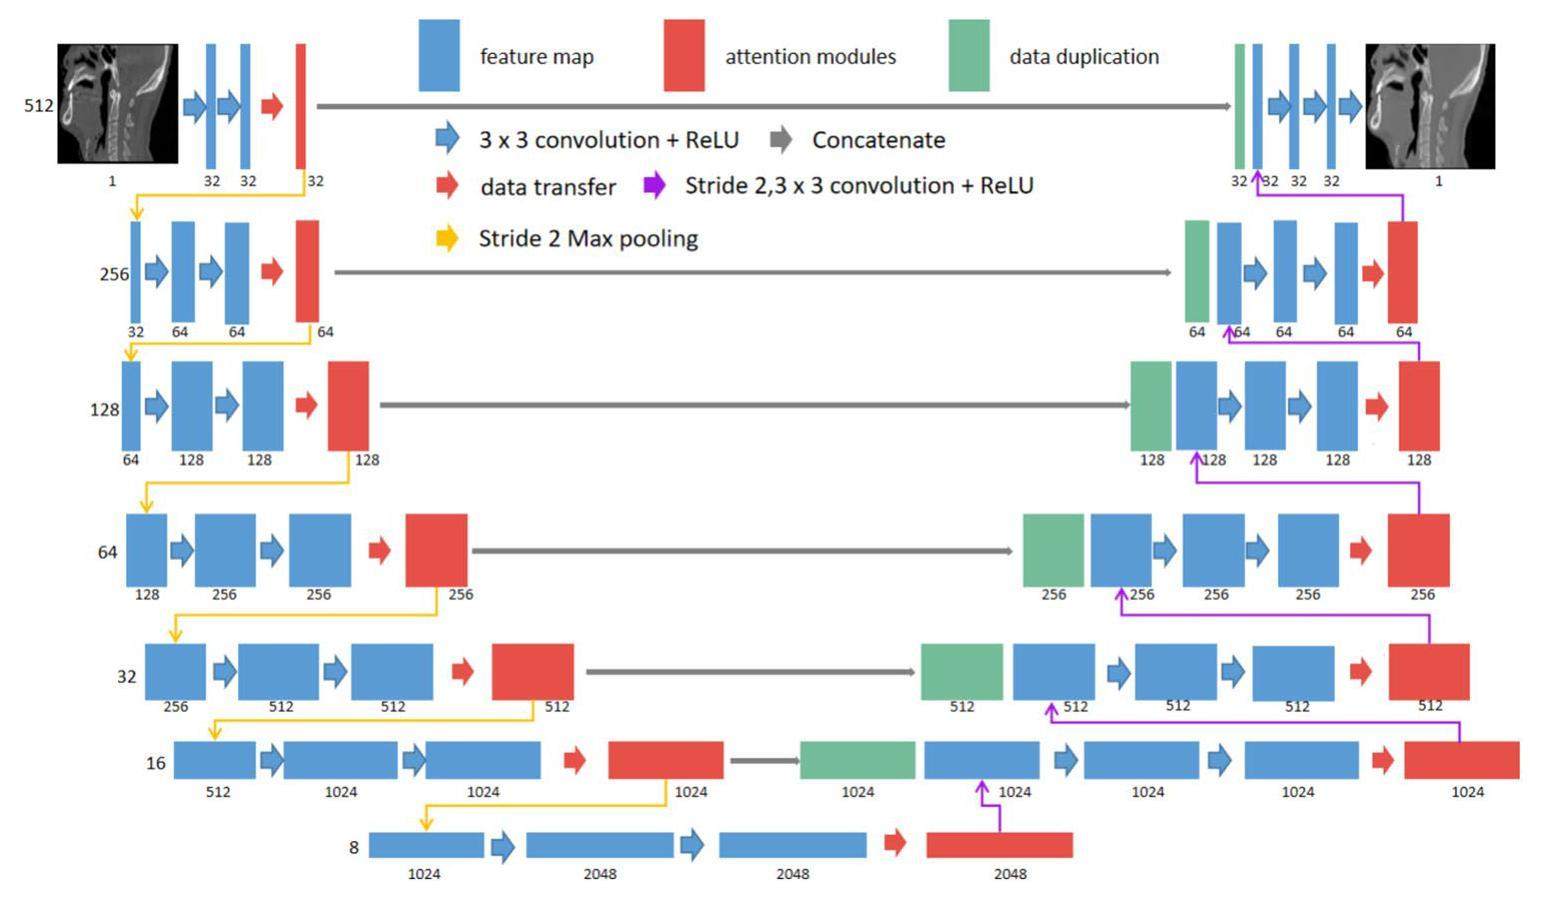
Figure 1 shows the network structure of CBAM-U-Net. The input data for the CBAM-U-Net network were CBCT images, and the output data were SCT images that were processed by the neural network. The first layer of the network was used to expand the original CBCT data to 32 channels. Using the down-sampling module, the height and width of the data were reduced to half of the input image, and the number of channels was doubled. After 6-layer down-sampling modules, 8 × 8 × 1024 feature images were created. Contrary to the function of the downsampling module, the feature images were processed by the upsampling module, which doubled the feature image height and width and reduced the number of channels by half. The 8 × 8 × 1024 feature images were up-sampled using 6-layer up-sampling modules, processing the feature image dimensions to 512 × 512 × 32. Finally, an SCT image with dimensions 512 × 512 × 1 was produced by the output module. The attention mechanism modules were integrated into both the downsampling and upsampling modules. These modules enabled the network to allocate calculation weights to the sampling modules in each layer, thereby enhancing the accuracy of the neural network outputs.
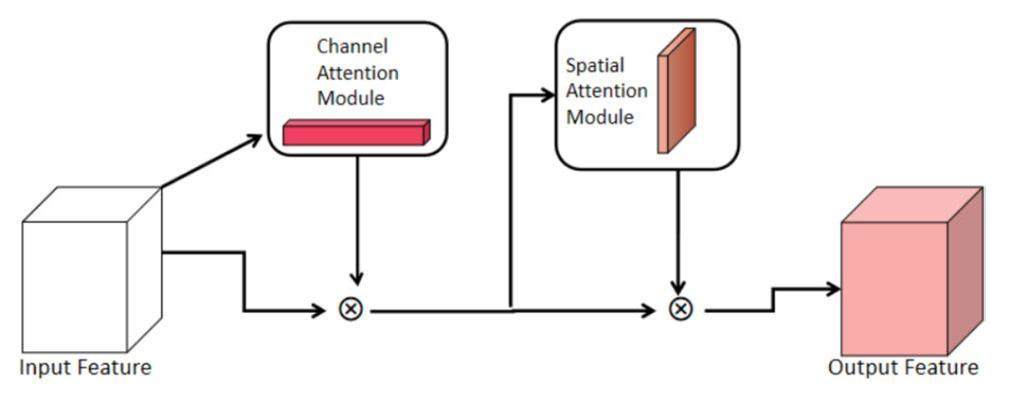
The weight calculation of the feature image was executed in the sampling module of each layer to increase the output accuracy of the neural network. The module of the convolutional attention mechanism is illustrated in Fig. 2. The convolutional block attention module comprised two submodules: the channel and spatial attention modules. Each feature image was assigned a weight parameter using a module called the channel attention mechanism module. The spatial attention mechanism module then processed the feature image by applying weight parameters to each pixel of the feature image. This process occurred during feature-image generation. To increase the accuracy of the HU values in the output results, the convolutional block attention module provided additional weight parameters for certain feature images and areas within all feature images.
A description of the channel attention module is presented in Fig. 3. The input feature images were initially processed using an adaptive average pool, with the output having dimensions of 1 × 1 × C, where C is the total number of channels. The weight parameters were generated after the input data passed through two linear layers and a Sigmoid layer. The input image was multiplied by the weight parameters to produce the output at the end of the module for the channel-attention mechanism. During the training of a neural network, certain feature images significantly affected the quality of the ideal output SCT image. After passing through the channel-attention mechanism module, these significant feature images were assigned larger weights.

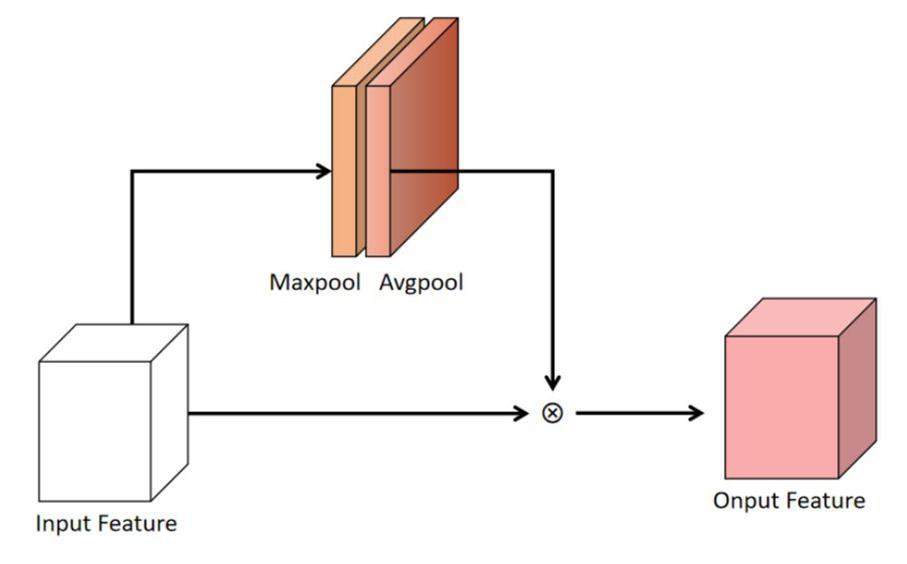
Figure 4 shows the spatial attention mechanism module. Subsequent to the channel attention mechanism module, the spatial attention mechanism module accepted the output of the channel attention mechanism module as its input. The spatial attention mechanism module compressed the feature images into a one-channel image and processed the feature image using an average pooling layer and a maximum pooling layer. The image maps of the average and maximum pooling layers were concatenated and processed using a convolution layer. The feature images were multiplied by the spatial weight to obtain the final output of the spatial attention mechanism module. Therefore, the spatial attention mechanism module can assign higher weights to key areas of the feature images and lower weights to areas outside the key areas to improve the capability of the network. The channel and spatial attention mechanism modules both assigned calculation weights to the feature images of the network. Throughout the learning process, the calculation weights were continuously modified to generate improved SCT images.
Network training parameter
PyTorch was used as the computing framework, and L1loss (Eq. 1) was chosen as the loss function. The model training engines were two NVIDIA RTX 2080Ti with 24 GB of computational memory. The batch size was set to 8, and each GPU received 4 images as the input. The initial learning rate was set at 1×10⁻⁴, and there were 180 training epochs. Adam was used as the optimizer and StepLR was used as the learning rate adaptor. Training was performed on both the sCTU-Net and CBAM-U-Net models with the same training parameters, and the training weight parameters were saved for each network.
Image evaluation
To evaluate the noise reduction performance, the MAE, RMSE, PSNR, and SSIM were used. The ground truth images were registered as CT images. The values of the data from the three testing datasets were analyzed using these four evaluation parameters, and the average values of the three testing datasets were calculated as the final assessment parameter.
The MAE and RMSE are expressed in Eqs. 2 and 3, respectively. Both are the most prevalent assessment criteria used in image processing and offer the advantages of being easily understood and quantifiable. The smaller the MAE and RMSE of the two images, the higher the similarity between them. The corresponding formulas are as follows:
PSNR is defined as the ratio between the maximum possible value of a signal and distorting noise power that affects the quality of its representation. The larger the PSNR, the higher is the similarity between the two images. The formula for PSNR is expressed as Eq. 4:
SSIM is a statistic used to determine the overall similarity between two images. It is commonly used as a statistic to measure image generation and processing. The dynamic range of SSIM ranges from -1 to 1. The closer the SSIM is to 1, the higher is the similarity in the total information content between the two images. SSIM was calculated using Eq. 5:
To show the matching degree between SCT, CBCT, and CT images in different HU value ranges. Q-Q (quantile-quantile) plots [40] between SCT and CT images and between CBCT and CT images from samples of the testing data were also plotted for detailed evaluation. Q-Q plots are commonly used in mathematical statistics to test the consistency of the distribution of two groups of data. The closer the two sets of data were distributed, the closer the Q-Q plot of the two groups of data was to 45 from the reference line.
Evaluation of dose calculation accuracy
The matRad dose calculation engine, an open-source software developed by the German Cancer Research Center (DKFZ, Heidelberg) for scientific purposes of radiotherapy planning, was used to calculate the dose distribution of proton beams, where the ray-tracing algorithm was used for dose calculation [41].
First, for the depth dose analysis, the IDD curve analysis of a proton beam with a nominal energy of 114.5 MeV is used in matRad. The dose grid was set as 1 mm × 1 mm × 1.5 mm. A proton beam in air with a full width at half maximum (FWHM) of 5 mm was applied to the dose calculation model of the head and neck CT, CBCT, CBAM-SCT, and U-Net-SCT images of the patient testing datasets. Second, for the lateral dose profile analysis, CBCT, CBAM-SCT, and U-Net-SCT images were analyzed using a square-field γ-index pass rate to compare the calculation results. The scanned field size was set to 4 cm × 4 cm, the spot spacing was 2 mm, and the square-field dose calculation employed proton beams with nominal energy of 114.5 MeV. Third, for further lateral dose analysis, a simple plan was also implemented, and under the same radiation conditions, the dose distribution of CT was used as a reference to compare their γ-index pass rates.
Results
Comparative analysis of CT images
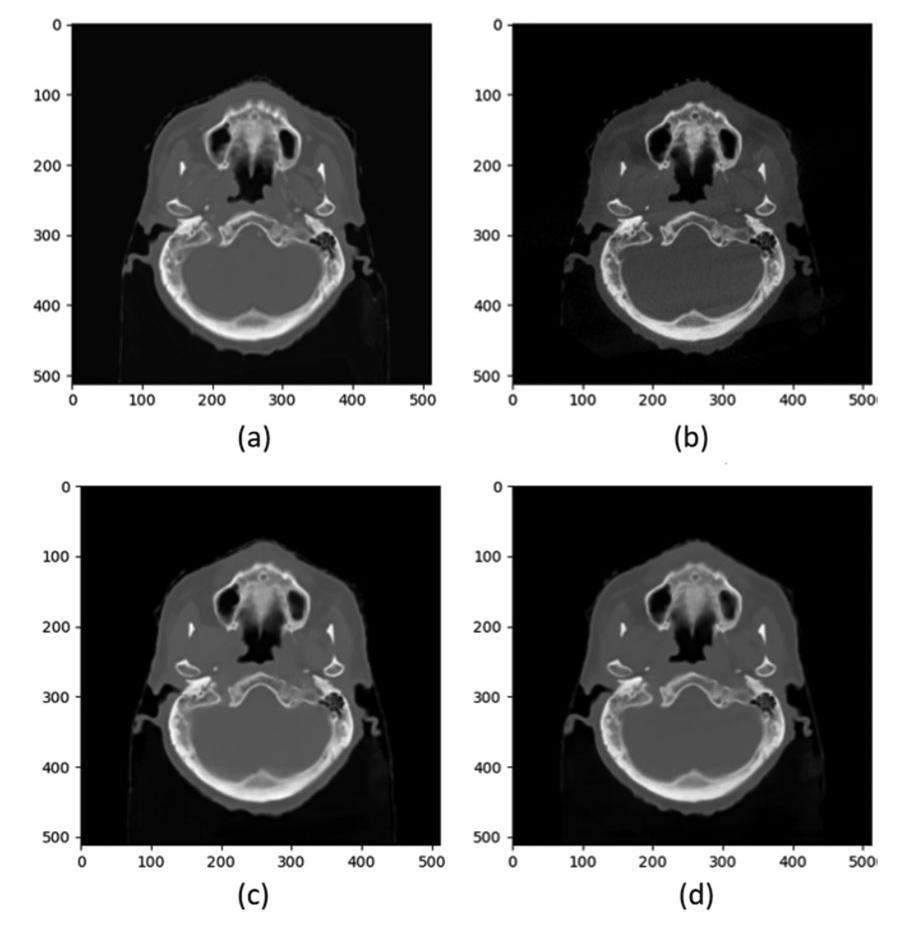
The network weight parameters of CBAM-U-Net and sCTU-Net were obtained under the same training conditions. The weight parameters produced by the sCTU-Net and CBAM-U-Net models were utilized to generate the SCT images of the three patient datasets. The data obtained from the generation of SCT images were evaluated using the four indicators mentioned above. Figure 5 shows representative transversal images of CT, CBCT, and SCT from a patient. Both the sCTU-Net and CBAM-U-Net networks effectively reduced image noise and restored the original CT image features in regions with CBCT image artifacts. The quantitative analysis mean value data are presented in Table 1.
| Image dataset | MAE (HU) | RMSE (HU) | PSNR (dB) | SSIM (a.u.) | |
|---|---|---|---|---|---|
| CBCT | 39.3256 | 104.8787 | 48.3045 | 0.9809 | |
| Patient1 | U-Net-SCT | 24.5496 | 65.5988 | 52.1678 | 0.9911 |
| CBAM-SCT | 22.6519 | 57.1462 | 53.1665 | 0.9936 | |
| CBCT | 41.2931 | 111.9404 | 47.6491 | 0.9780 | |
| Patient2 | U-Net-SCT | 25.4210 | 73.6275 | 51.0182 | 0.9892 |
| CBAM-SCT | 23.1739 | 68.6911 | 51.6913 | 0.9909 | |
| CBCT | 47.7311 | 115.2558 | 47.6525 | 0.9783 | |
| Patient3 | U-Net-SCT | 26.9864 | 76.3210 | 51.1504 | 0.9885 |
| CBAM-SCT | 25.4442 | 67.2830 | 52.0463 | 0.9915 |
Table 1 demonstrates that the U-Net-SCT and CBAM-SCT images were significantly superior in the four evaluation metrics compared to the CBCT images. Moreover, CBAM-SCT images exhibited better image quality than the U-Net-SCT images.
To demonstrate the CBAM-U-Net’s ability to reduce noise, error distribution maps were obtained by subtracting the CT images from CBCT and SCT images, as shown on the left side of Fig. 6. The CBCT, and CBAM-SCT images had an MAE values of 23.68, 17.75, and 13.02 HU, respectively. The image errors generated by CBCT were worse than those generated by SCT, which mainly appeared around the bone border. CBCT images also contained severe scattered noise. CBAM-U-Net and original sCTU-Net both reduced scatter artifacts and controlled noise to an acceptable level. Moreover, CBAM-U-Net exhibited a better noise reduction ability than sCTU-Net, particularly in high-density areas such as the skull.
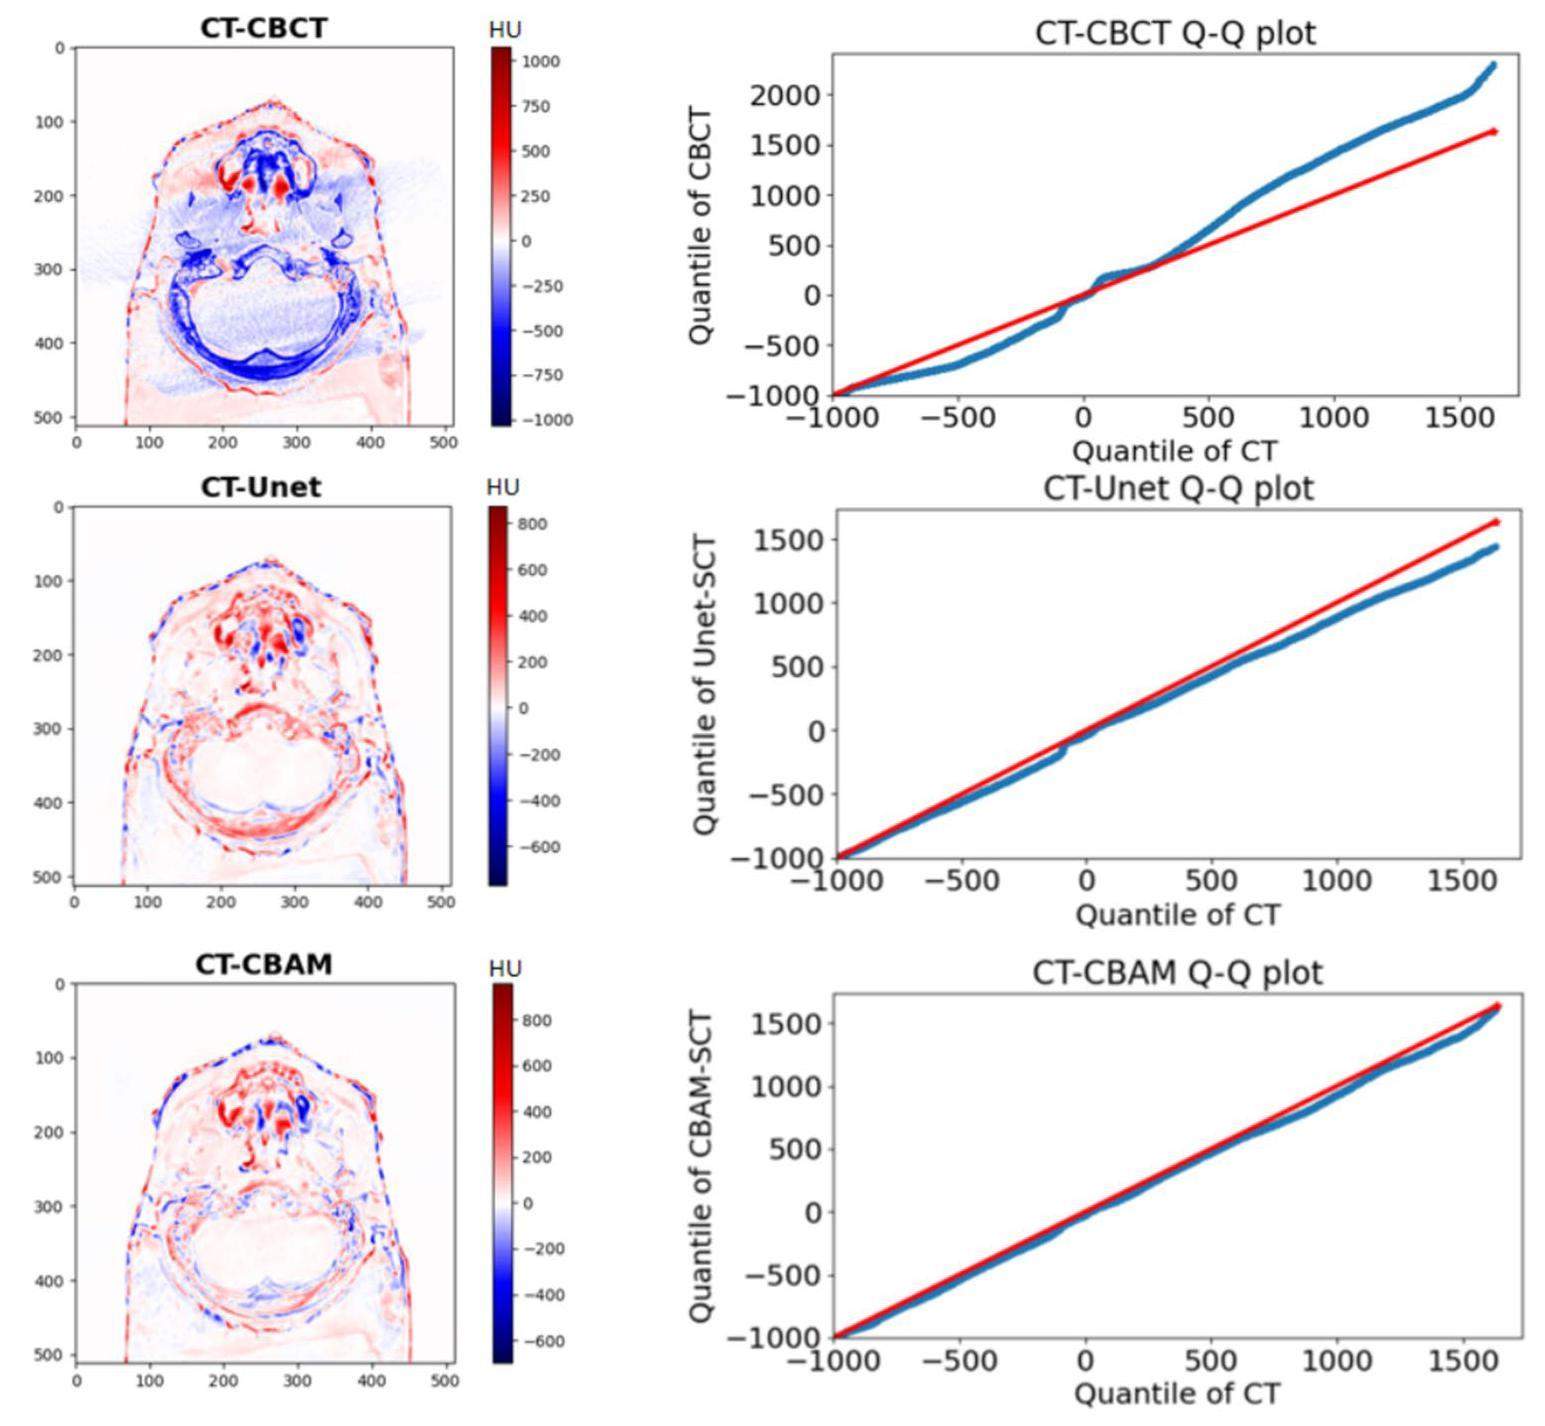
Q-Q plots between CBCT and CT images and between SCT and CT images from one test patient are shown in Fig. 6. The range of the horizontal coordinates of the Q-Q plots was set as the HU value range of the CT image, whereas that of the vertical coordinates of the Q-Q plot was set as the HU value range of CBCT or SCT. The Q-Q plot of CT-CBCT deviated from the 45 reference line, particularly in high-density tissue. Whereas, sCTU-Net corrected most of the errors, although there were still errors in high-density tissue areas. The Q-Q plot of CT-CBAM along the reference line of 45, regardless of the soft tissue and bone areas, demonstrated that CBAM-SCT images had the same data distribution as the CT images. The Q-Q plots show that the CBAM-U-Net network exhibited a better noise reduction ability in high-density tissue areas than the original sCTU-Net network.
Single-beam depth dose analysis
The IDD curve of the proton beam was analyzed using matRad. The high-density and soft-tissue areas of the three tested patients were selected as the analysis areas. The selection of these two areas reflected the actual clinical treatment conditions. Moreover, in dose calculations, the artifacts of high-density tissue areas are commonly the cause of large dose calculation errors. Figure 7 shows the dose distribution map for Patient 1 along the beam is shown in Fig. 7.
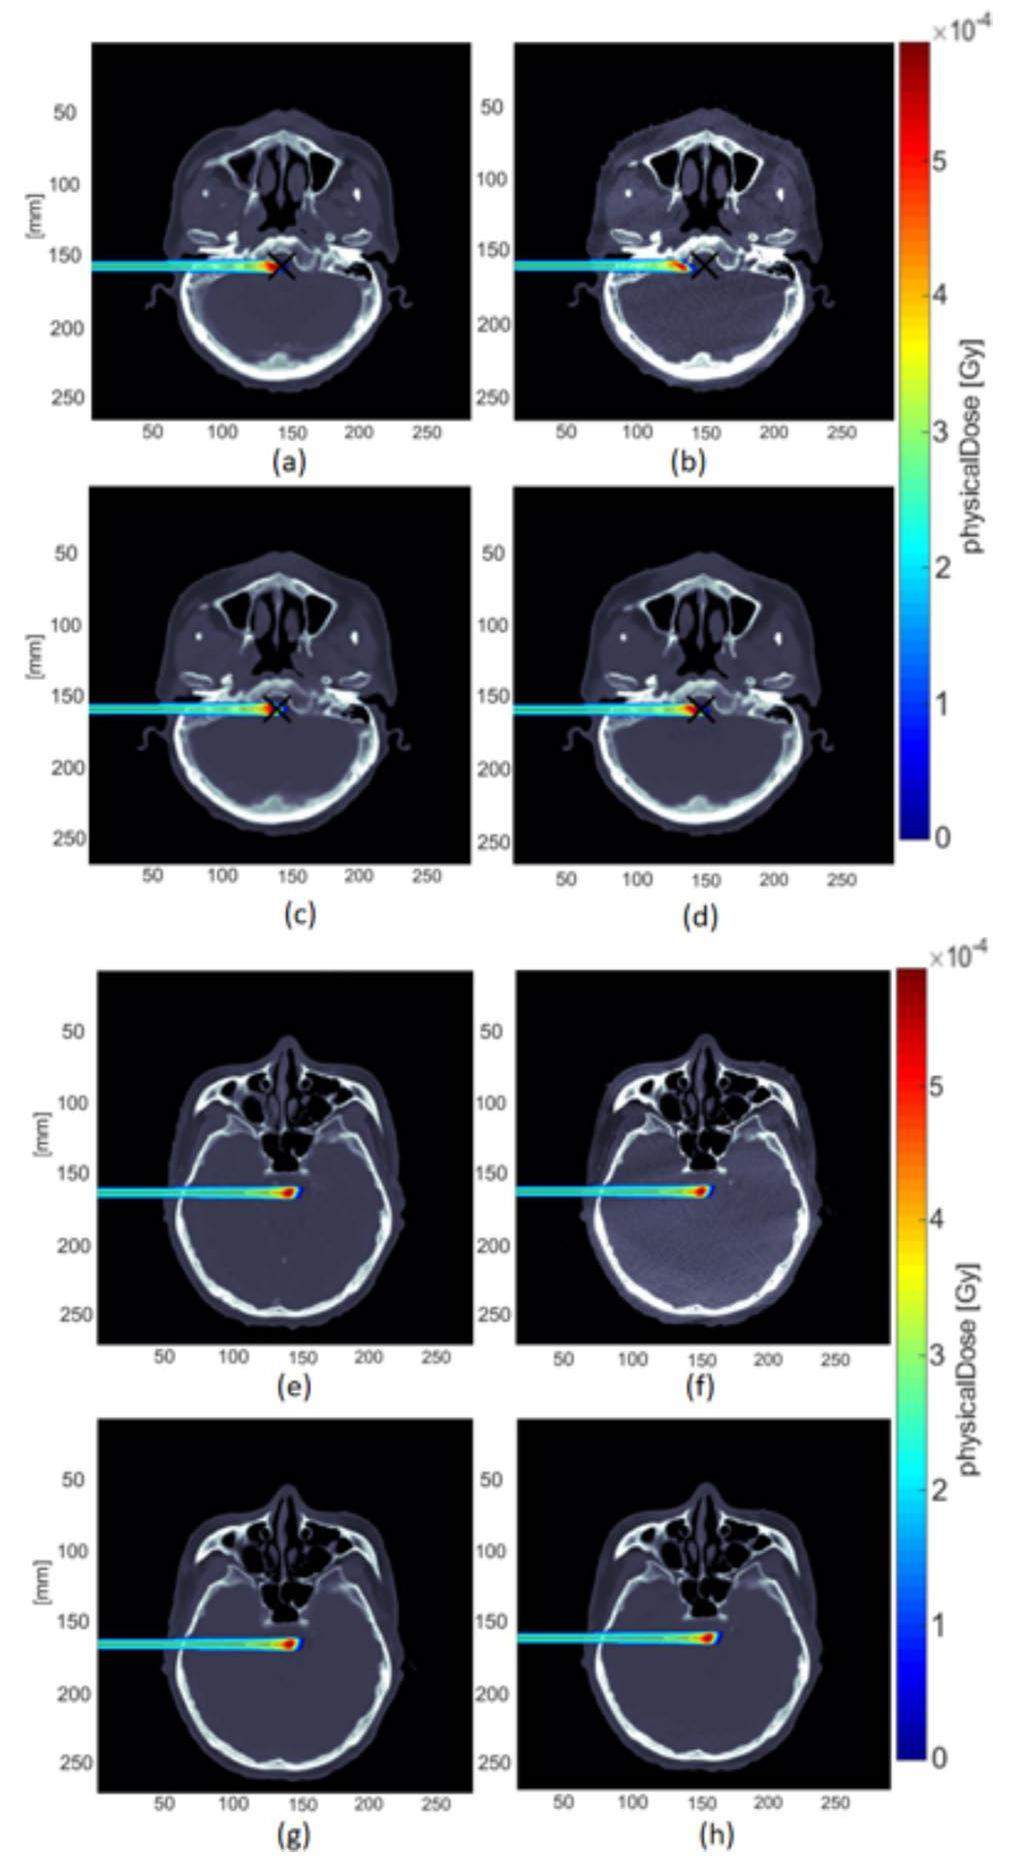
The corresponding IDD curves are presented in Fig. 8. The IDD curves of the CT images were used as the reference curves. The IDD curves for the high-density and soft-tissue areas were compared.
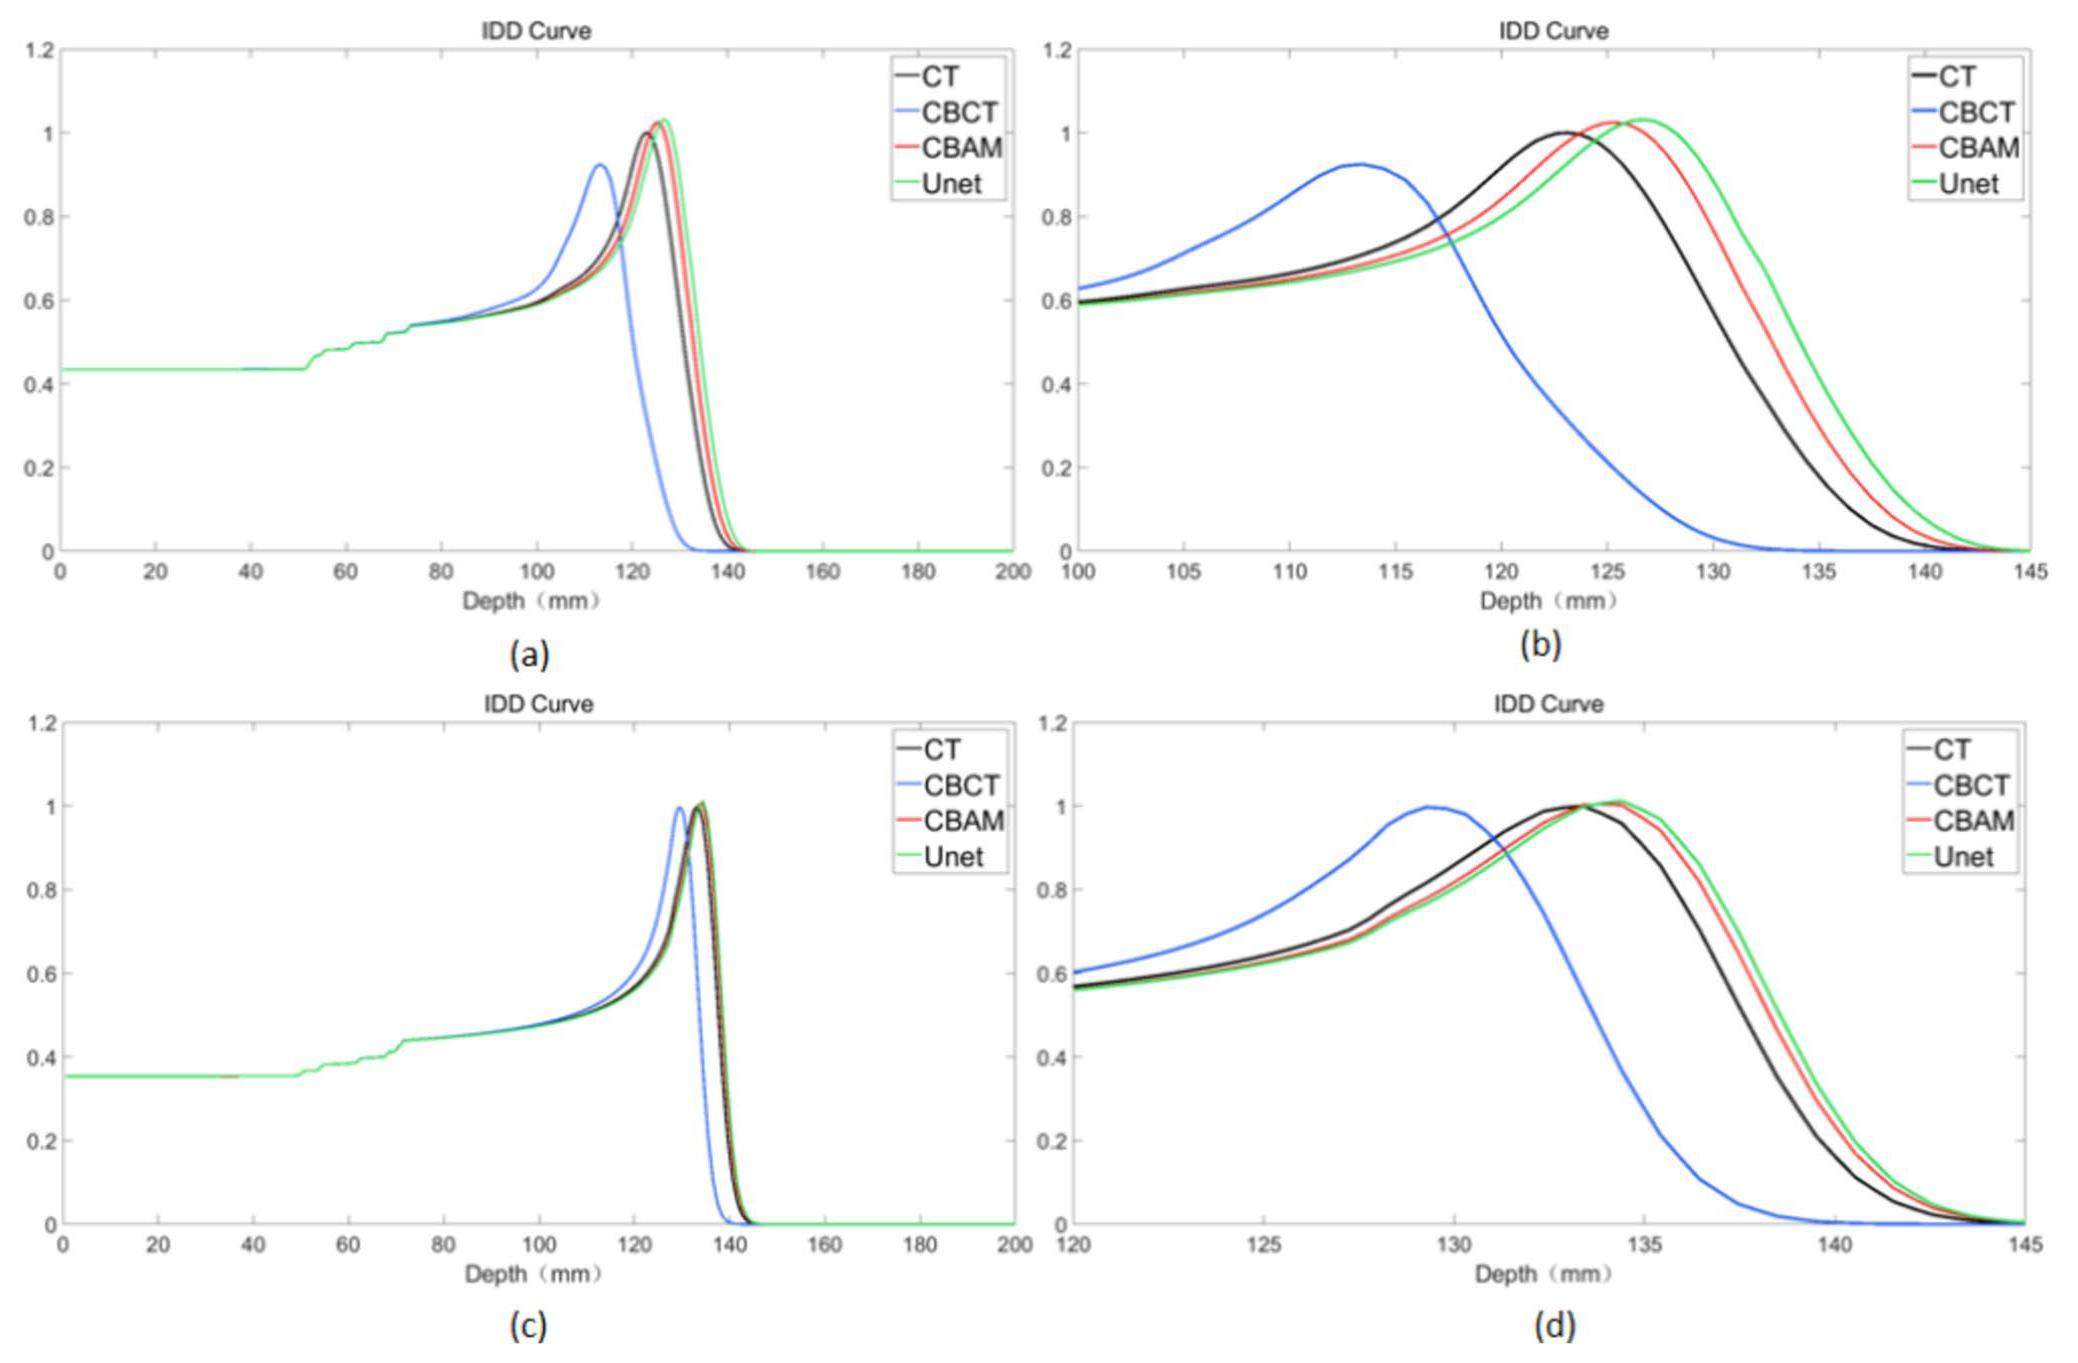
To show more details of the IDD curve at the Bragg peak region, for the IDD curve of the high-density areas, the depth 100 mm–145 mm IDD curve was selected for analysis, and for the IDD curve of the soft tissue areas, the depth 120 mm–145 mm IDD curve was selected for analysis. Both sCTU-Net and CBAM-U-Net exhibited effective noise reduction in soft tissue areas, as shown in Fig. 8, and their IDD profiles were comparable. However, the noise reduction effect of CBAM-U-Net was better than that of the original sCTU-Net in high-density areas. The CBAM-U-Net IDD curve was closer to the CT’s IDD curve than to that of sCTU-Net. To quantify this difference, Table 2 presents the depth at the peak of IDD curves for the three patients.
| CT | CBCT | U-Net-SCT | CBAM-SCT | ||
|---|---|---|---|---|---|
| Patient1 | High density tissue | 122.6 mm | 113.4 mm | 126.7 mm | 125.2 mm |
| Soft tissue | 133.4 mm | 129.3 mm | 134.4 mm | 133.9 mm | |
| Patient2 | High density tissue | 122.6 mm | 113.4 mm | 124.7 mm | 124.7 mm |
| Soft tissue | 150.7 mm | 147.7 mm | 151.8 mm | 151.8 mm | |
| Patient3 | High density tissue | 123.7 mm | 119.1 mm | 126.7 mm | 126.2 mm |
| Soft tissue | 147.7 mm | 143.6 mm | 149.2 mm | 147.7 mm |
Because of the image artifacts in CBCT images, the IDD curves of the CBCT exhibited considerable inaccuracy compared to those of CT. Moreover, the results of the IDD curves of CBCT cannot reflect the anatomical structure information of patients from the perspective of proton radiotherapy. The IDD curves of CBAM-SCT and U-Net-SCT exhibited a better degree of matching than that of CBCT. Whereas, those of CBAM-SCT and U-Net-SCT had the same profile as the IDD curves of CT. According to the IDD curves, the CBAM-U-Net network was more effective than the original sCTU-Net network in reducing noise in high-density tissues. In addition, the results of CBAM-SCT images with a single-energy beam from the treatment angle and other key angles reflected tissue changes at the radiation site and the degree of anatomical deformation of the related tissue.
Lateral dose comparison analysis
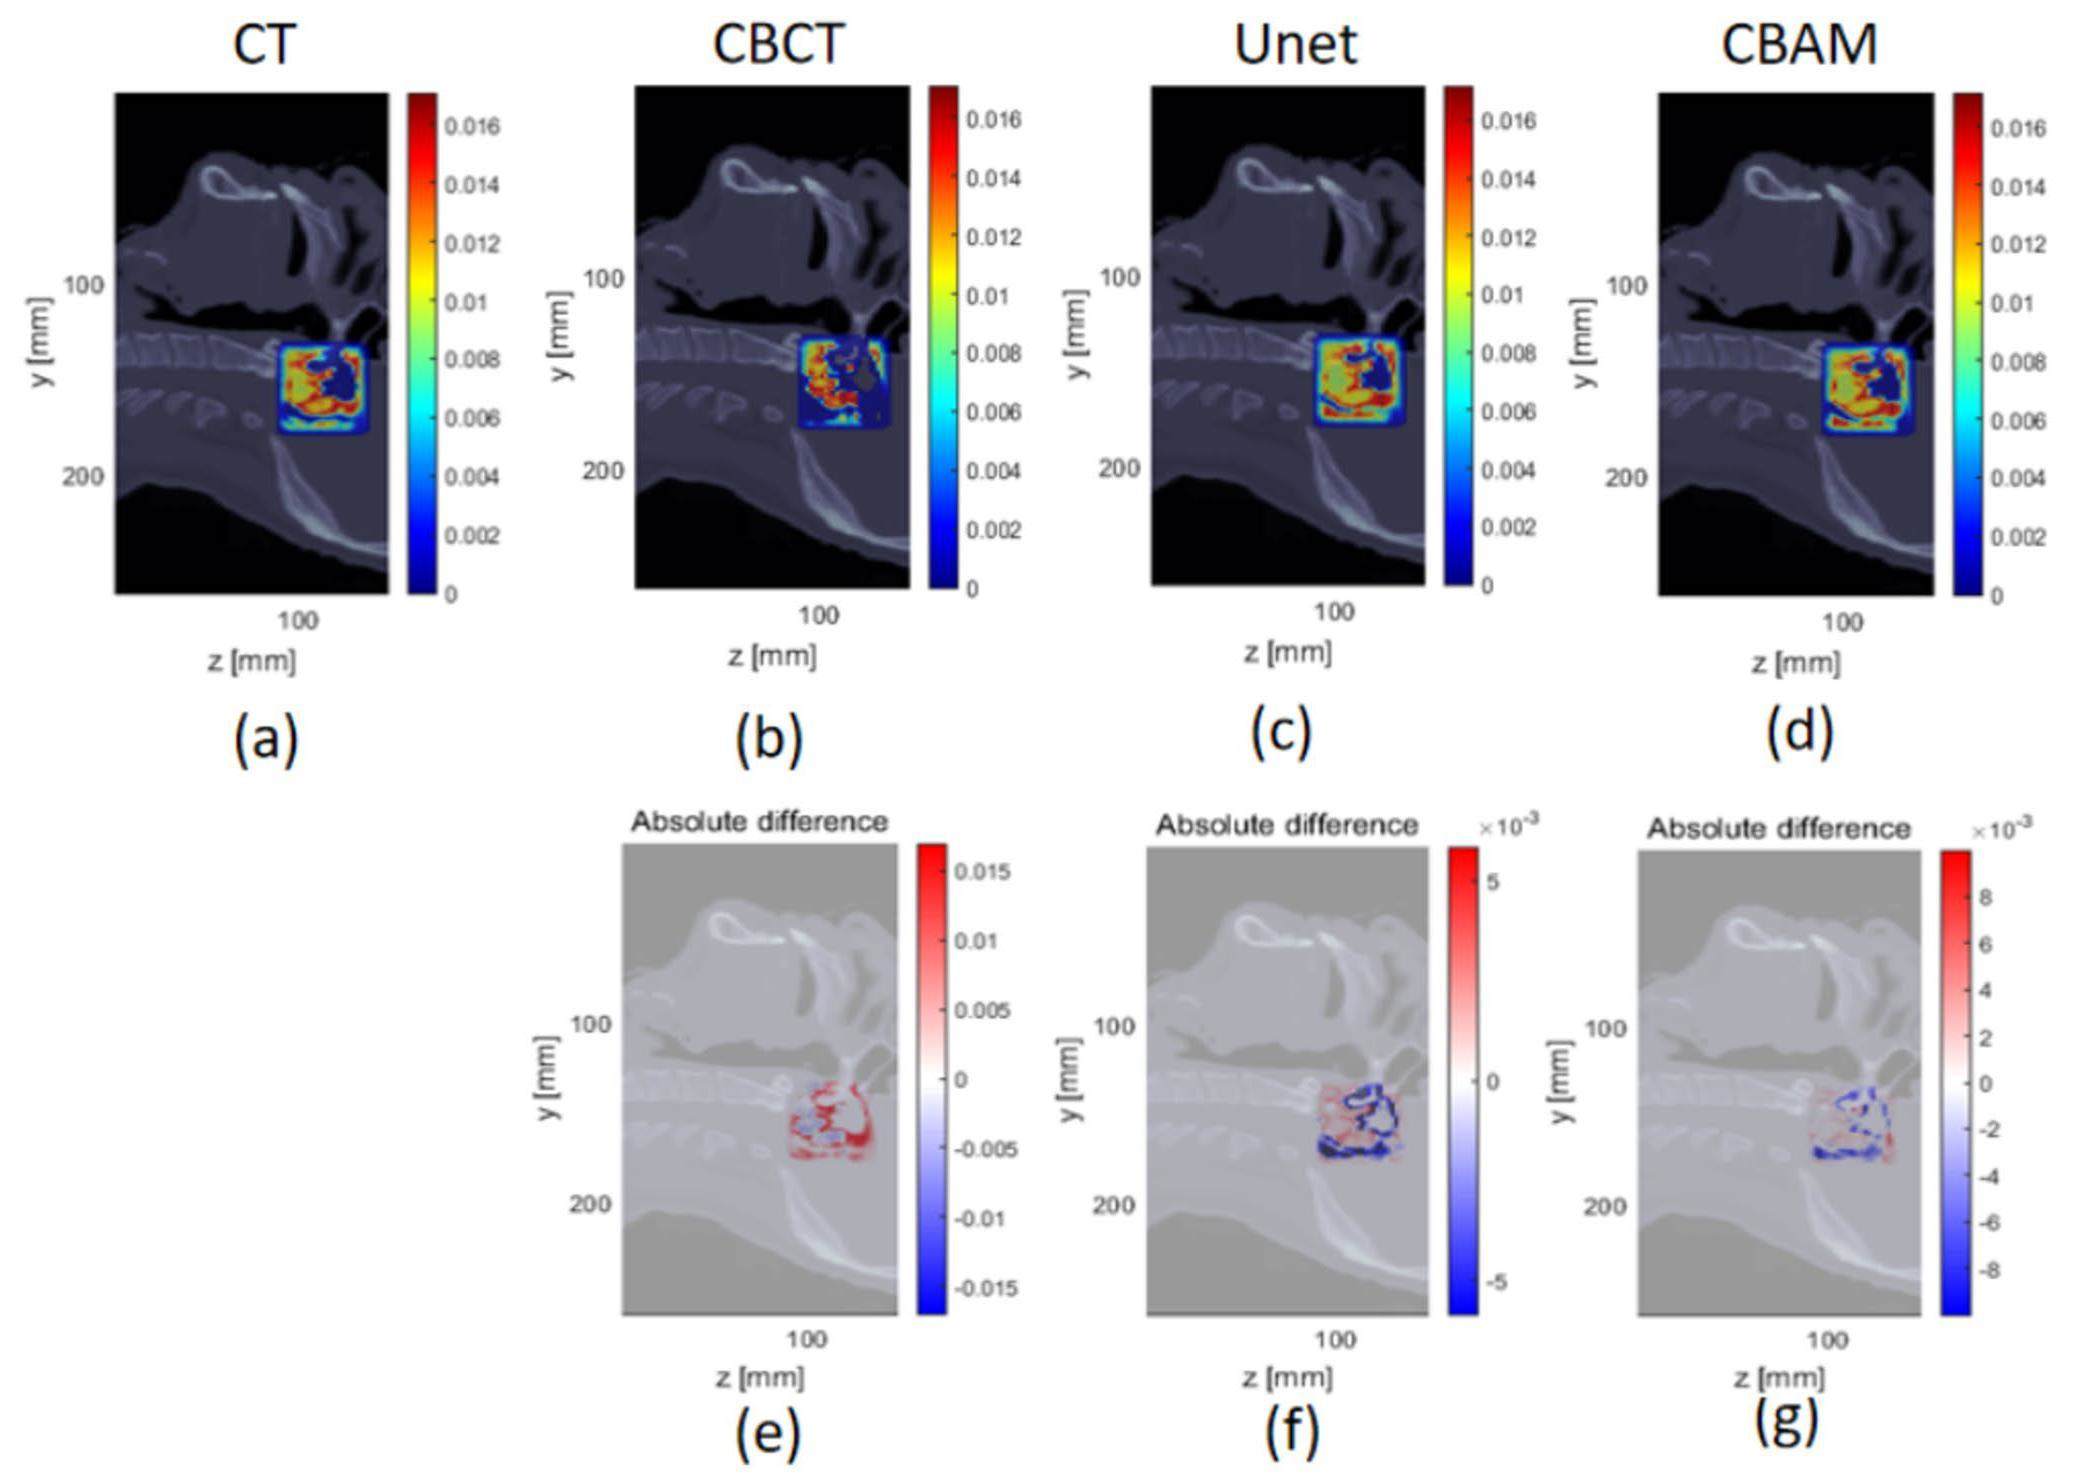
In matRad, the dose results of CT were used as a reference. CBCT, CBAM-SCT, and U-Net-SCT images were analyzed using the 1%/1mm and 3%/3mm γ-index criteria in a square field to compare the calculation results. The square field size was set to 4 cm × 4 cm, and the spot spacing was 2 mm. The experiment employed proton beams with nominal energy of 114.5 MeV. The high-density boundary was selected as the radiation analysis area because it can assess the difference in dose distribution between the high-density and soft tissue areas. Figure 9 shows the scanned field lateral dose distribution and absolute dose difference of Patient 1 compared with the dose distribution in the CT images. The γ-index pass rates of CBCT, CBAM-SCT, U-Net-SCT, and CT for the three patients are listed in Table 3.
| CBCT | U-Net-SCT | CBAM-SCT | ||
|---|---|---|---|---|
| Patient1 | 1%/1 mm | 70.67% | 79.03% | 82.23% |
| 3%/3 mm | 93.89% | 97.04% | 98.09% | |
| Patient2 | 1%/1 mm | 85.05% | 85.23% | 85.73% |
| 3%/3 mm | 98.53% | 98.57% | 98.62% | |
| Patient3 | 1%/1 mm | 80.52% | 86.88% | 88.94% |
| 3%/3 mm | 97.12% | 98.77% | 99.25% |
A smaller absolute dose difference existed between the CBAM-SCT and CT image square fields than that between the CBCT, U-Net-SCT, and CT images. In addition, Figure 9 shows that the absolute dose difference of CBAM-SCT images in the bone region was lower. The γ-index pass rate of CBAM-SCT was superior to that of the original sCTU-Net network under the criteria of 1%/1 mm and 3%/3 mm γ-index pass rates. In particular, under the 1%/1 mm calculation condition for patient 1, the γ-index pass rate of CBAM-SCT was 82.23%, which is considerably higher than that of U-Net-SCT’s 79.03%. Noise in higher-density tissues with a higher stopping power ratio leads to a greater dose error in radiotherapy dose calculation. CBAM-U-Net has a more robust noise reduction function in high-density areas; therefore, CBAM-SCT images are more suitable for clinical dose calculation requirements than the original sCTU-Net network.
According to the results of the square-field calculation, the CBAM-U-Net network can improve the accuracy of the dose calculation and eliminate the image artifacts existing in the original CBCT images. The γ-index pass rate of the SCT images generated by the CBAM-U-Net network was higher than that produced by the original sCTU-Net network. The application of square-field dose calculations can partially consider the influence of anatomical structural changes on the original treatment plan and provide additional data support for subsequent treatment.
To further evaluate the effect of image quality on the dose calculation results, delineation of a simple PTV and OAR was implemented. CT, CBCT, U-Net-SCT, and CBAM-SCT used the same PTV and OAR contours as in Patient 1 to eliminate errors caused by manual delineation. A single-field plan was adopted with a 180° gantry angle and 0° couch angle, and single-field inverse planning was used to optimize the dose distribution. The squared deviation function was used for dose optimization in the PTV area and the squared overdosing function was used for dose optimization in the OAR. The results of the CT images were selected as references, and the CBAM-SCT, and U-Net-SCT images were analyzed using the 2%/2mm γ-index criterion to compare the dose distribution. The absolute dose differences are shown in Fig. 10.
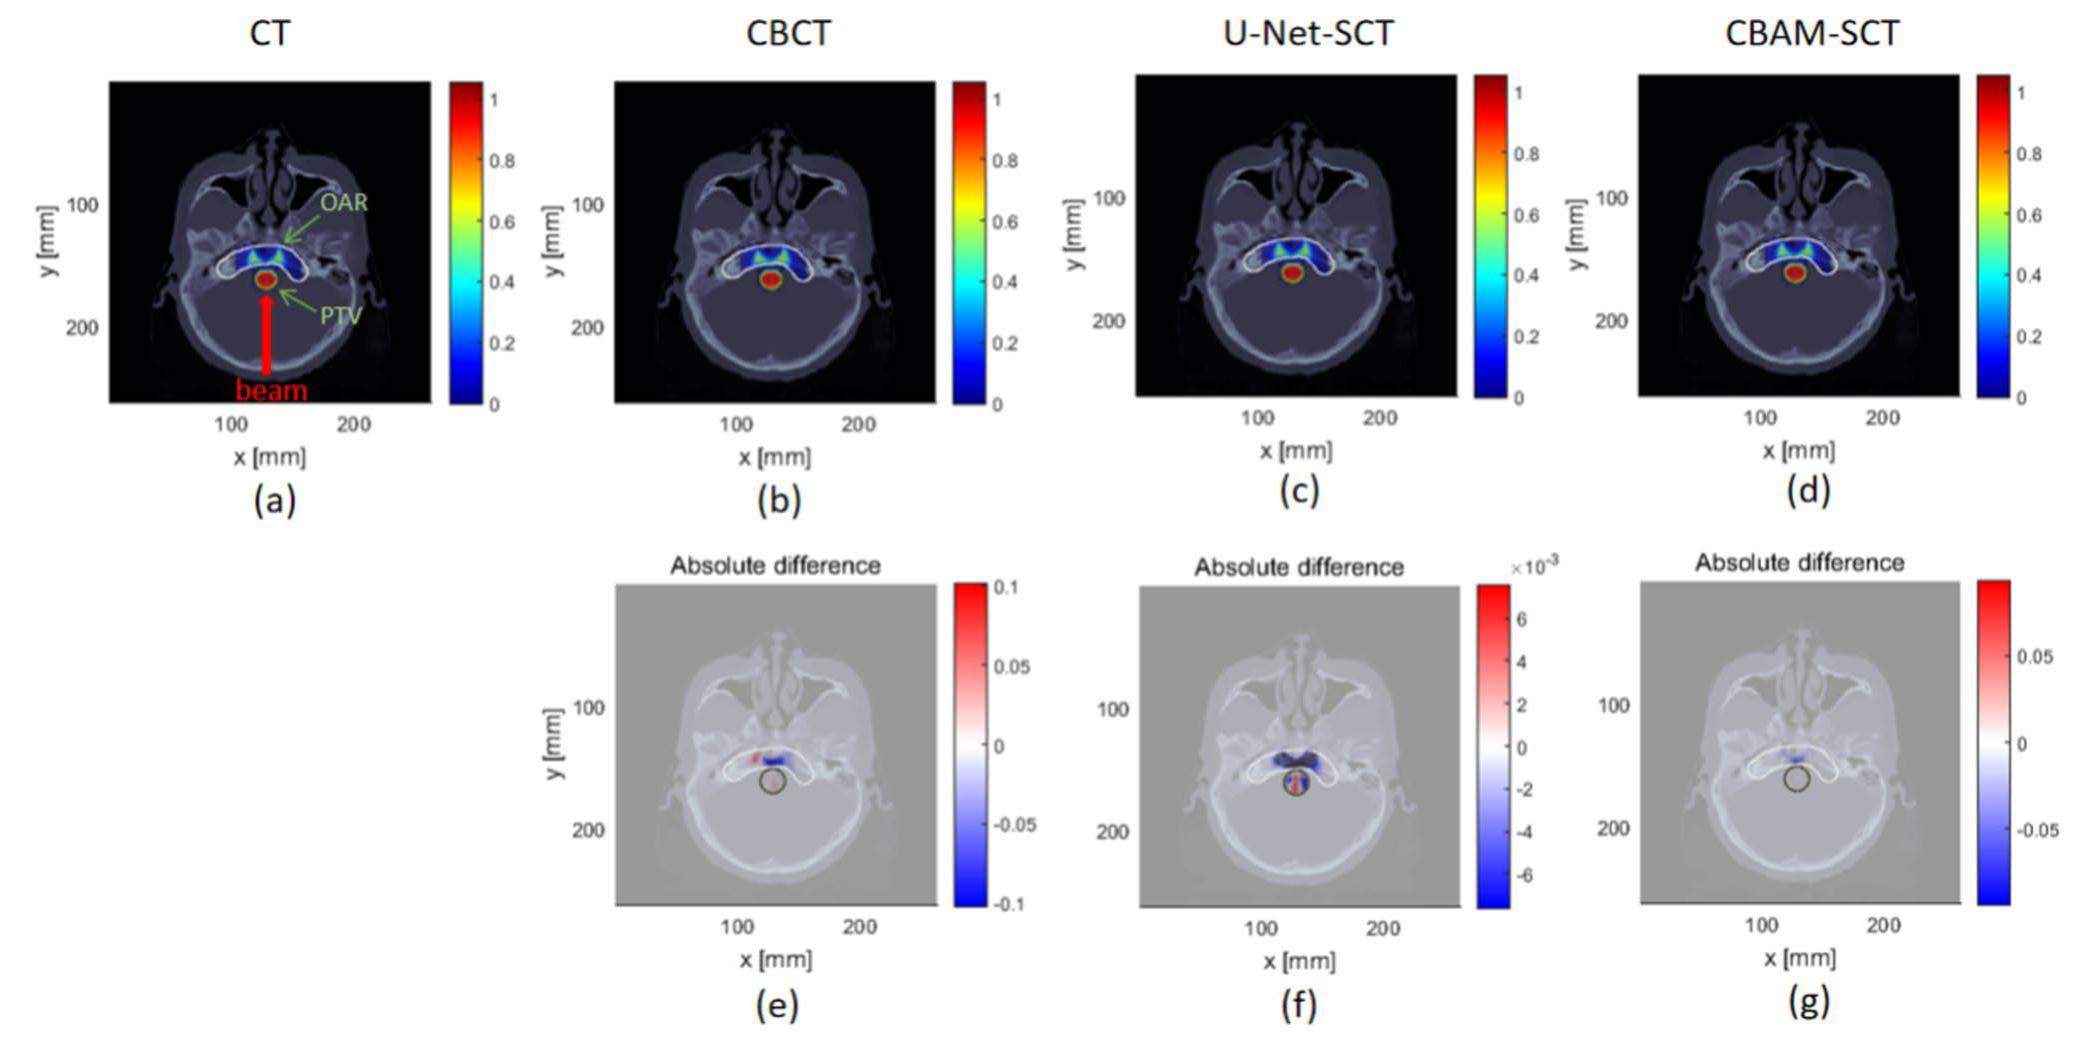
The γ-index pass rate of CBAM-SCT was 88.97%, which is better than that of U-Net-SCT and CBCT (88.06% and 77.01%, respectively). Using the CBAM-U-Net network to eliminate CBCT image artifacts may provide a foundation for proton-adaptive therapy.
Discussion
The proposed deep learning method was realized by synthesizing CT images from CBCT images, which have the clarity of CT images, while retaining the anatomical structure of the CBCT images. By adding CBAM Block modules to sCTU-Net, CBAM-U-Net performed better than the original sCTU-Net in terms of noise reduction. CT, CBCT and SCT images were compared using four image metric parameters. It was concluded that the image assessment parameters (Table 1) of CBAM-SCT were superior to those of U-Net-SCT and original CBCT. The image difference error map and Q-Q plots were applied to image analysis; CBAM-U-Net exhibits a better image noise reduction capacity and image correction performance in high-density tissues. High-density soft tissue areas are commonly treated with radiotherapy. Particularly in high-density areas, noise probably leads to serious dose-calculation errors. Therefore, the CBAM-U-Net exhibited better accuracy in case of the potential CBCT dose calculations.
The IDD curves of a single-energy proton beam were compared. Although the IDD curve of CBAM was closer to that of CT, errors were present in soft tissue and high-density tissue between the IDD curve peak of CBAM-SCT and CT. Therefore, further improvement of image correction will be implemented for accurate dose calculation. The results of the lateral dose profile analysis showed that CBAM-SCT images had a higher γ-index pass rate than the U-Net-SCT images under the 1%/1 mm and 3%/3 mm calculation criteria. Owing to the selected scanned field at the junction of the soft tissue and bone regions, Figure 9 shows that the absolute dose difference of CBAM-SCT was lower than those of U-Net-SCT and CBCT in the soft tissue and bone areas. The results of γ-index pass rate of the simple plan further demonstrated that CBAM-U-Net exhibited a certain level of practical therapeutic performance. Compared with the original sCTU-Net network, the CBAM-U-Net proposed in this study performed better in image denoising for potential dose calculation. Because this study did not use real treatment plans for dose calculation comparison, it may not directly reflect the impact of image quality on real treatment plans from the perspective of treatment. However, the monoenergetic scanned field and simple plan calculation results demonstrated the improvement in image quality for dose calculation accuracy to a certain extent.
In this study, CBAM-U-Net was still a supervised learning model, and the registered CT images with identical anatomical structures as ground truths inevitably contained registration errors, which lead to defective network learning. However, ideal CBCT-CT pairs are not easily available because they are not acquired simultaneously. The process of obtaining raw data is complicated; therefore, an unsupervised learning model should be developed for more flexible training and faster training data acquisition [42-44]. The proposed model was two-dimensional, and the input data and output data were as per a slice-by-slice model. A 3D generative model will be researched in the future to enhance the performance of noise reduction in CBCT images [45]. Because of the strong flexibility of U-Net, noise reduction in CBCT image projection domain is also a promising method [46, 47]. In addition, the acquisition of real CT data is not straightforward, and only the CT datasets of 17 patients were used as the training datasets, which may lead to limit generalization of the network. However, in small dataset training samples, CBAM-U-Net shows better noise reduction performance and robustness. Additional data will be used in the future to improve network robustness.
Conclusion
This study proposed the CBAM-U-Net model to generate synthetic CT images from original CBCT images based on an sCTU-Net neural network with a convolutional block attention module called CBAM-U-Net. Synthetic CT images stored the anatomical and structural information of the original CBCT images with relatively accurate HU value. In addition, it reduced noise in high-density areas and restored the original CBCT data better than the original sCTU-Net network. Our approach improved the accuracy of HU values of CBCT images, thus facilitating further quantitative applications of CBCT, such as potential dose calculation and adaptive treatment planning in the future.
Cancer statistics, 2018
. Ca-Cancer. J. Clin. 68, 7-30 (2018). https://doi.org/10.3322/caac.21442Commissioning of the world’s first compact pencil-beam scanning proton therapy system
. J. Appl. Clin. Med. Phys. 19, 94-105 (2018). https://doi.org/10.1002/acm2.12225Proton beam therapy in Japan: current and future status
. Jpn. J. Clin. Oncol. 46, 885-892 (2016). https://doi.org/10.1093/jjco/hyw102Current situation and perspectives of proton therapy
. Cancer Radiother. 19, 211-219 (2015). https://doi.org/10.1016/j.canrad.2014.12.010Flourish of proton and carbon ion radiotherapy in China
. Front. Oncol. 12, 819905 (2022). https://doi.org/10.3389/fonc.2022.819905New frontiers in proton therapy: applications in cancers
. Cancer Commun. 39, 61 (2019). https://doi.org/10.1186/s40880-019-0407-3Simulation study of secondary neutron reflection distribution in proton therapy room
. Nucl. Tech. 44, 020203 (2021). https://doi.org/10.11889/j.0253-3219.2021.hjs.44.020203 (in Chinese)Range modulators for protons and heavy ions
. Nucl. Instrum. Meth. 131, 437-440 (1975). https://doi.org/10.1016/0029-554X(75)90430-9Dosimetry calculations of involved and noninvolved organs in proton therapy of liver cancer: a simulation study
. Nucl. Sci. Tech. 30, 173 (2019). https://doi.org/10.1007/s41365-019-0698-8Energy loss of degrader in SC200 proton therapy facility
. Nucl. Sci. Tech. 30, 4 (2019). https://doi.org/10.1007/s41365-018-0526-6Minimax optimization for handling range and setup uncertainties in proton therapy: Minimax optimization for handling uncertainties in proton therapy
. Med. Phys. 38, 1672-1684 (2011). https://doi.org/10.1118/1.3556559Robust optimization of intensity modulated proton therapy: Robust optimization of IMPT
. Med. Phys. 39, 1079-1091 (2012). https://doi.org/10.1118/1.3679340Including robustness in multi-criteria optimization for intensity-modulated proton therapy
. Phys. Med. Biol. 57, 591-608 (2012). https://doi.org/10.1088/0031-9155/57/3/591A review of proton therapy–Current status and future directions
. Precision Radiation Oncology. 6, 164-176 (2022). https://doi.org/10.1002/pro6.1149Proton therapy in clinical practice
. Chin. J. Cancer. 30, 315-326 (2011). https://doi.org/10.5732/cjc.010.10529Clinical application of image-guided radiotherapy, IGRT (on the Varian OBI platform)
. Cancer Radiother. 10, 252-257 (2006). https://doi.org/10.1016/j.canrad.2006.05.012kV Cone-Beam CT-Based IGRT: A clinical review
. Strahlenther. Onkol. 187, 284-291 (2011). https://doi.org/10.1007/s00066-011-2236-4Proton therapy
. Lung Cancer. 22, 338-352 (2014). https://doi.org/10.1002/9781118468791.ch22Patient dose from kilovoltage cone beam computed tomography imaging in radiation therapy: Patient dose from kilovoltage cone beam CT
. Med. Phys. 33, 1573-1582 (2006). https://doi.org/10.1118/1.2198169Technical principles of dual-energy cone beam computed tomography and clinical applications for radiation therapy
. Adv. Radiat. Oncol. 5, 1-16 (2020). https://doi.org/10.1016/j.adro.2019.07.013Artefacts in cone beam CT
. OJST. 3, 292-297 (2013). https://doi.org/10.4236/ojst.2013.35049Artefacts in CBCT: a review
. Dentomaxillofac. Rad. 40, 265-273 (2011). https://doi.org/10.1259/dmfr/30642039Adaptive proton therapy
. Phys. Med. Biol. 66, 22TR01 (2021). https://doi.org/10.1088/1361-6560/ac344fValidation of proton dose calculation on scatter corrected 4D cone beam computed tomography using a porcine lung phantom
. Phys. Med. Biol. 66, 175022 (2021). https://doi.org/10.1088/1361-6560/ac16e9Implementation and validation of a 3-dimensional deformable registration algorithm for targeted prostate cancer radiotherapy
. Int. J. Radiat. Oncol. 60, S228-S229 (2004). https://doi.org/10.1016/j.ijrobp.2004.06.186Automatic segmentation and online virtualCT in head-and-neck adaptive radiation therapy
. Int. J. Radiat. Oncol. 84, e427-e433 (2012). https://doi.org/10.1016/j.ijrobp.2012.04.003Phantom based evaluation of CT to CBCT image registration for proton therapy dose recalculation
. Phys. Med. Biol. 60, 595-613 (2015). https://doi.org/10.1088/0031-9155/60/2/595Deformable image registration to assist clinical decision for radiotherapy treatment adaptation for head and neck cancer patients
. Biomed. Phys. Eng. Express. 7, 055012 (2021). https://doi.org/10.1088/2057-1976/ac14d1Investigating deformable image registration and scatter correction for CBCT-based dose calculation in adaptive IMPT: CBCT correction to enable IMPT dose calculation
. Med. Phys. 43, 5635-5646 (2016). https://doi.org/10.1118/1.4962933Comparing cone-beam CT intensity correction methods for dose recalculation in adaptive intensity-modulated photon and proton therapy for head and neck cancer
. Acta. Oncol. 54, 1651-1657 (2015). https://doi.org/10.3109/0284186X.2015.1061206Decomposing a prior-CT-based cone-beam CT projection correction algorithm into scatter and beam hardening components
. Phys. Imag. Radiat. Onc. 3, 49-52 (2017). https://doi.org/10.1016/j.phro.2017.09.002A correlated sampling-based Monte Carlo simulation for fast CBCT iterative scatter correction
. Med. Phys. 50, 1466-1480 (2023). https://doi.org/10.1002/mp.16073Convolutional neural network based metal artifact reduction in X-ray computed tomography
. IEEE. T. Med. Imaging. 37, 1370-1381 (2018). https://doi.org/10.1109/TMI.2018.2823083Augmentation of CBCT reconstructed from under-sampled projections using deep learning
. IEEE. T. Med. Imaging. 38, 2705-2715 (2019). https://doi.org/10.1109/TMI.2019.2912791U-Net: Convolutional networks for biomedical image segmentation
. Lect. Notes. Comput. Sc. 9351, 234-241 (2015). https://doi.org/10.1007/978-3-319-24574-4_28Synthetic CT generation from CBCT images via deep learning
. Med. Phys. 47, 1115-1125 (2020). https://doi.org/10.1002/mp.13978Cbam: Convolutional block attention module
. Proc. Eur. Conf. Comput. Vis. 3–19 (2018). https://doi.org/10.1007/978-3-030-01234-2_1SAPT: a synchrotron-based proton therapy facility in Shanghai
. Nucl. Sci. Tech. 34, 148 (2023). https://doi.org/10.1007/s41365-023-01293-1Elastix: a toolbox for intensity-based medical image registration
. IEEE. T. Med. Imaging. 29, 196-205 (2009). https://doi.org/10.1109/TMI.2009.2035616Development of the open-source dose calculation and optimization toolkit matRad
. Med. Phys. 44, 2556-2568 (2017). https://doi.org/10.1002/mp.12251CBCT-based synthetic CT generation using deep-attention cycleGAN for pancreatic adaptive radiotherapy
. Med. Phys. 47, 2472-2483 (2020). https://doi.org/10.1002/mp.14121Feasibility of CycleGAN enhanced low dose CBCT imaging for prostate radiotherapy dose calculation
. Phys. Med. Biol. 68, 105014 (2023). https://doi.org/10.1088/1361-6560/acccceSynthetic CT generation based on CBCT using respath-cycleGAN
. Med. Phys. 49, 5317-5329 (2022). https://doi.org/10.1002/mp.15684Automatic brain tumor segmentation from Multiparametric MRI based on cascaded 3D U-Net and 3D U-Net++
. Biomed. Signal Process Control. 14, 95-103 (2022). https://doi.org/10.1016/j.bspc.2022.103979Study on analytical noise propagation in convolutional neural network methods used in computed tomography imaging
. Nucl. Sci. Tech. 33, 77 (2022). https://doi.org/10.1007/s41365-022-01057-3A new dental CBCT metal artifact reduction method based on a dual-domain processing framework
. Phys. Med. Biol. 68, 175016 (2023). https://doi.org/10.1088/1361-6560/acec29The authors declare that they have no competing interests.

