Introduction
Recently, the contribution of one-neutron transfer reaction to the total reaction cross-section has been widely studied. Significant effort has been made to disentangle the phenomena of sequential or simultaneous two-neutron transfer reactions at above and below the Coulomb barrier energies [1-4].
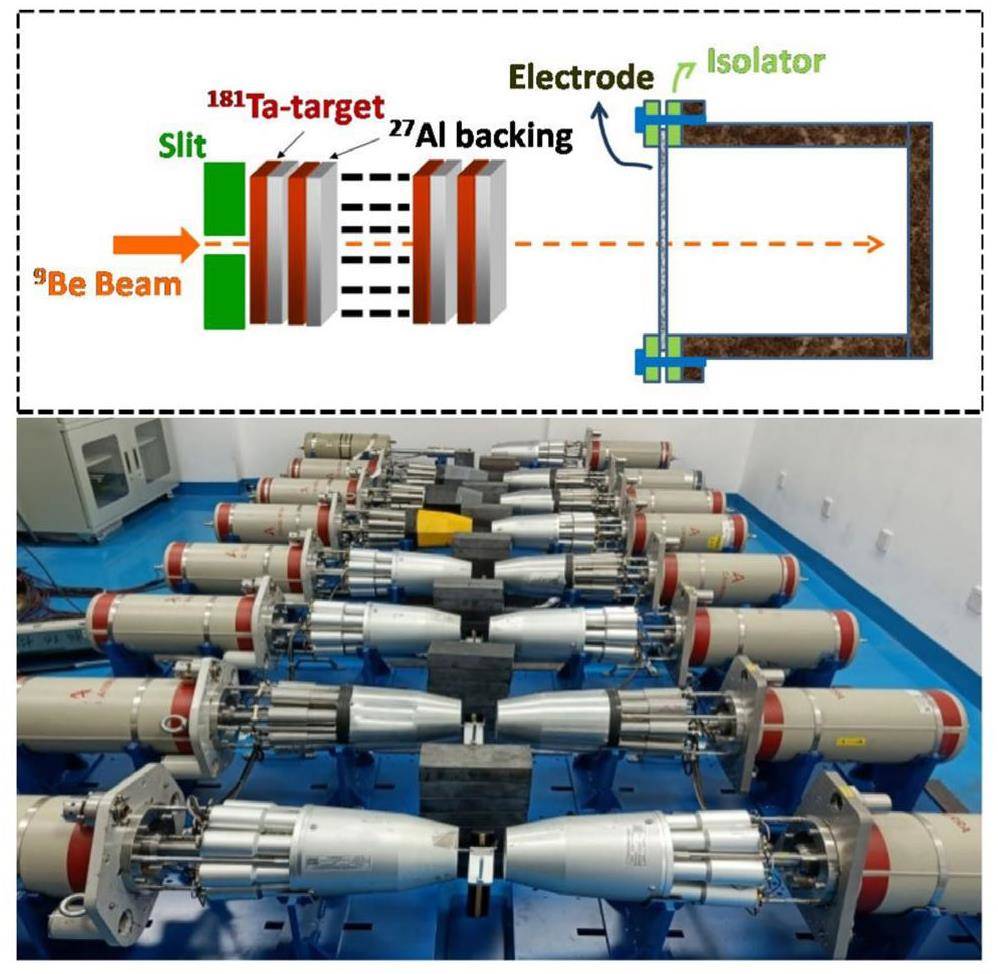
To further strengthen/enlighten these phenomena, a series of experiments were performed by researchers at the Institute of Modern Physics, Chinese Academy of Sciences using loosely bound projectiles such as 6,7Li and 9Be [5-8]. In these measurements, a stack of target-catcher assembly of appropriate thickness was irradiated using a preferred projectile beam of relevant energy to cover a wide energy range in a single irradiation. This method is highly efficient and accurate for determining the production cross-sections of residues with a half-life ranging from a few minutes to hundreds of days and decay via characteristic gamma-rays. A schematic diagram of the irradiation setup is shown in Fig. 1(top). These irradiated samples were subsequently transferred to a laboratory for offline-induced activity measurements of the characteristic gamma-rays. The detector dead time was maintained as low as possible (generally below 10%) to determine precise production cross-sections of the evaporation residues [9, 10]. Few hours after the irradiation, the samples had sufficiently high activity; therefore, a sample-to-detector distance of 5-8 cm is generally preferred, as shown in Fig. 1(bottom). In some cases, the isotopes of interest had longer half-lives; however, after a few days or weeks, the activity in the samples reduced. For nuclei with low activities, the samples must be measured as close as possible to the detector to increase the FEP efficiency. Our earlier publications contained detailed information of the experimental setup and analytical procedure [6-8].
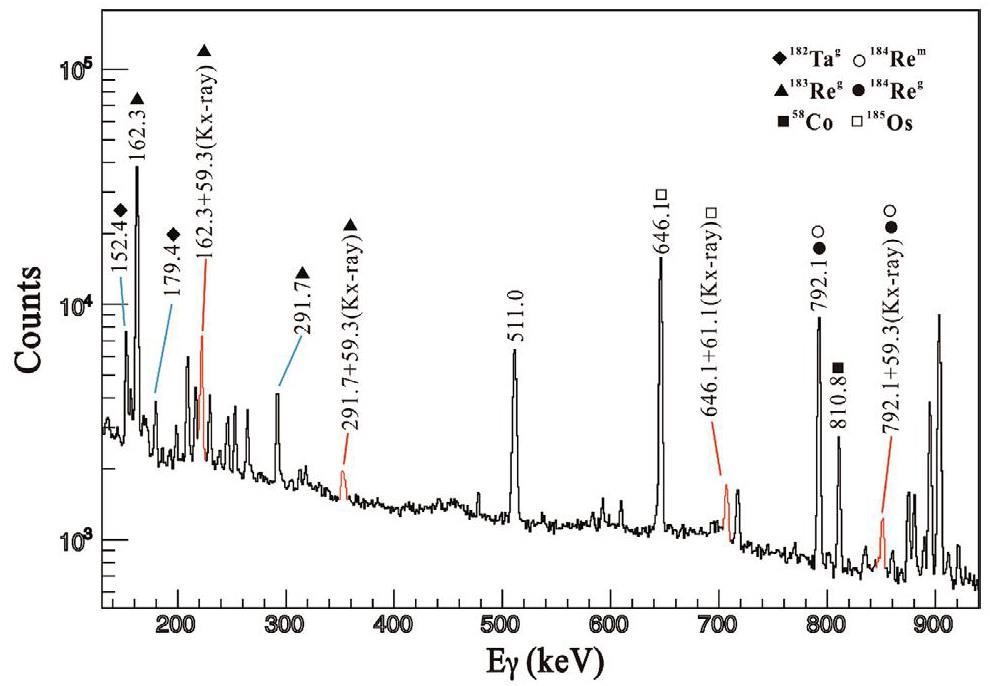
True coincidence summing (TCS) occurs in gamma-ray spectrometry when two or more cascade gamma-rays and/or X-rays are detected within the detector's resolving time. Within the timing resolution of the HPGe detector, the energy of these two gamma-rays/X-rays is deposited inside the detector's crystal [11-16], producing a single pulse that is equal to the total energy of the two individual photons. Summing in and out effects could occur as results of the addition of counts at the energy corresponding to the sum of two energies and the loss of counts from the two peaks, respectively. As shown in Fig. 2, because of the close proximity of the target-catcher (sample) assembly to the HPGe counting system, the sum peaks of the X-rays and fairly dominant γ-rays populated in 9Be+181Ta reactions were also detected and were clearly visible (the figure was adopted from our previous study [6]). The figure shows that at short sample-to-detector distance, the summing peak probability was significant and increased with decreasing target-to-detector distance; hence, for a precise/accurate determination of the FEP efficiency of these detectors, a summing peak coincidence correction was necessary. To overcome the constraints of true coincidence summing, the lack of standard mono-gamma-ray sources also encouraged the simulation of these detectors at short sample-to-detector distances. Thus, when the irradiated sample was measured very close to the HPGe detector, the calculated FEP efficiency might be inaccurate with multigamma-ray sources such as 60Co, 133Ba, and 152Eu, where the decayed gamma-rays were emitted in cascade with other gamma-rays.
Characterization of HPGe detector
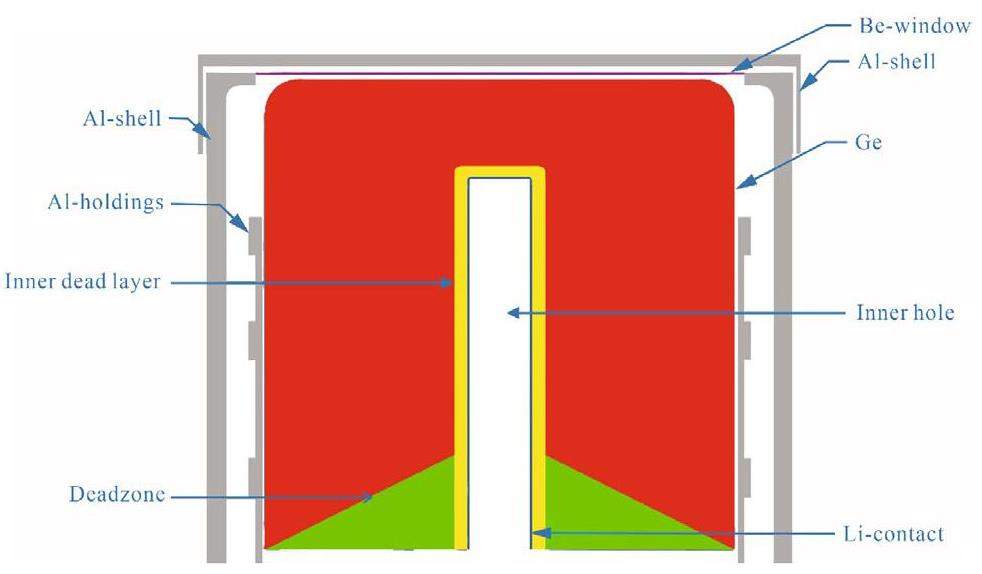
The detection of gamma-rays was performed using a coaxial n-type high-purity germanium detector (Model: EGC-70-230-R of Canberra) with 70% relative efficiency. A schematic diagram of the geometric configuration of the detector is shown in Fig. 3 and the details of the physical parameters are listed in Table 1. This HPGe detector has been used for more than a decade. The detector had a ~2.5 keV resolution for the 60Co gamma-ray at 1332 keV. In general, coaxial HPGe detectors utilize two types of electrical contacts: diffused contacts, which consist of an n+ layer that serves as a positive electrode, and metal contacts, which is composed of a p+ layer that serves as a negative electrode. These detectors are divided into two types: n-type and p-type detectors. The diffused contacts are on the outside surfaces of p-type coaxial HPGe detectors, and the ion-implanted contacts are in the inner hole. The p-type detectors are less useful for gamma-rays below 40 keV [17] because the diffused contacts are thicker. However, the thinner metal contacts on the exterior layer of n-type coaxial detectors are usable down to 5 keV. In this study, a value of 0.3 μm was assigned to the outer dead layer composed of boron.
| Parameter | Nominal value (mm) | Optimized value (mm) |
|---|---|---|
| Crystal radius | 36 | 36 |
| Crystal length | 72 | 72 |
| Radius of hollow cylinder | 4.4 | 4.4 |
| Length of hollow cylinder | 56 | 56 |
| Inner Li-contact thickness | 0.6 | 0.6 |
| Al shell thickness | 2 | 2 |
| Be-window thickness | 0.3 | 0.3 |
| Outer B-contact thickness | 0.0003 | 0.0003 |
| Inner Ge dead layer thickness | – | 2 |
| Conical dead zone radius | – | 36 |
| Conical dead zone depth | – | 14.5 |
All the spectra were analyzed using digital pulse processor Pixie-16 modules by XIA LLC [18] with a 100 MHz sample rate. The signal from the preamplifier of the HPGe detector was directly fed into the digitizer. First, the efficiency of the detector was measured at a distance of 25 cm by counting standard point sources 60Co, 133Ba, 137Cs, and 152Eu with activities of 88, 118, 300.2, and 179.3 kBq, respectively. The samples were counted for a sufficient period of time to maintain a less than one percent statistical uncertainty.
GEANT4 [19-21] is a Monte Carlo simulation package [22-25] supported by the European Council for Nuclear Research (CERN) community. It has a very powerful toolkit for modeling detector geometry, tracking, hits, and phenomena of various physics processes possible for the passage of particles through matter. All possible physics processes, considering the interaction of gamma-rays with matter, were considered. Gamma-ray photons, electrons, and positrons are typically produced during the interaction of gamma-rays with detector substances [26, 27]. The most dominant interaction progressions for gamma-rays are the photoelectric effect, Compton scattering, and pair production. The configured set-up defined in the GEANT4 simulation is shown in Fig. 3. The geometry also included detector housings, including absorbing materials, aluminum end caps, and dead layers of the germanium crystal.
Most of the setup components were built into precise geometries. The original computer-aided design (CAD) of the setup was used as the foundation for the geometry description markup language (GDML) [28]. Characterizing a detector is challenging, particularly when its physical properties are obscured. Dead layer thickness is important in these estimations. The GEANT4 radioactive decay module can replicate efficiently the nuclide's entire decay path. The simulations used Livermore physics list [29] of low-energy electromagnetic processes. For each event, the energy deposited in the active area of the detector volume was gradually gathered. In the simulations, the event-wise data were used to analyze photo-peak efficiency and Compton scattering. The detector resolution was incorporated into the simulation results by redistributing the simulated data of each event with a random variable based on a Gaussian distribution of the standard deviation. The value of the insensitive zone was increased in steps of 1% to replicate the experimental spectrum and FEP efficiency. 10% insensitive zone of conical shape at the rear part of the Ge crystal was assumed in the simulations. A similar procedure was also performed in our previous study [30, 31].
Obtaining mono-energetic gamma-ray sources is challenging, and some require frequent replacement owing to their short half-lives, reducing their utility. Although multigamma-ray sources provide acceptable efficiency calibration, the calibration can be incorrect at tighter sample detector geometry due to coincidence summation effects. To simulate the efficiency, a model approach such as GEANT4 can be utilized. This method offers the advantage of replicating efficiency for a wide range of sample shapes and matrices without any coincidence-summing effects.
First, GEANT4 simulations were performed for point source geometry using the detector's dimensions provided by the manufacturer. In each simulation, 106 particles were sampled to reduce statistical uncertainties. Figure 4 shows the experimental and GEANT4-simulated FEP efficiencies. The errors on peak areas and abundances were used to calculate the effective errors of the experimental efficiencies, as shown in the figure.
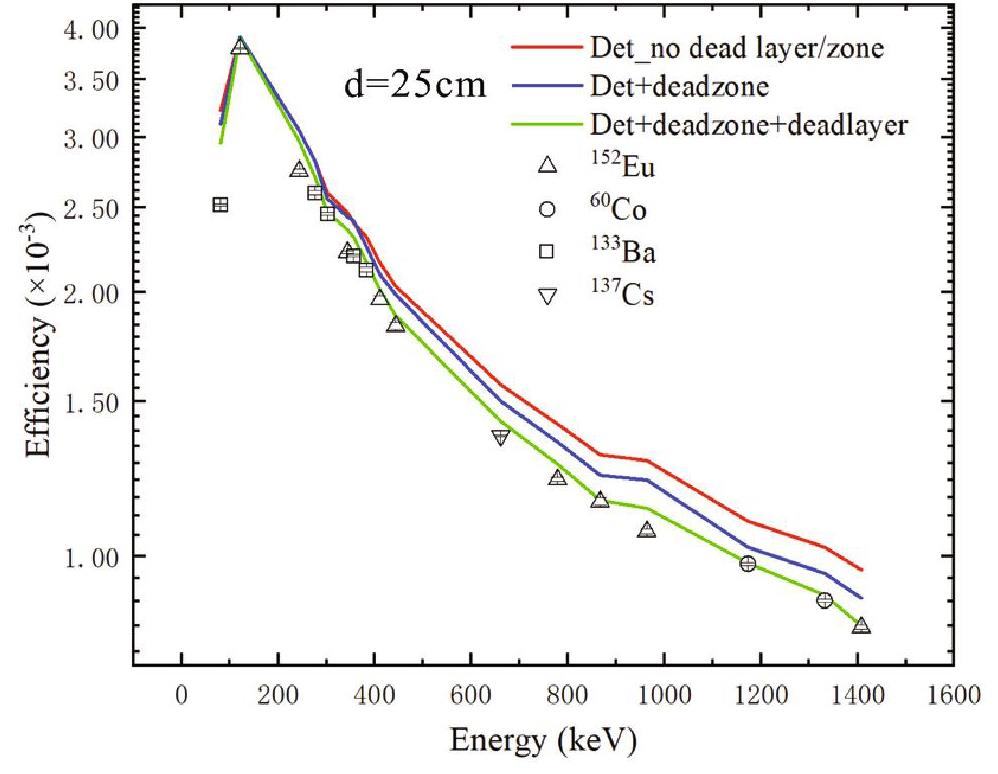
The simulated efficiencies were higher than the experimental efficiencies for all gamma-ray energies at a sample-to-detector distance of ~25 cm, indicating that the detector dimensions provided by the manufacturer were probably incorrect. The same effects were observed in several other measurements reported in the literature [11, 14, 32-35]. Similar to a previous study, we also increased the thickness of the inner dead layer by 0.2 mm in each step of the simulation to compare with the experimental FEP efficiency [36-44]. A considerable agreement was achieved at a total dead layer thickness of 2 mm and 10% dead zone in the Ge-crystal. Hence, simulating the experiment and estimating the physical parameters collected experimentally can be used to validate any experimental data or procedure. The method is highly beneficial in determining the detector's full energy peak (FEP) and total efficiency when it is difficult to perform owing to experimental constraints [45-52].
Calculation of Coincidence Summing Correction Factors
True coincidence summing becomes prominent at a short source-to-detector distance. At small distances, these effects result in an erroneous measurement of the activity of the source. Summing coincidence effects are independent of the source's count rate and are exclusively determined using the emission probabilities and detection efficiencies of cascade gamma-rays [53-55]. The magnitude of these adjustments increases significantly at short sample-to-detector distances owing to the higher likelihood of two gamma-rays reaching the detector simultaneously.
GEANT4 simulations
As discussed in Sect. 2, the detector geometry was initially optimized at a sample-to-detector distance of 25 cm. After achieving a satisfactory agreement between the experimental and simulated efficiencies for the optimized geometry, further simulations were conducted at various sample-to-detector distances considering the two physics definitions in GEANT4 of the mono-gamma-ray emitter for each gamma-ray and the ‘real-sources’ as 60Co, 133Ba, 137Cs, and 152Eu (including all gammas and X-rays in the decay scheme). Similar to Ref. [12], the summing coincidence correction factors kTCS were computed by taking the ratios of efficiencies obtained using the two cases as
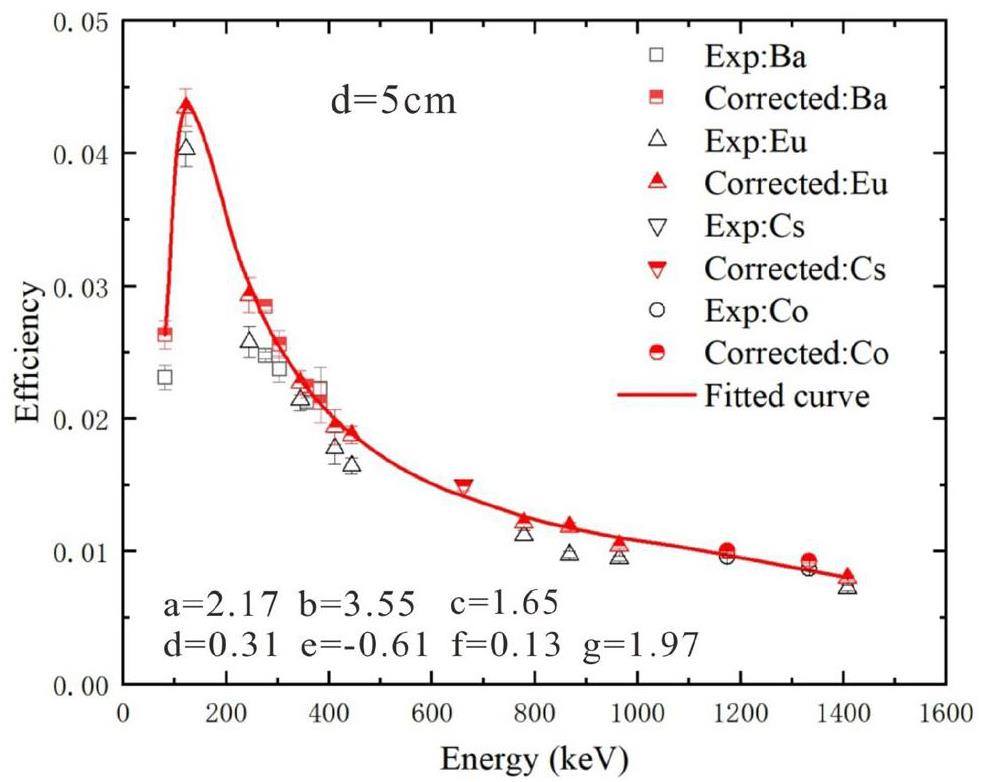
As simulations do not suffer from the true coincidence summing effect under the assumptions of a mono-energetic gamma-ray source, these summing coincidence correction factors were subsequently used to correct the experimental efficiencies. Table 2 presents the experimentally determined efficiencies for these sources at a source-to-detector distance of 5 cm, the corresponding summing coincidence correction factors (kTCS), and corrected experimental efficiencies. These results are shown in Fig. 5. In line with the Radware package [56], the relationship between the FEP efficiency and the gamma-ray energy is typically described using a standard fitting function described as follows:
| Source | Eγ (keV) | Effi. (exp.) ϵti | kTCS | Corr. effi. (exp.) ϵti×kTCS |
|---|---|---|---|---|
| 137Cs | 661.66 | 0.01499 | 0.9977 | 0.01496 |
| 60Co | 1173.23 | 0.00960 | 1.0464 | 0.01005 |
| 1332.49 | 0.00871 | 1.0640 | 0.00927 | |
| 81.00 | 0.02313 | 1.1388 | 0.02634 | |
| 276.40 | 0.02478 | 1.1503 | 0.02850 | |
| 133Ba | 302.85 | 0.02375 | 1.0789 | 0.02562 |
| 356.01 | 0.02124 | 1.0560 | 0.02243 | |
| 383.85 | 0.02229 | 0.9484 | 0.02121 | |
| 121.78 | 0.04032 | 1.0780 | 0.04347 | |
| 244.70 | 0.02578 | 1.1384 | 0.02935 | |
| 344.28 | 0.02144 | 1.0596 | 0.02272 | |
| 411.12 | 0.01777 | 1.0919 | 0.01940 | |
| 152Eu | 443.96 | 0.01644 | 1.1411 | 0.01876 |
| 778.90 | 0.01121 | 1.0839 | 0.01215 | |
| 867.38 | 0.00975 | 1.2164 | 0.01186 | |
| 964.06 | 0.00947 | 1.1012 | 0.01043 | |
| 1408.01 | 0.00724 | 1.1029 | 0.00799 |
Furthermore, the efficiencies obtained from GEANT4 are free of any true coincidence summation effects, allowing them to be employed at short sample-to-detector distances. There was a significant agreement between the simulated and experimental efficiencies after applying the summing coincidence corrections to the experimental data. Because of the high dead time of the detection system, using a strong source might not be appropriate for the accurate determination of the FEP efficiency of the HPGe detector in the experiment; however, using the developed model, the summing peak effect could be corrected at these short sample-to-detector distances, as shown in Fig. 5, using available standard gamma sources. After applying these appropriate correction factors, a new FEP efficiency curve was generated and the pertinent values for the specific detected gamma-rays were calculated. This facilitated in determining the accurate experimental cross-sections of the low-activity long-lived evaporation residues and the transfer reaction residues at short sample-to-detector distances.
Analytical Method
An analytical approach for computing coincidence correction factors was initially established by Andreev et al. [53] and subsequently developed and modified by others [54, 55]. The FEP efficiency, total efficiencies, and decay parameters such as the parent nuclei's decay mode, the energies of the X-ray transitions, the probability of X-ray emission, the K-capture probability in electron capture decay, the mean X-ray energies, and the total and K conversion coefficients are needed to calculate the coincidence correction factors using the analytical method [13, 12]. The equation must include information of all these factors to compute the probability of simultaneous emission of two or more gamma-rays with higher precision. The coincidence correction factor (kTCS) is described by the following equation:
| Source | Eγ (keV) | kTCS Sim. Anal. |
kTCS Sim. Anal. |
kTCS Sim. Anal. |
kTCS Sim. Anal. |
||||
|---|---|---|---|---|---|---|---|---|---|
| 60Co | 1173.23 | 1.204 | 1.211 | 1.132 | 1.130 | 1.046 | 1.047 | 1.025 | 1.020 |
| 1332.49 | 1.226 | 1.219 | 1.146 | 1.135 | 1.064 | 1.049 | 1.034 | 1.021 | |
| 81.00 | 1.529 | 1.550 | 1.332 | 1.328 | 1.139 | 1.106 | 1.060 | 1.040 | |
| 276.40 | 1.628 | 1.603 | 1.403 | 1.375 | 1.150 | 1.120 | 0.998 | 1.044 | |
| 133Ba | 302.85 | 1.451 | 1.579 | 1.278 | 1.362 | 1.079 | 1.116 | 1.003 | 1.043 |
| 356.01 | 1.321 | 1.464 | 1.224 | 1.298 | 1.056 | 1.099 | 1.032 | 1.037 | |
| 383.85 | 0.934 | 0.967 | 0.920 | 0.977 | 0.948 | 0.992 | 0.953 | 0.998 | |
| 121.78 | 1.526 | 1.560 | 1.321 | 1.328 | 1.078 | 1.105 | 1.020 | 1.041 | |
| 244.30 | 1.835 | 1.867 | 1.510 | 1.475 | 1.138 | 1.141 | 1.032 | 1.052 | |
| 344.28 | 1.183 | 1.156 | 1.107 | 1.100 | 1.060 | 1.036 | 0.981 | 1.015 | |
| 411.12 | 1.473 | 1.494 | 1.310 | 1.285 | 1.092 | 1.091 | 0.981 | 1.035 | |
| 152Eu | 443.96 | 1.792 | 1.768 | 1.441 | 1.432 | 1.141 | 1.131 | 1.016 | 1.049 |
| 778.90 | 1.297 | 1.280 | 1.154 | 1.169 | 1.084 | 1.059 | 1.062 | 1.024 | |
| 867.38 | 1.911 | 1.974 | 1.615 | 1.519 | 1.216 | 1.150 | 1.105 | 1.055 | |
| 964.06 | 1.542 | 1.471 | 1.328 | 1.265 | 1.292 | 1.070 | 1.095 | 1.035 | |
| 1408.01 | 1.503 | 1.532 | 1.299 | 1.324 | 1.103 | 1.103 | 1.047 | 1.038 | |
Summing Peak Probability: Experiment vs. Simulations
The likelihood of detecting two gamma-rays concurrently decreased as the distance between the source and the detector increased. However, summation occurred to some extent at all source-to-detector distances. In practical terms, TCS losses diminish after a certain distance, which depends on the size of the detector. To investigate these effects, we compared the summing peak probabilities of the multigamma-ray sources (60Co, 133Ba, and 152Eu) as functions of source-to-detector distance between the experimental and GEANT4-simulated spectra. We also determined the summing peak probability (SP) as a function of source-to-detector distance for the summing peak energy in the gamma-ray spectrum. The summing peak probability is expressed as
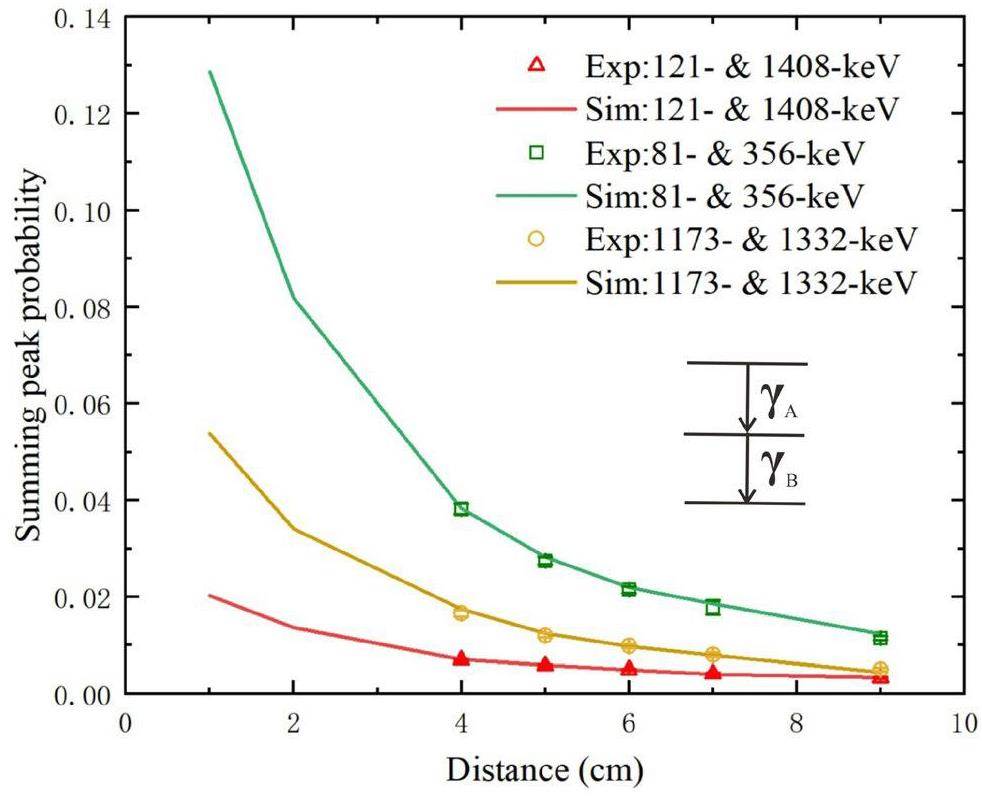
To simplify computations, only the coincident gamma-ray energies of 121&1408 keV in 152Eu, 81&356 keV in 133Ba, and 1173&1332 keV in 60Co were evaluated. Figure 6 shows the simulated and experimental summing peak probabilities. Although the simulations were also performed for source-to-detector distances of 1, 2, and 3 cm, the experimental data is not available below the source-to-detector distance of 4 cm owing to the high deadtime of the measurement setup. The good agreement between the experimental and simulated summing peak probabilities shown in Fig. 6 indicates that simulated summing peak probabilities can be considered when data are unavailable for smaller distances due to experimental constraints.
Summary and Conclusions
This study was performed to optimize the HPGe detector parameters that our laboratory generally utilizes for gamma spectrometric measurements. A closed-end coaxial n-type HPGe detector with a 70% relative efficiency was used in this study. The summing effect in the HPGe detector was significant at shorter sample-to-detector distances, impacting the estimation of low cross-section residues in transfer reactions below the Coulomb barrier energies and measurement of radioactivity in environmental samples. Efficiency calibration of the detector was crucial in gamma-ray spectrometry to acquire quantitative information about the monitored nuclide. The FEP efficiency was significantly influenced by the entire volume of the detector rather than just its diameter or length. The detector's efficiency decreased as the dead layer thickness increased because of the gamma-ray attenuation in the dead layer and reduction of the active volume of the detector. GEANT4 has been recognized as a tool for generating simulated data for calculating summing coincidence correction factors for different gamma-rays of a specific source. The modeled detector geometry has a significant impact on the accuracy of GEANT4 simulations. Using optimized geometries of the HPGe detector at a distance of approximately 25 cm, where summing effects are negligible, the summing probability increased at smaller separations/distances between the source and detector's front surface. A consistent agreement between experimental and simulated efficiencies was observed at these distances. An analytical approach was also used to determine the coincidence correction coefficients for 60Co, 133Ba, and 152Eu sources as functions of source-to-detector distance considering mono-energetic gamma-sources. When the sample-to-detector distance exceeded 9 cm, the correction factors for coincidence were minimal. Correction factors up to 1.615 at d=2 cm and 1.911 at d=1 cm were obtained for 152Eu at 867 keV, which significantly impacted the FEP efficiency at these distances. Optimizing detectors' geometries is beneficial because after their dimensions are tuned using experimental efficiencies, they can be used to determine the efficiencies for various sample geometries without using gamma-ray standards.
Observation of Excited States in 5H
. Phys. Rev. Lett. 93,Evidence for Phonon Mediated Pairing Interaction in the Halo of the Nucleus 11Li
. Phys. Rev. Lett. 105,High-resolution measurement of the 118,124Sn(p,t)116,122Sn reactions: Shell-model and microscopic distorted-wave Born approximation calculations
. Phys. Rev. C. 83,The 95Zr(n, γ)96Zr cross section from the surrogate ratio method and its effect on s-process nucleosynthesis
. Astrophys. J. 848, 98 (2017).https://doi.org/10.3847/1538-4357/aa8c74One-neutron stripping from 9Be to 169Tm,181Ta, and 187Re at near-barrier energies
. Phys. Rev. C. 93,Isomer yield ratios in 184Re from the 9Be+181Ta reaction
. Phys. Rev. C. 99,Fusion reaction studies for the 9Be+89Y system at above-barrier energies
. Phys. Rev. C. 101,Measurement and analysis of the isomeric cross-section ratios for the 94Tc nucleus
. Phys. Rev. C. 102,Optimization of pulse processing parameters for HPGe gamma-ray spectroscopy systems used in extreme count rate conditions and wide count rate ranges
. J. Radioanal Nucl. Chem. 296, 503-508 (2013).https://doi.org/10.1007/s10967-012-2113-3Radiation detector deadtime and pile up: A review of the status of science
. Nucl. Eng. Technol. 50, 1006-1016 (2018).True coincidence summing correction for a BEGe detector in close geometry measurements
. Appl. Rad. Isotopes. 200,Summing coincidence correction for γ-ray measurements using the HPGe detector with a low background shielding system
. Nucl. Instrum. Meth. Phys. Res. A. 880, 22-27 (2018).Calculation of Coincidence Summing Correction Factors for an HPGe detector using GEANT4
. J. Environment. Rad. 158-159, 114-118 (2016). https://doi.org/10.1016/j.jenvrad.2016.04.008.Experimental and MC determination of HPGe detector efficiency in the 40–2754 keV energy range for measuring point source geometry with the source-to-detector distance of 25 cm
. Appl. Radiat. Isotopes. 64(10), 1346-1349 (2006). https://doi.org/10.1016/j.apradiso.2006.02.083Research progress on correction techniques for coincidence summing effect in γ-ray spectrometry
. Nuclear Techniques 47(03),Application of the coincidence summing-in peaks in spectrum analysis of CTBT Proficiency test exercises sample
. Nucl. Instrum. Meth. Phys. Res. A. 1010,Measurement of the Compton scattering in germanium with a p-type point-contact germanium detector for dark matter detection
. J. Instrument. 18(04),GEANT4 - a simulation toolkit
. Nucl. Instrum. Meth. Phys. Res. A. 506, 250-303 (2003).https://doi.org/10.1016/S0168-9002(03)01368-8Recent developments in Geant4
. Nucl. Instrum. Meth. Phys. Res. A. 835, 186-225 (2016).https://doi.org/10.1016/j.nima.2016.06.125GEANT4 code for simulation of a germanium gamma-ray detector and its application to efficiency calibration
. Nucl. Instrum. Meth. Phys. Res. A. 518(3), 764-774 (2004).https://doi.org/10.1016/j.nima.2003.09.057Development of a software package for solid-angle calculations using the Monte Carlo method
. Nucl. Instrum. Meth. Phys. Res. A. 736, 40-45 (2014). https://doi.org/10.1016/j.nima.2013.10.048.Calculation of the detection efficiency of an HPGe detector in low energy photon measurement with Monte Carlo method
. Nuclear Electronics and Detection Technology. 274-277 (2005).Monte Carlo calculations and experimental measurements of dosimetry parameters of a new 103Pd source
. Med. Phys. 27(5), 1108-1112 (2000).https://doi.org/10.1118/1.598975SAGE: a Monte Carlo simulation framework for experiments with germanium detectors
. J. Instrument. 16,Geometry description markup language for physics simulation and analysis applications
. IEEE Trans. Nucl. Sci. 53(5), 2892-2896 (2006).https://doi.org/10.1109/TNS.2006.881062Validation of the Geant4 electromagnetic photon cross-sections for elements and compounds
. Nucl. Instrum. Meth. Phys. Res. A 618(1), 315-322 (2010).https://doi.org/10.1016/j.nima.2010.02.112Simulated characteristics of the DEGAS γ-detector array
. Nucl. Instrum. Meth. Phys. Res. A 890, 148-154 (2018).https://doi.org/10.1016/j.nima.2018.02.062Characteristics of the DEGAS-FATIMA Hybrid setup for the DESPEC program at NUSTAR
. Nucl. Instrum. Meth. Phys. Res. A 987,From Ge(Li) detectors to gamma-ray tracking arrays- 50 years of gamma spectroscopy with germanium detectors
. Prog. Part. Nucl. Phys. 60(2), 283-337 (2008).https://doi.org/10.1016/j.ppnp.2007.09.001Characterization of large volume HPGe detectors. Part II: Experimental results
. Nucl. Instrum. Meth. Phys. Res. A. 569(3), 774-789 (2006).https://doi.org/10.1016/j.nima.2006.08.130Accounting for incomplete charge collection in Monte Carlo simulations of the efficiency of well-type Ge-detectors
. Nucl. Instrum. Meth. Phys. Res. A. 498(1), 340-351 (2003).https://doi.org/10.1016/S0168-9002(02)02080-6Spectroscopic performance evaluation and modeling of a low background HPGe detector using GEANT4
. Nucl. Instrum. Meth. Phys. Res. A. 1058,Characterization of the thickness of dead layer and cold finger for portable HPGe γ-spectrometer
. Radiat. Phys. Chem. 204,Modeling the charge collection efficiency in the Li-diffused inactive layer of P-type high purity germanium detector
. Appl. Radiat. Isotopes. 193,Measurement of the dead layer thickness in a p-type point contact germanium detector
. Chinese Phys. C 40(9),Study of inactive layer uniformity and charge collection efficiency of a p-type point-contact germanium detector
. Appl. Radiat. Isotopes. 127, 130-136 (2017).https://doi.org/10.1016/j.apradiso.2017.05.023Performance revaluation of a N-type coaxial HPGe detector with front edges crystal using MCNPX
. Appl. Rad. Isotopes. 97, 106-112 (2015). https://doi.org/10.1016/j.apradiso.2014.12.027Determination of homogeneity of the top surface deadlayer in an old HPGe detector
. Appl. Rad. Isotopes. 147, 182-188 (2019).https://doi.org/10.1016/j.apradiso.2019.02.019Determination of dead-layer variation in HPGe detectors
. Appl. Rad. Isotopes. 87, 331-335 (2014).https://doi.org/10.1016/j.apradiso.2013.11.046Determination of the dead-layer thickness for both p- and n-type HPGe detectors using the two-line method
. J. Radioanal Nucl. Chem. 315, 95-101 (2018).Fabrication and characterization of high-purity germanium detectors with amorphous germanium contacts
. J. Instrument. 14(02),Characterization of a broad-energy germanium detector for its use in CJPL
. Nucl. Sci. Tech. 28, 7 (2017). https://doi.org/10.1007/s41365-016-0162-yCalibration of intrinsic peak efficiency of a high-purity germanium detector for X-ray energy of 5.48–302.85 keV
. Nucl. Instrum. Meth. Phys. Res. A 903, 262-266 (2018). https://doi.org/10.1016/j.nima.2018.06.064Improved radioxenon gamma-spectrometry counting system and its efficiency calibration: Monte Carlo simulation and experimental results at enriched xenon counting environment
. J. Radioanal. Nucl. Chem. 279, 83-91 (2009). https://doi.org/10.1007/s10967-007-7299-zPerformances of different efficiency calibration methods of high-purity-germanium gamma-ray spectrometry in an inter-comparison exercise
. Nucl. Sci. Tech. 30, 37 (2019). https://doi.org/10.1007/s41365-019-0562-xMonte Carlo efficiency transfer method for full energy peak efficiency calibration of three type HPGe detectors: A coaxial N-type, a coaxial P-type and four BEGe detectors
. Nucl. Instrum. Meth. Phys. Res. A 564, 608-613 (2006). https://doi.org/10.1016/j.nima.2006.03.013Empirical relation between efficiency and volume of HPGe detectors
. Nucl. Instrum. Meth. Phys. Res. A 262, 439-440 (1987). https://doi.org/10.1016/0168-9002(87)90885-0A hybrid method for calculating absolute peak efficiency of germanium detectors
. Nucl. Instrum. Meth. Phys. Res. A 413, 281-292 (1998). https://doi.org/10.1016/S0168-9002(98)00563-4.A detailed investigation of HPGe detector response for improved Monte Carlo efficiency calculations
. Nucl. Instrum. Meth. Phys. Res. A 587(2), 304-314 (2008). https://doi.org/10.1016/j.nima.2008.01.062.Consideration of cascade transitions in determining the absolute yield of gamma rays
. Instrum. Exp. Tech. (USSR) (Engl. Transl.) 15(5), 1358-1360 (1972).Influence of source-detector distance on relative intensity and angular correlation measurements with Ge(Li) spectrometers
. Nucl. Instrum. Meth. 130(1), 189-197 (1975). https://doi.org/10.1016/0029-554X(75)90173-1.Coincidence summing corrections in Ge(Li)-spectrometry at low source-to-detector distances
. Nucl. Instrum. Meth. 158, 471-477 (1979).The authors declare that they have no competing interests.

