Introduction
The physical protection system (PPS) [1], is a critical protective barrier that plays an important role in securing safety-critical infrastructures such as nuclear facilities. The system integrates people, procedures, and equipment to secure facilities and assets against threats of theft, robbery, illegal transfer, and other potentially harmful activities [1]. Thus, it is crucial to establish an effective physical protection system design and an efficient evaluation mechanism to ensure the safety and security of critical infrastructure.
Various methods, approaches, techniques and tools have been proposed to improve PPS security, including VideoCAD (Autodesk, USA), SketchUP (Trimble, USA), Scribe3D (Sandia National Laboratories, USA), SAVI/ASSESS (Sandia National Laboratories, USA), SAPE (KINAC, South Korea), Sprut (ISTA, Russia), Vega-2 (Eleron, Russia), Analizator, SATANO (University of Zilina, Slovakia), EMRALD (Idaho National Laboratory, USA), etc. have been proposed to improve PPS security performance [2]. Recent studies [3, 4] on the PSS vulnerability assessment focus on several areas, including simulation and three-dimensional (3D) modeling, adversary path planning optimization, defense models for neutralization analysis, overall system effectiveness, and cost-benefit analysis. For example, Tekinerdogan et al. [5] proposed a model-based systems engineering approach to account for the Design Basis Threat (DBT) during the PPS design process. Andiwijayakusuma et al. [6] developed a multipath analysis tool to assess PSPS vulnerability based on an adaptive sequence diagram (ASD). A heuristic approach was proposed by Zou et al. [7] for evaluating the PPS effectiveness based on two-dimensional (2D) engineering drawings. KINAC introduced a vulnerability assessment simulation program based on AVERT and modeling procedures to evaluate vulnerability to physical protection [8]. RhinoCorps [9] developed a suite of commercial modeling and simulation tools to support a reliable, realistic, and affordable vulnerability assessment of critical sites.
Path-based system vulnerability analysis has received considerable attention from researchers and practitioners. Path-based vulnerability analyses are mostly implemented based on the adversarial sequence interruption estimate (EASI) model and ASD models. The EASI model was first developed by Sandia National Laboratories in the 1970s [10] and is a one-dimensional (1D) single-path analysis model to determine the probability of interruption (PI) for evaluating the effectiveness of PPS. Subsequently, various tools, including SAVI (Systematic Analysis of Intrusion Vulnerability) [11], ASSESS (Analytic System and Software to Evaluate Safeguards and Security) [12], MAPPS (Multipath Analysis of Physical Protection Systems) [13], Multipath Analysis Tool for Vulnerability Assessment (MAVA) [14], were developed based on the EASI model. These tools expanded its application to include site modeling, insider threat, and neutralization analysis for multipath adversary analysis. Andiwijayakusuma et al. [15] recently developed an EASI-based multipath analysis code for nuclear security systems with a variability extension. While 2D and 3D modeling techniques have been incorporated to simulate high-security facilities, the ASD model remains a point-to-point connection diagram limited to finite-path optimization. The ASD model was implemented by setting critical detection points based on the meantime delay remaining after detection (TR) and the response time (RFT). The distances between the security areas were assumed to be exactly the same for all possible adversary intrusion paths. To address this issue, Jang et al. [16] developed a systematic analysis of the (SAPE) code based on a two-dimensional map of a facility. Zou et al. [17] proposed an A*-heuristic pathfinding algorithm to evaluate vulnerable intrusion paths in a 2D plane. In addition to the A* heuristic search, Zou explored the ant colony optimization algorithm [18], absorbing the Markov chain [19], and the structure-analytic hierarchy approach [20] to evaluate the effectiveness of the physical protection system. M. Saga et al. [21] used the principles of simulated annealing to control the parameters of local search methods in memetic algorithms that aim at global optimum path planning. The authors proposed a 2D-graph model-based heuristic approach to visually backtrack the most vulnerable paths of the PPS design in Ref. [22].
In new-generation evaluation schemes, 3D modeling is generally integrated into the PPS design and performance analysis process. Zou et al. [23] proposed an integrated platform for PPS design and analysis in a 3D modeling environment. Zollo and Assogna [24] used 3D models and discrete simulations for infrastructure security applications. Similarly, Zhang et al. [25] used 3D models and simulations to support the force-on-force test of a physical protection system. Talbot et al. [26] proposed a model accreditation and review process to calculate the effectiveness of a security system for commercial nuclear sites using 3D models, in which the security risk at the sites can be quantified to support risk-informed decision-making. Sandia National Laboratories developed an advanced tabletop tool called Scribe3D [27], which supports better visualization and simulation-based results with greater precision. Cohn et al. [28] developed a leading simulator/trailer simulator method as part of an integrated safety and security analysis for the Scribe3D model of a nuclear power plant. A summary of the methodologies and tools applicable to 3D security simulations and vulnerability analyses can also be found in [29]. In addition to physical vulnerability assessments, integrated communication and network security in physical protection systems, such as physical layer security, have aroused widespread concern in the cybersecurity community [30-33].
The integration of 3D models provide an intuitive birds-eye view of a PPS design, significantly enhancing visualization and optimization. The surreal feeling in the scene created by refined 3D models not only vividly illustrates adversary intrusion paths and strategies have also enabled precise positioning of the target objects. However, computationally intensive problems are encountered in adversary path analysis and PPS effectiveness evaluation when sophisticated 3D meshes are used to represent geographic data such as buildings, terrain, and other structures. This challenging problem is also common in heuristic searches for the optimal adversary path. Compared with conventional distance-based heuristic solvers for the most optimal path identification, the heuristic estimation of the probability of interruption (PI) is much more complicated because of the unknown distribution of detection opportunities and delay elements along the adversary paths. As a result, most current approaches and codes developed for PPS design and effectiveness evaluation must convert the 2D map or 3D scene of a facility into an ASD model to simplify the adversary path analysis. The existing literature on adversary path analysis in 3D models of critical infrastructure protection is scarce. Therefore, in this study, a novel A* heuristic pathfinding algorithm is proposed to fill the gap in identifying the most optimal adversary path in a 3D modeling environment. The purpose of this study was to build upon our previous research on a 2D map heuristic approach [22] by extending it to 3D models of physical protection systems, incorporating vertical movements of agents. Algorithm A* is adopted to heuristically search for globally optimal solutions in vulnerability analysis, where the effectiveness of the PPS is measured with the probability of interruption (PI) based on the EASI model. The innovative contribution of this study is that we are making enemies or response forces move through space in both the horizontal and vertical directions. In this manner, a two-dimensional path map can be extended to a 3D environment. Simultaneously, search efficiency can be significantly improved by the A*-heuristic pathfinding algorithm with rational cost estimation. The major contribution of this study is the proposal of a novel heuristic estimation scheme is proposed to enhance the efficiency and effectiveness of adversarial path planning in a 3D environment based on the EASI model. A waypoint navigation heuristic was developed to refine the detection and distance fields to obtain an accurate estimate of the cost of reaching the goal. A geometric probability model was developed to provide the best estimate of the likelihood of the intrusion alarm system detecting adversaries. The proposed heuristic solver is computationally efficient in evaluating 3D security vulnerabilities by increasing the spatial orientation and navigation used to position and guide agent movements through orthogonal space partitions.
The remainder of this paper is organized as follows: Section 2 introduces a novel framework integrating A*-heuristic pathfinding algorithm with 3D modeling environment. The A*-heuristic pathfinding algorithm was implemented based on the EASI model to calculate the probability of an interruption (PI). Section 3, presents the 3D models of a hypothetical laboratory facility site developed as the basis for 3D security modeling and vulnerability assessment. A comparison between the A* and Dijkstra algorithms for identifying the most vulnerable adversarial paths is presented in Sect. 4. The discussion and conclusions are presented in Sects. 5 and 6, respectively.
An Integrated Framework for Vulnerability Analysis of PPS Design in 3D Environment
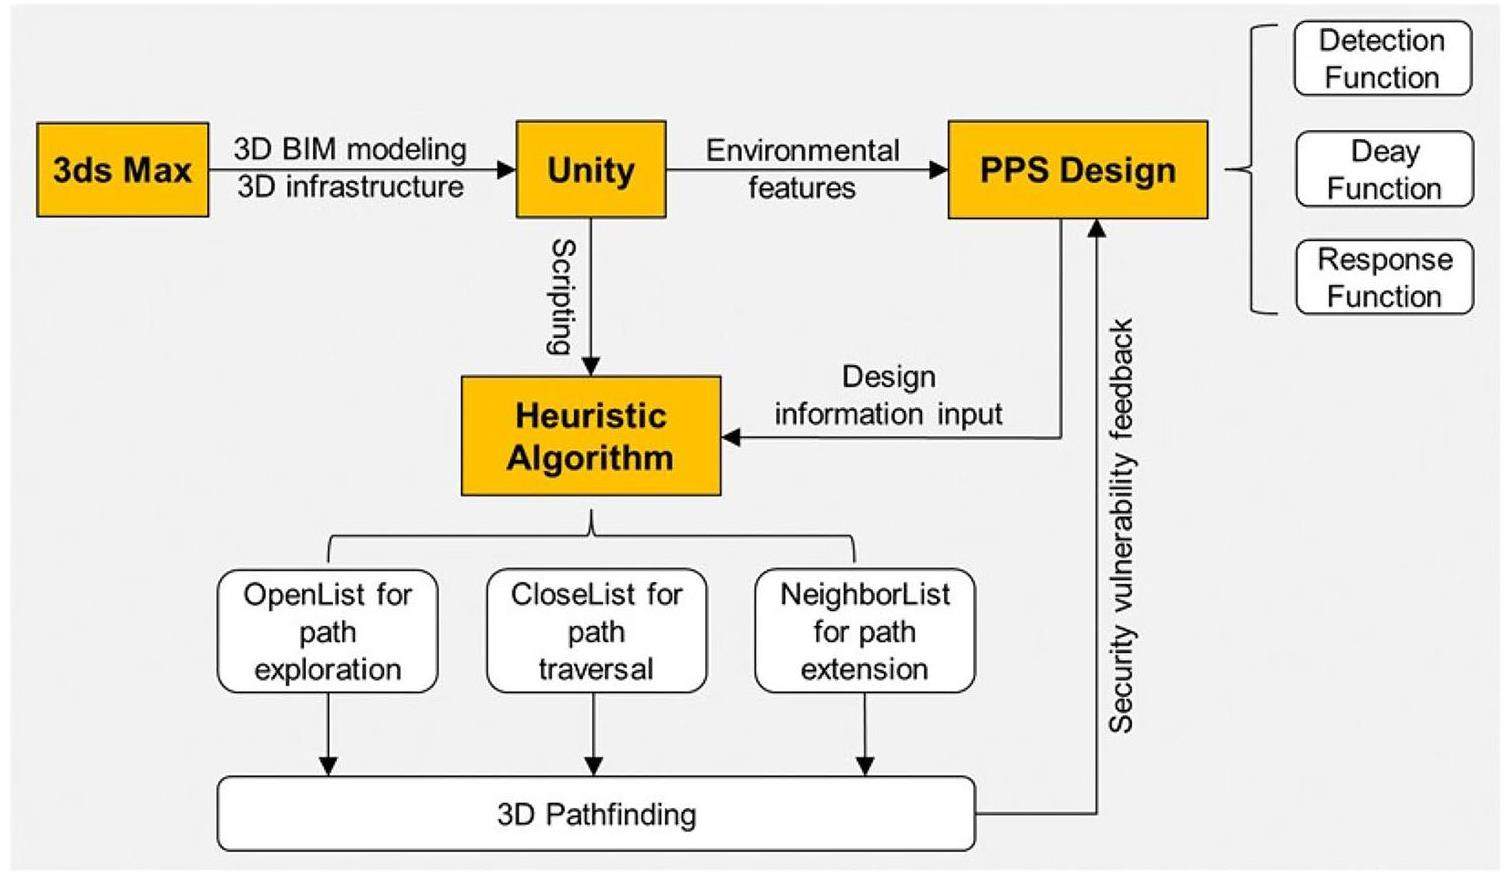
As shown in Fig. 1, an integrated framework is presented for the vulnerability analysis of PPS design in a 3D environment. The framework consists of four parts: 3ds Max, Unity, PPS design, and PPS effectiveness evaluation using a heuristic pathfinding algorithm. Structural barriers, including fences, gates, walls, doors, and the architectural arrangements of security buildings, were first designed and implemented in 3ds Max. The design of an effective PPS includes detection, delay, and response elements in layered defense-in-depth security controls for protection against adversarial attacks. Security design features are then incorporated into 3D architectural models to support the vulnerability analysis of a PPS. The most vulnerable adversarial path with the lowest PI can be determined using a heuristic pathfinding algorithm for a specific PPS in a given threat scenario. As one of the highlights of this study, the heuristic algorithm A* was implemented in a 3D environment with Unity to efficiently identify the most vulnerable path. The detection of critical path vulnerabilities in the evaluation of the PPS effectiveness provides insights into the iterative PPS design process. The functions of each module are described in detail in subsequent sections.
3ds Max/Unity
Autodesk 3ds Max [34] is a 3D content creation suite used to create 3D models for games and animation. Unity3D [35] is a real-time cross-platform initially released by Unity Technologies in 2005 with the goal of playing 2D and 3D games and interactive simulations. Unity enables users to immerse themselves in a scene using intuitive tools, such as asset tracking, rendering, and scripting. In recent years, the use of 3ds Max and Unity software for the development of 3D models and architectural visualizations in critical infrastructure protection has increased [36]. The 3D models and scenes generated in 3ds Max can be exported directly to Unity 3D to create games and interactive experiences. In PPS design, tools for skinning, texturing, rigging, and animating are used to create 3D models of the infrastructure. The detailed design of the PPS elements, including CCTV cameras, perimeter barriers, characters, etc. can also be incorporated into the 3ds Max/Unity for the iterative evaluation process.
EASI Model
With the integration of 3D models, a physical security simulation was conducted using an A* heuristic pathfinding algorithm for vulnerability assessment. The cost function used in the 3D A* heuristic pathfinding was calculated based on the EASI model to estimate the probability of interruption (PI) along the adversary path. The EASI model, developed by Sandia National Laboratories to evaluate the effectiveness of the PPS for nuclear facility security systems under threat from outsiders in the 1970s [37]. Since then, the EASI model has been widely used owing to its simplicity and ease of use [38]. The effectiveness of a physical security system was evaluated using the EASI model along a specific adversary intrusion path in a probabilistic analysis. It uses the performance measures for a PPS function that include the probability of detection (PD), probability of alarm communication to the response force, probability of deployment of the response force to the adversarys location, time to deploy the response force to the adversary's location, and time to complete the remaining adversarial attacks after detection to determine the probability of interruption (PI) as follows:
A* Heuristic Pathfinding Algorithm in 3D Environment
A* algorithm [39] is the best-first search algorithm that has been widely used for map traversal to determine the shortest path between the initial and final points. A*-algorithm searches for the most promising path through the state space using a heuristic function, where an estimate of the cost from the current state to the target is considered as informed information to guide the path search process more efficiently. Heuristic function H(n)) is given by
In terms of vulnerability analysis in the design and evaluation of a physical protection system, the probability of interruption (PI) is used as a cost function for the most optimal pathfinding. The calculation of the total cost function F(n) is divided into two parts: i) G(n), which indicates the real cost of the path from the starting point to the current point n and ii) H(n), which represents the estimated heuristic cost from the current point n to target point Ng. In most cases, A* algorithm does not know the actual distance or cost until it determines a path. The A*-algorithm is equivalent to the Dijkstra algorithm when the heuristic function A* becomes zero. As the estimated heuristic cost is the exact cost of reaching the destination node from the current node n, the lowest-cost path can be found using algorithm A* with the fastest speed [41]. However, it is generally impractical to determine an optimal heuristic function that always matches the exact cost because the paths to be searched are unknown.
In this study, an innovative algorithm A* is proposed to determine the most vulnerable adversary path in a 3D security environment. The 3D A* search algorithm was adapted from one of our previous studies [28] which was carried out to simulate physical security by visual backtracking search on a 2D-graph model of the PPS. As depicted in Fig. 2, the heuristic function

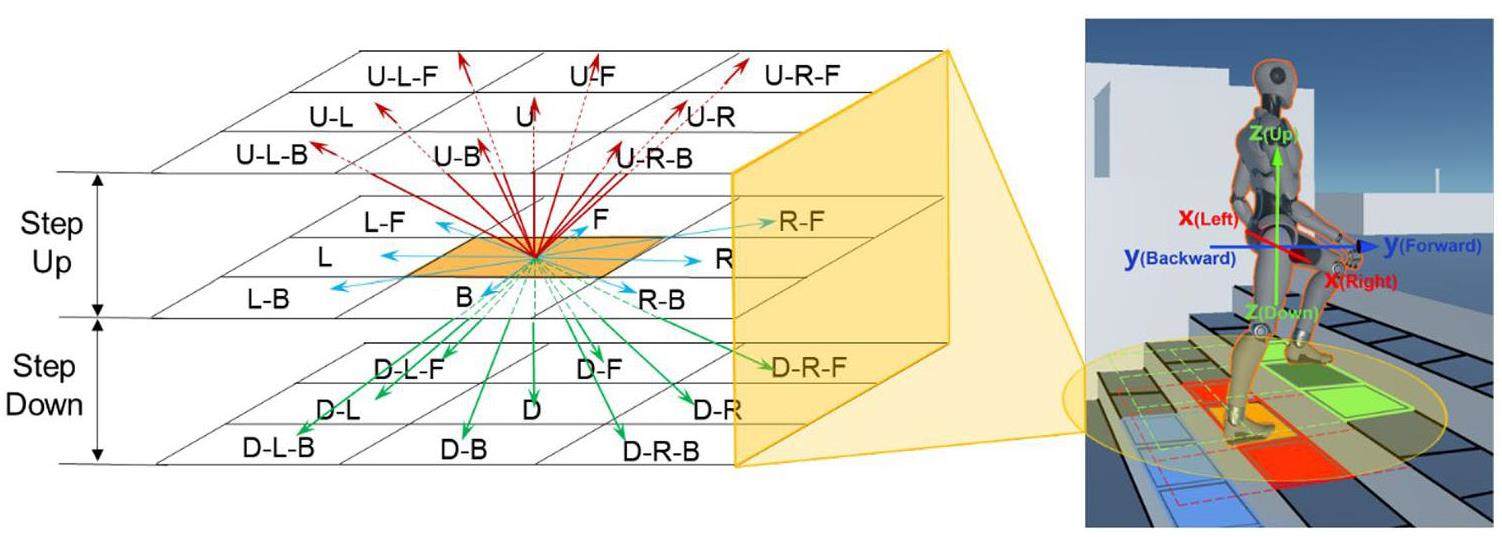
To compute the length of the shortest path in a 3D scene at a lower computational cost, we introduced waypoint navigation on the coarse grid map to compress the path representation. A waypoint is a point along a path that can be added manually or automatically to accelerate path finding [42]. Waypoints are generally designated at the must-pass entrances of adversarial pathways to construct an exact heuristic for guiding the shortest path between any pair of coarse grid locations. As illustrated in Fig. 3, the 3D space can be divided into several layers according to the number of coarse grids. For example, a pair of waypoints can be added at the corners of stairs or elevators that connect two parallel grid planes of building stories. Thus, the calculation of three-dimensional space distance can be transformed into the sum of the lengths of the pairs of waypoints across the three two-dimensional connecting planes. The final heuristic function is calculated as follows:

Following backward pathfinding, the heuristic time delay remaining after detection
3D Design of a Hypothetical Laboratory Facility
3D Modeling
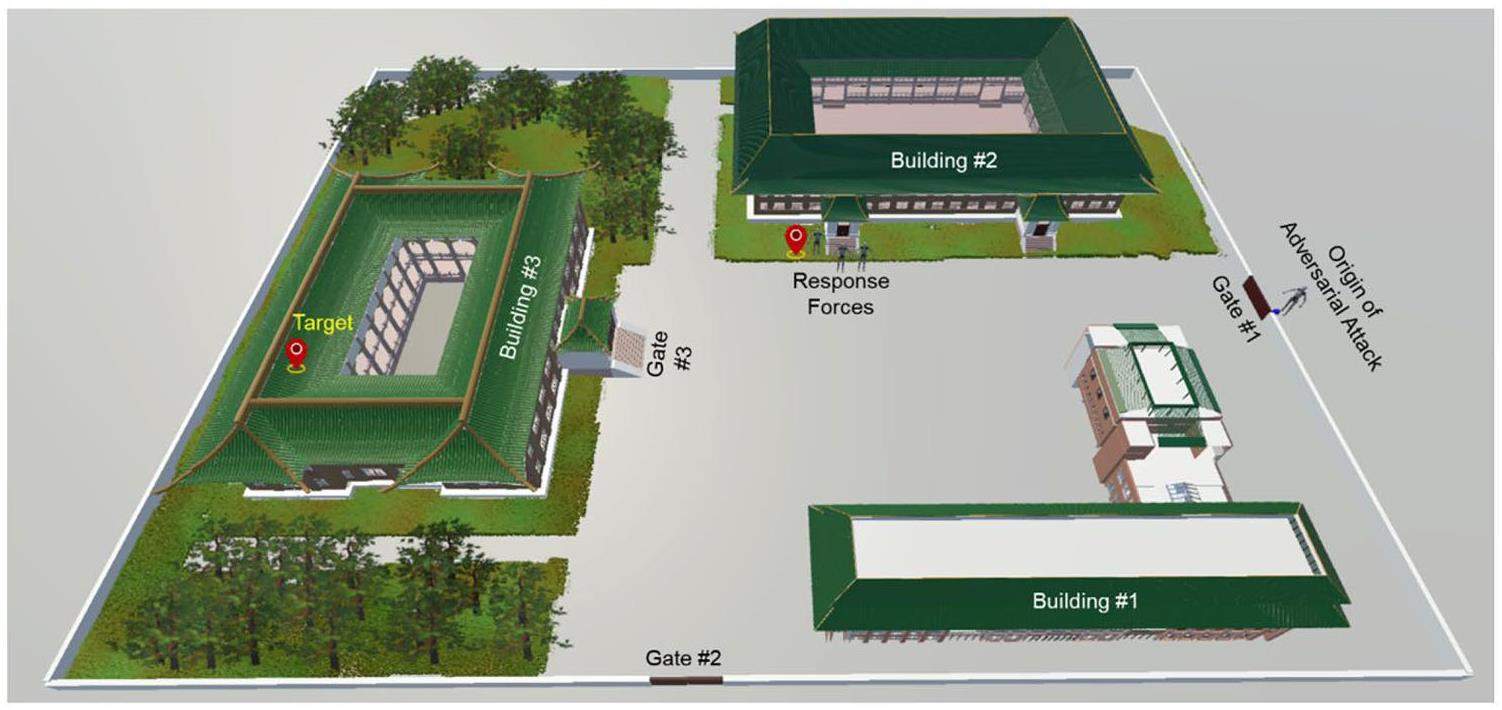
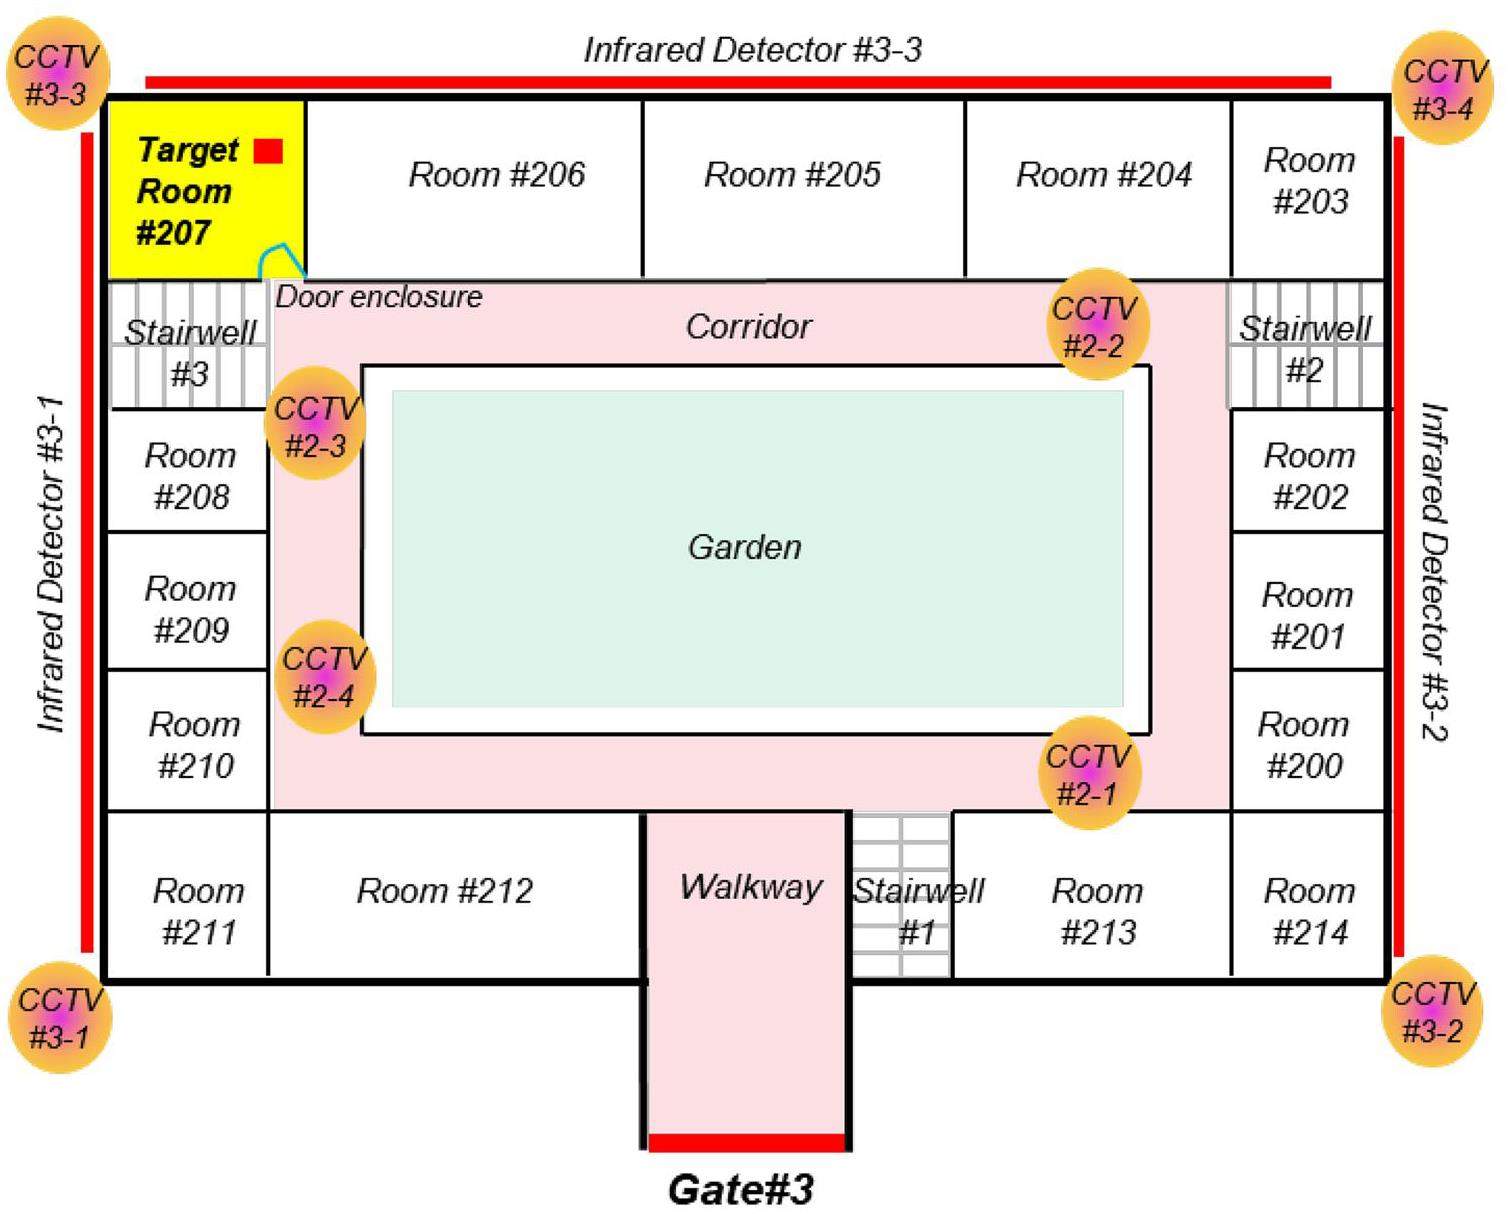
In this section, a hypothetical laboratory facility is considered as an example of a PPS for demonstration. The entire facility site was 236 m long and 183 m wide. 3D Building Information Modeling (BIM) of the hypothetical laboratory facility was implemented based on 3ds Max/Unity3D platform. As shown in Fig. 5, the laboratory site has three main buildings within the protected area, which is surrounded by a perimeter barrier. The two gates were located at the front and right sides of the laboratory facility. The asset is located in Room #207 of Building #3 and is used as the target enclosure to protect it from theft, sabotage, and other malevolent attacks. Building #3 is a two-story quadrangular courtyard building with only one entrance facing the right. The dimensions of Building #3 is 71 m × 54 m × 21 m. Figure 6 presents the 3D BIM model with both bird's eye view and head-up displays. To obtain a better display of the pathways under planning, we perceived Building #3 from multiple perspectives using 3ds Max/Unity. The interior view of the building was also presented with motion perception. The architectural style of Building #2 was similar to that of Building #3, but with two gateways. Building #1 is a modern building constructed using concrete. The outer walls of the three buildings were mounted with infrared detectors to prevent enemies from climbing walls or breaking windows.
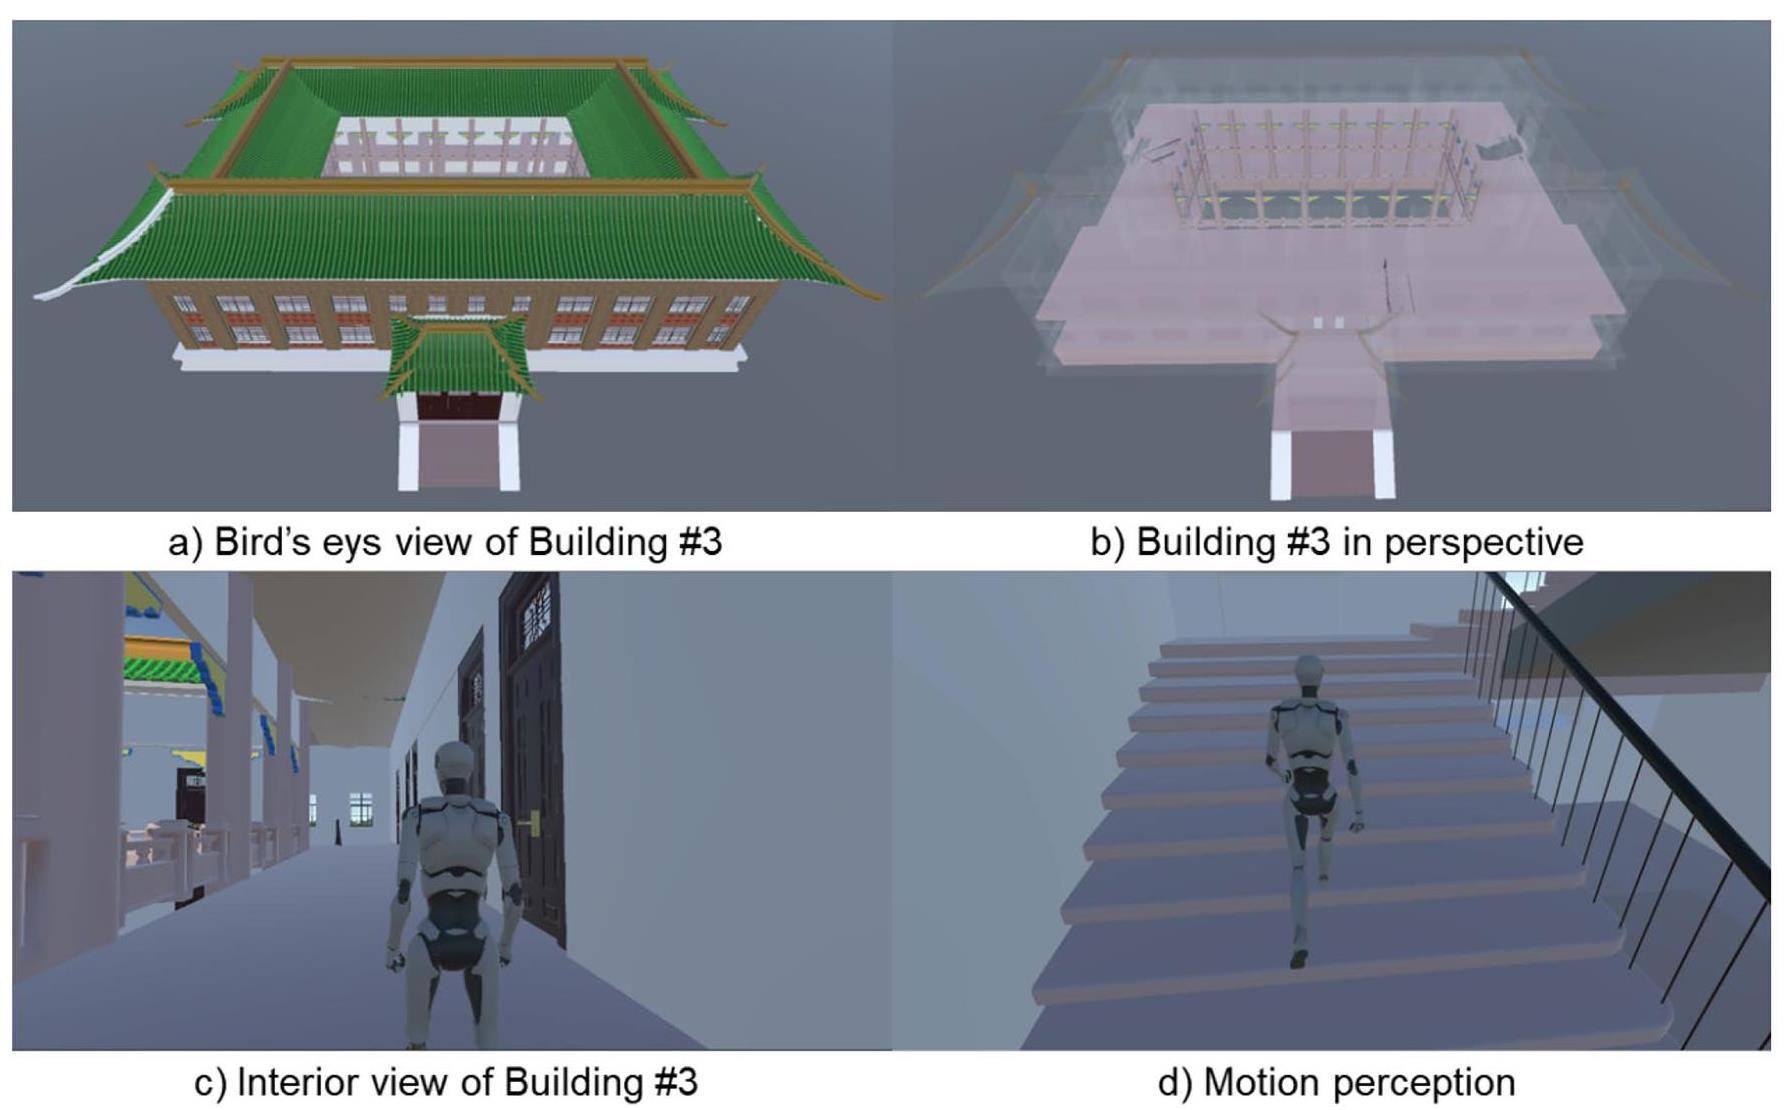
The 2D plane layout of Building #3 is shown in Fig. 7. There is a corridor and walkway that connect rows 0. f rooms on each floor. Three stairs (stairwells #1, #2, and #3) are configured in the building to connect the ground floor to the second floor. For each staircase, an omnidirectional camera (360°) was installed to monitor illegal break-ins. In addition to the video surveillance of the staircases, the internal and external aspects of Building #3 were monitored. Eight CCTV cameras were distributed in the interior corners of the building and each floor was equipped with four cameras. The interior and exterior surveillance cameras are referred to as {CCTV #2-1, CCTV #2-2, CCTV #2-3, CCTV #2-4} and {CCTV #3-1, CCTV #3-2, CCTV #3-3, CCTV #3-4}, respectively. As demonstrated in the 3D displays in Fig. 6, the agents can choose any of the three staircases on the second floor after passing through gate #3 of building #3. Apparently, the 3D models of buildings allow professionals to gain insights into a structure when starting to play animation. The room-numbering sequence on the second floor is shown in Fig. 7 to quickly locate and track the agent's position. A built-in green garden was located in the central part of Building #3. The walkways, corridors, and aisle stairs between the green garden and the rooms are marked in pink. The red lines on the periphery of the black exterior walls represent the pairwise infrared detectors. The violet-orange circles represent the omnidirectional cameras blocked by stairwells or walls.
Generation of 3D Detection Field
In this study, 3D models of the PPS elements were developed to project the detection field. Two types of detection elements were considered for the detection field projection. One is a gate access control system, such as a keycard, fab, facial recognition, or fingerprint scanner, etc. with credentials to enter. The detection probability of such sensors was approximated as a point estimate, as summarized in Table 1. Another type of detection element is the CCTV cameras mounted in the internal or external corners of buildings. The detection zone of the CCTV camera is shown in Fig. 8b. The detection space of the CCTV camera has a conical search light shape. The probability distribution of the camera's projected region on the ground was approximated by a linear decay function defined in the following Eq. (15):
| PPS elements | Detection probability (PD) | Time delay (TTD) |
|---|---|---|
| Gate #1 | 0.5 | 2s |
| Gate #2 | 0.5 | 2s |
| Gate #3 | 0.8 | 15s |
| Door enclosure | 0.9 | 10s |

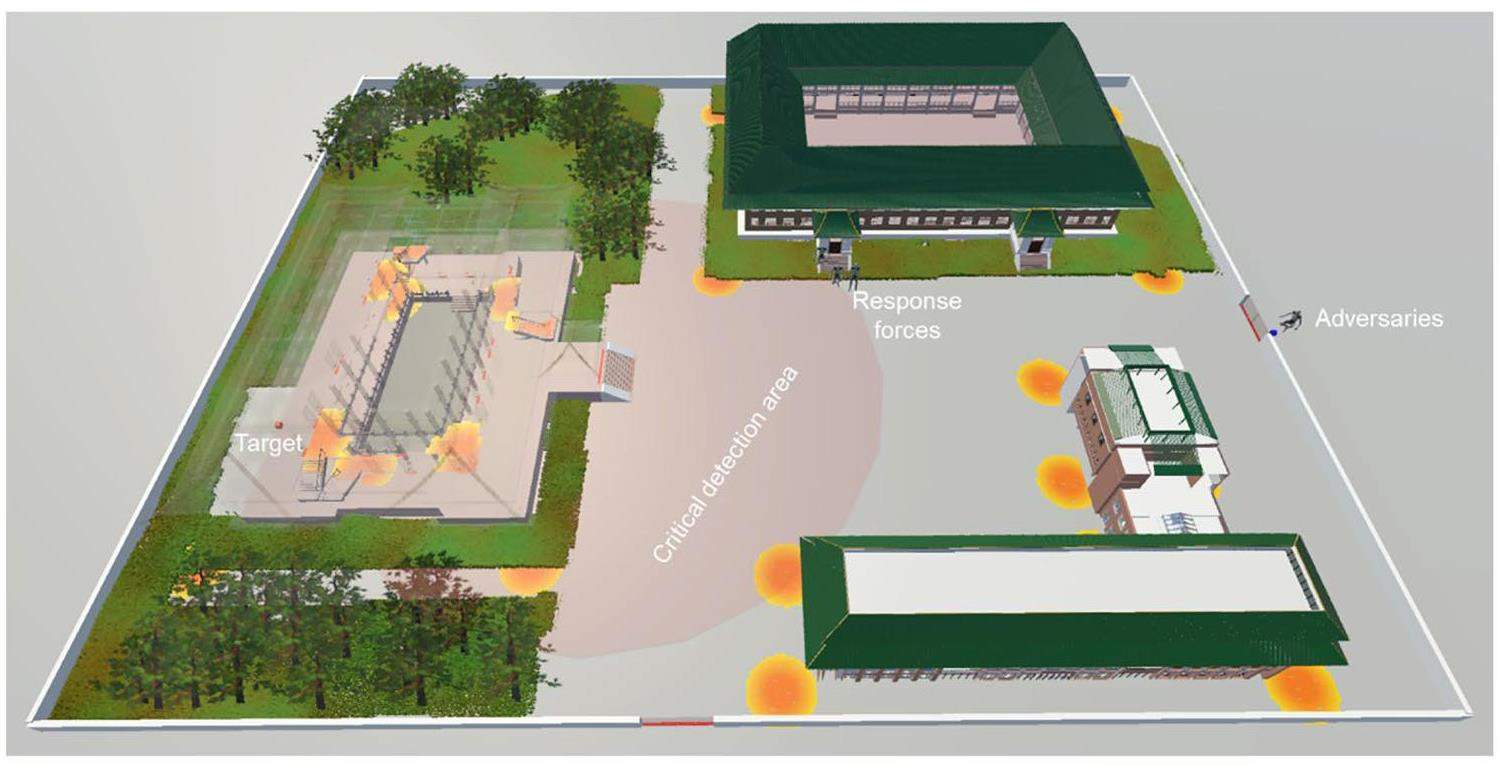
The entire detection field generated for a hypothetical laboratory facility is illustrated in Fig. 9. The detection field is presented in the form of thermography, in which the sensitive detection area is marked with a highlighted foreground color display. The pixel colors of the detection circles gradually decayed to pale yellow and even to a gray background, which represented the non-detection areas. In addition, the critical detection area (TR<RFT) is highlighted with a light pink background on the map to provide insight into the potential vulnerabilities. The internal structures of buildings #1 and #2 are not shown here because of the lower security risk levels identified for evaluating the effectiveness of the PPS.
Vulnerability Analysis of the Hypothetical Laboratory Facility
In this section, the 3D A* heuristic pathfinding algorithm is implemented for vulnerability analysis of the hypothetical laboratory facility. To verify and highlight the high efficiency of the proposed 3D A* heuristic search algorithm, a comparison between the A* and Dijkstra algorithms was performed to identify the most vulnerable path. The scene settings are described in Sect. 4.1. Comparisons between the 3D A*-heuristic pathfinding algorithm and the non-heuristic Dijkstra algorithm in the assessment of security vulnerabilities are presented in Sect. 4.2.
Scene Setting for the Case Demonstration
As pinpointed in Fig. 7, the protected target is located in Room #207 of Building #3. The adversaries are assumed to start their attacks on the right side of the laboratory site. The surveillance monitoring system and response forces are located in the left corner of Building #2. The response forces must reach the target room prior to the arrival of the enemies to interrupt them once an alarm is triggered. Therefore, the shortest path was chosen based on the response forces to reach the target at the highest speed. A relatively small PPS response time (TRFT=61 s) was obtained by traveling along the shortest path to the target enclosure and considering a good training exercise for the response forces. An adversary attack is conducted under the following assumptions:
• Obstacles such as walls, perimeter fences, etc. are impenetrable. That is, enemies do not have the ability to destroy objects.
• Any open space on the ground is accessible. The enemies can move freely in the open areas.
• The step length is set to ξ=0.3m by taking into account the optimal height of a staircase step.
• The detection probability (PD) and time delays (TTD) defined for the various PPS elements including the outer gate point (Gate #1, Gate #2), building interior gate (Gate #3), and room doors are summarized in Table 1.
• The average speed of enemies and response forces are assumed to be VA=3 m/s and VRF=2.5 m/s for TTR and TRFT values calculation.
• An adversarial attack will be successfully interrupted by the response forces as long as the response forces get into the target enclosure before the enemies do.
Optimal Pathfinding Using 3D A* Heuristic Algorithm and Dijkstra Algorithm
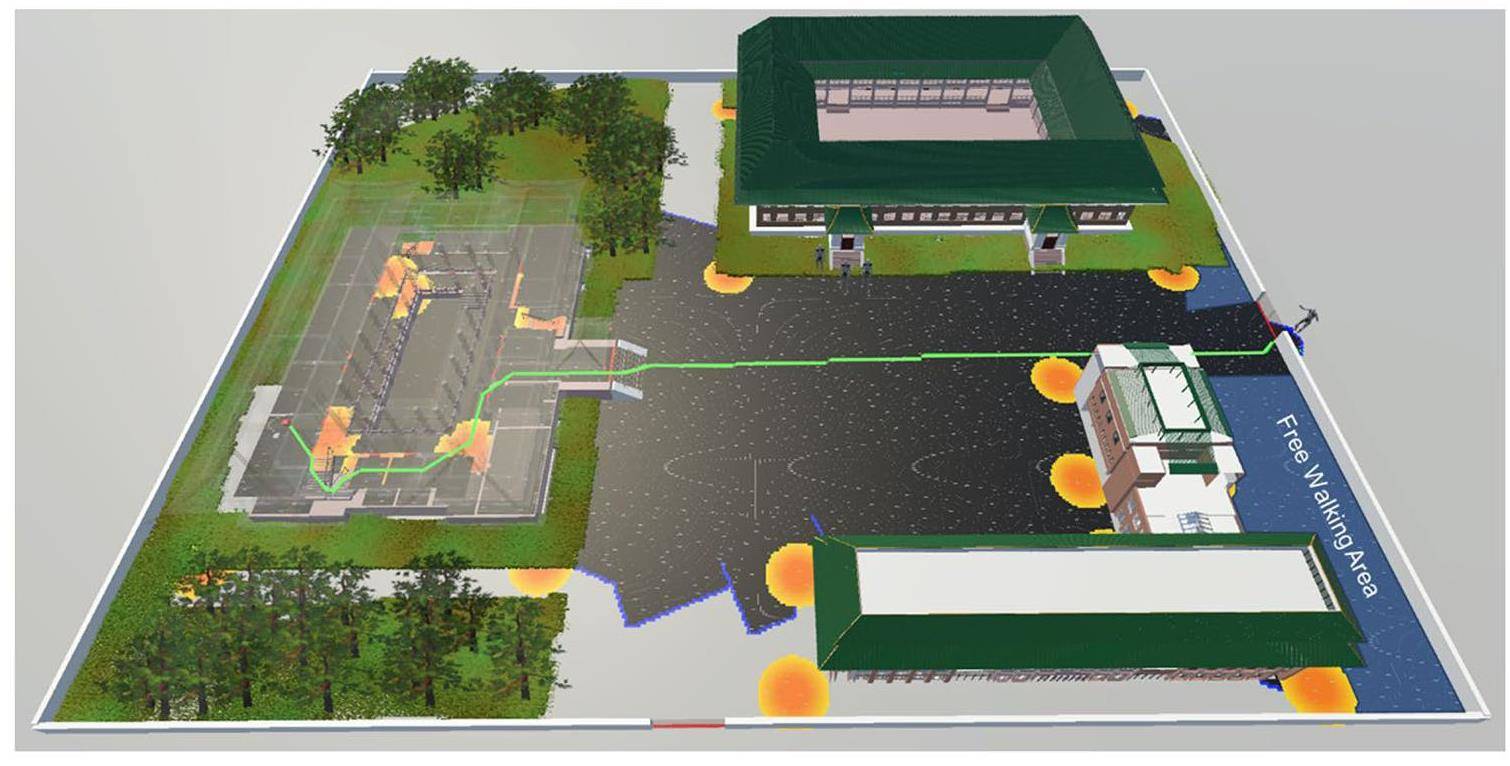
Based on the model assumptions and model parameter inputs, the vulnerability of the heuristic pathfinding solution can be obtained using 3D A*-algorithm. The most vulnerable adversary path identified using the measure PI in the 3D A* heuristic search is shown in Fig. 10.
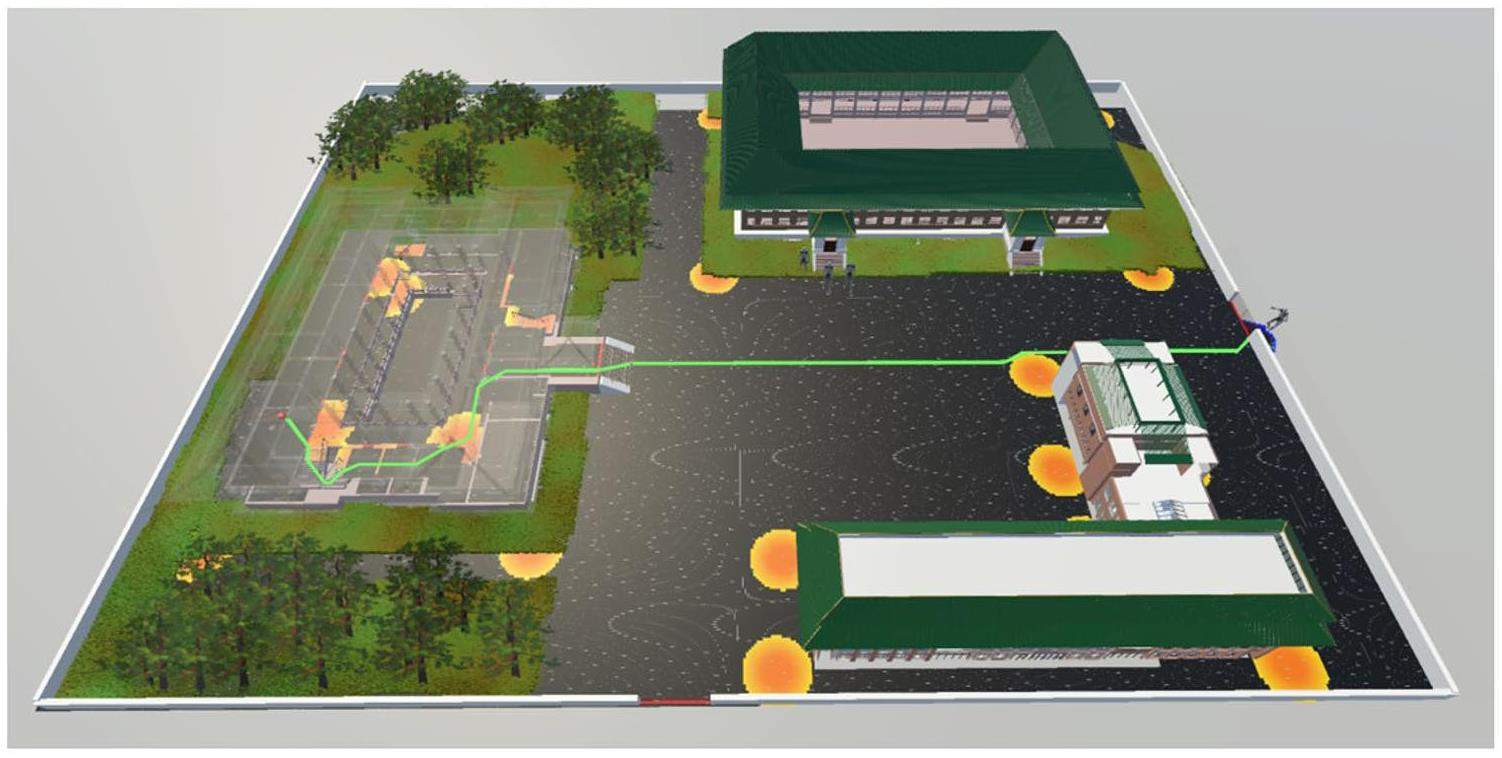
The search results were also compared with those of the Dijkstra algorithm, as summarized in Table 2. The complexity of the proposed heuristic scheme was estimated by counting the number of nodes traversed by the algorithm and the elapsed time required to complete the optimal path. Figure 11 shows the shortest path with the lowest PI obtained by the Dijkstra algorithm. To provide a clearer path display, we made the building transparent except for the skeleton frame. In Unity3D environment, users can also follow the character model for path exploration in the animation mode. Thus, the most desirable benefits of 3D modeling and animation can be discovered in PPS design and simulations.
| Method | PI | TR | Path nodes in CloseList | Nodes traversed in OpenList | Nodes to be searched | Elapsed time (ms) | |
|---|---|---|---|---|---|---|---|
| Dijkstra algorithm | 0.466414838754809 | 111.91 | 0.145123303533361 | 466 | 134298 | 947 | 2299362 |
| A* algorithm | 0.466414838754809 | 111.91 | 0.145123303533361 | 466 | 82186 | 1148 | 752663 |
This shows that a huge number of 134,298 cell nodes are traversed by the Dijkstra algorithm for the most vulnerable path identification, with an elapsed time of 2,299,362 ms. In contrast, the search efficiency was significantly improved by proposed algorithm A*. Saving more than two-thirds of the computation time when applying algorithm A* for optimal pathfinding in a hypothetical scene with the magnitude of discrete cell nodes Ntotal= 145,521. The most vulnerable adversarial paths identified by the Dijkstra and A* algorithms have the same measures of PI=0.466414838754809, TR=111.91 s, and cumulative detection probability
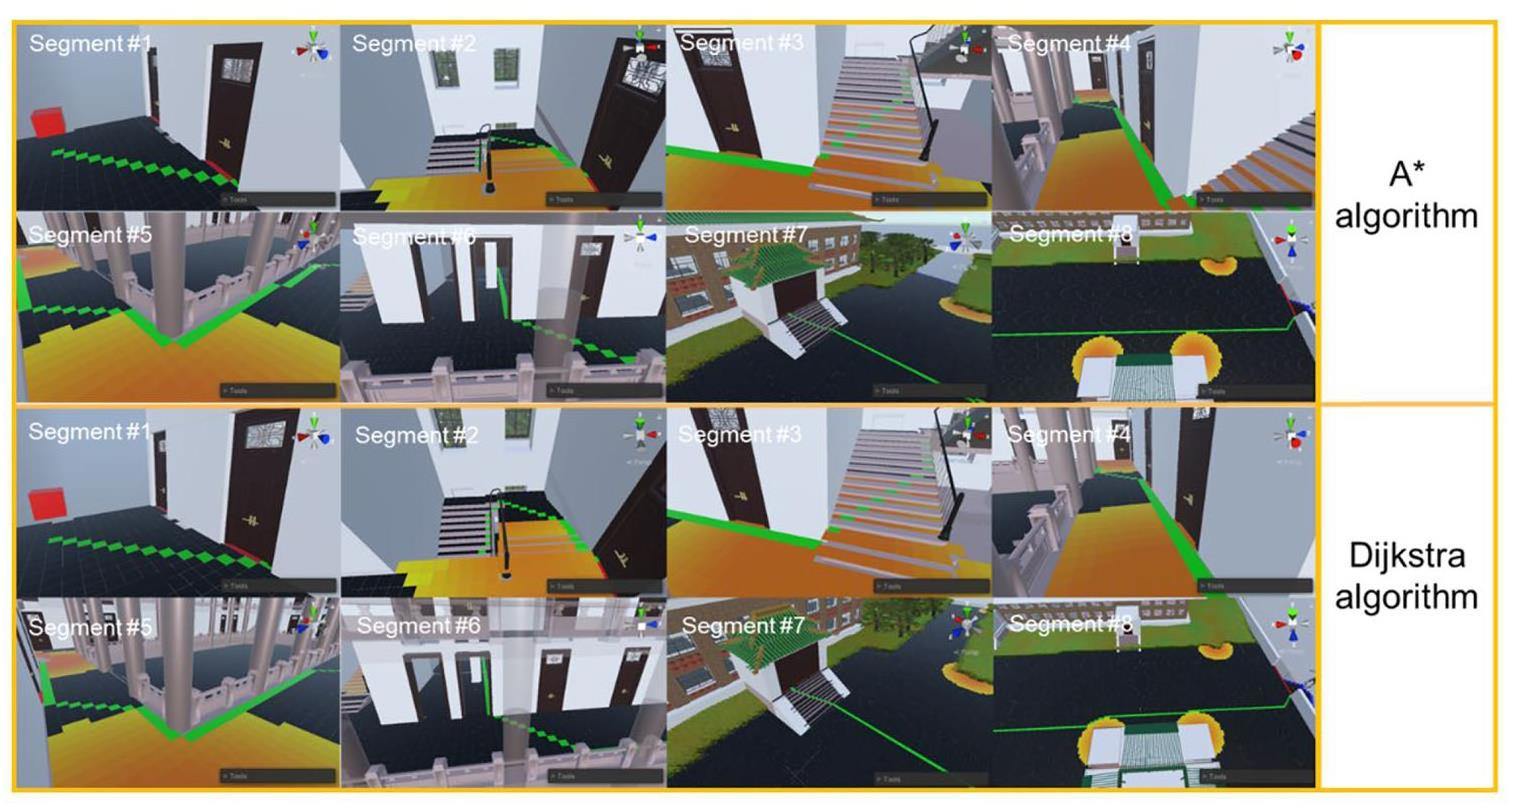
From the bird-seye view shown in Fig. 10 and Fig. 11, we can see that the adversaries take the same path to the target. Starting from the initial point on the right side of the laboratory site, the adversaries enter the facility through gate #1 and then choose the shortest path to bypass the detection fields around buildings #1 and #2. As adversaries approach Building #3, their movements are monitored by a series of CCTV cameras, in which the searchlight covers most of the floor area. Therefore, adversaries tend to be more cautious in selecting their path directions to quickly approach the target without being detected by surveillance monitoring systems. Screenshots of the hidden routes inside Building # 3 are shown in Fig. 12. Figure 12 also presents the visual comparisons with different segments of the path between the Dijkstra algorithm and the A* algorithm for the full validation of the path. The path varies slightly only in the nondetection areas (PD=0), but the cost function PI is not affected by the identification of the optimal global path.
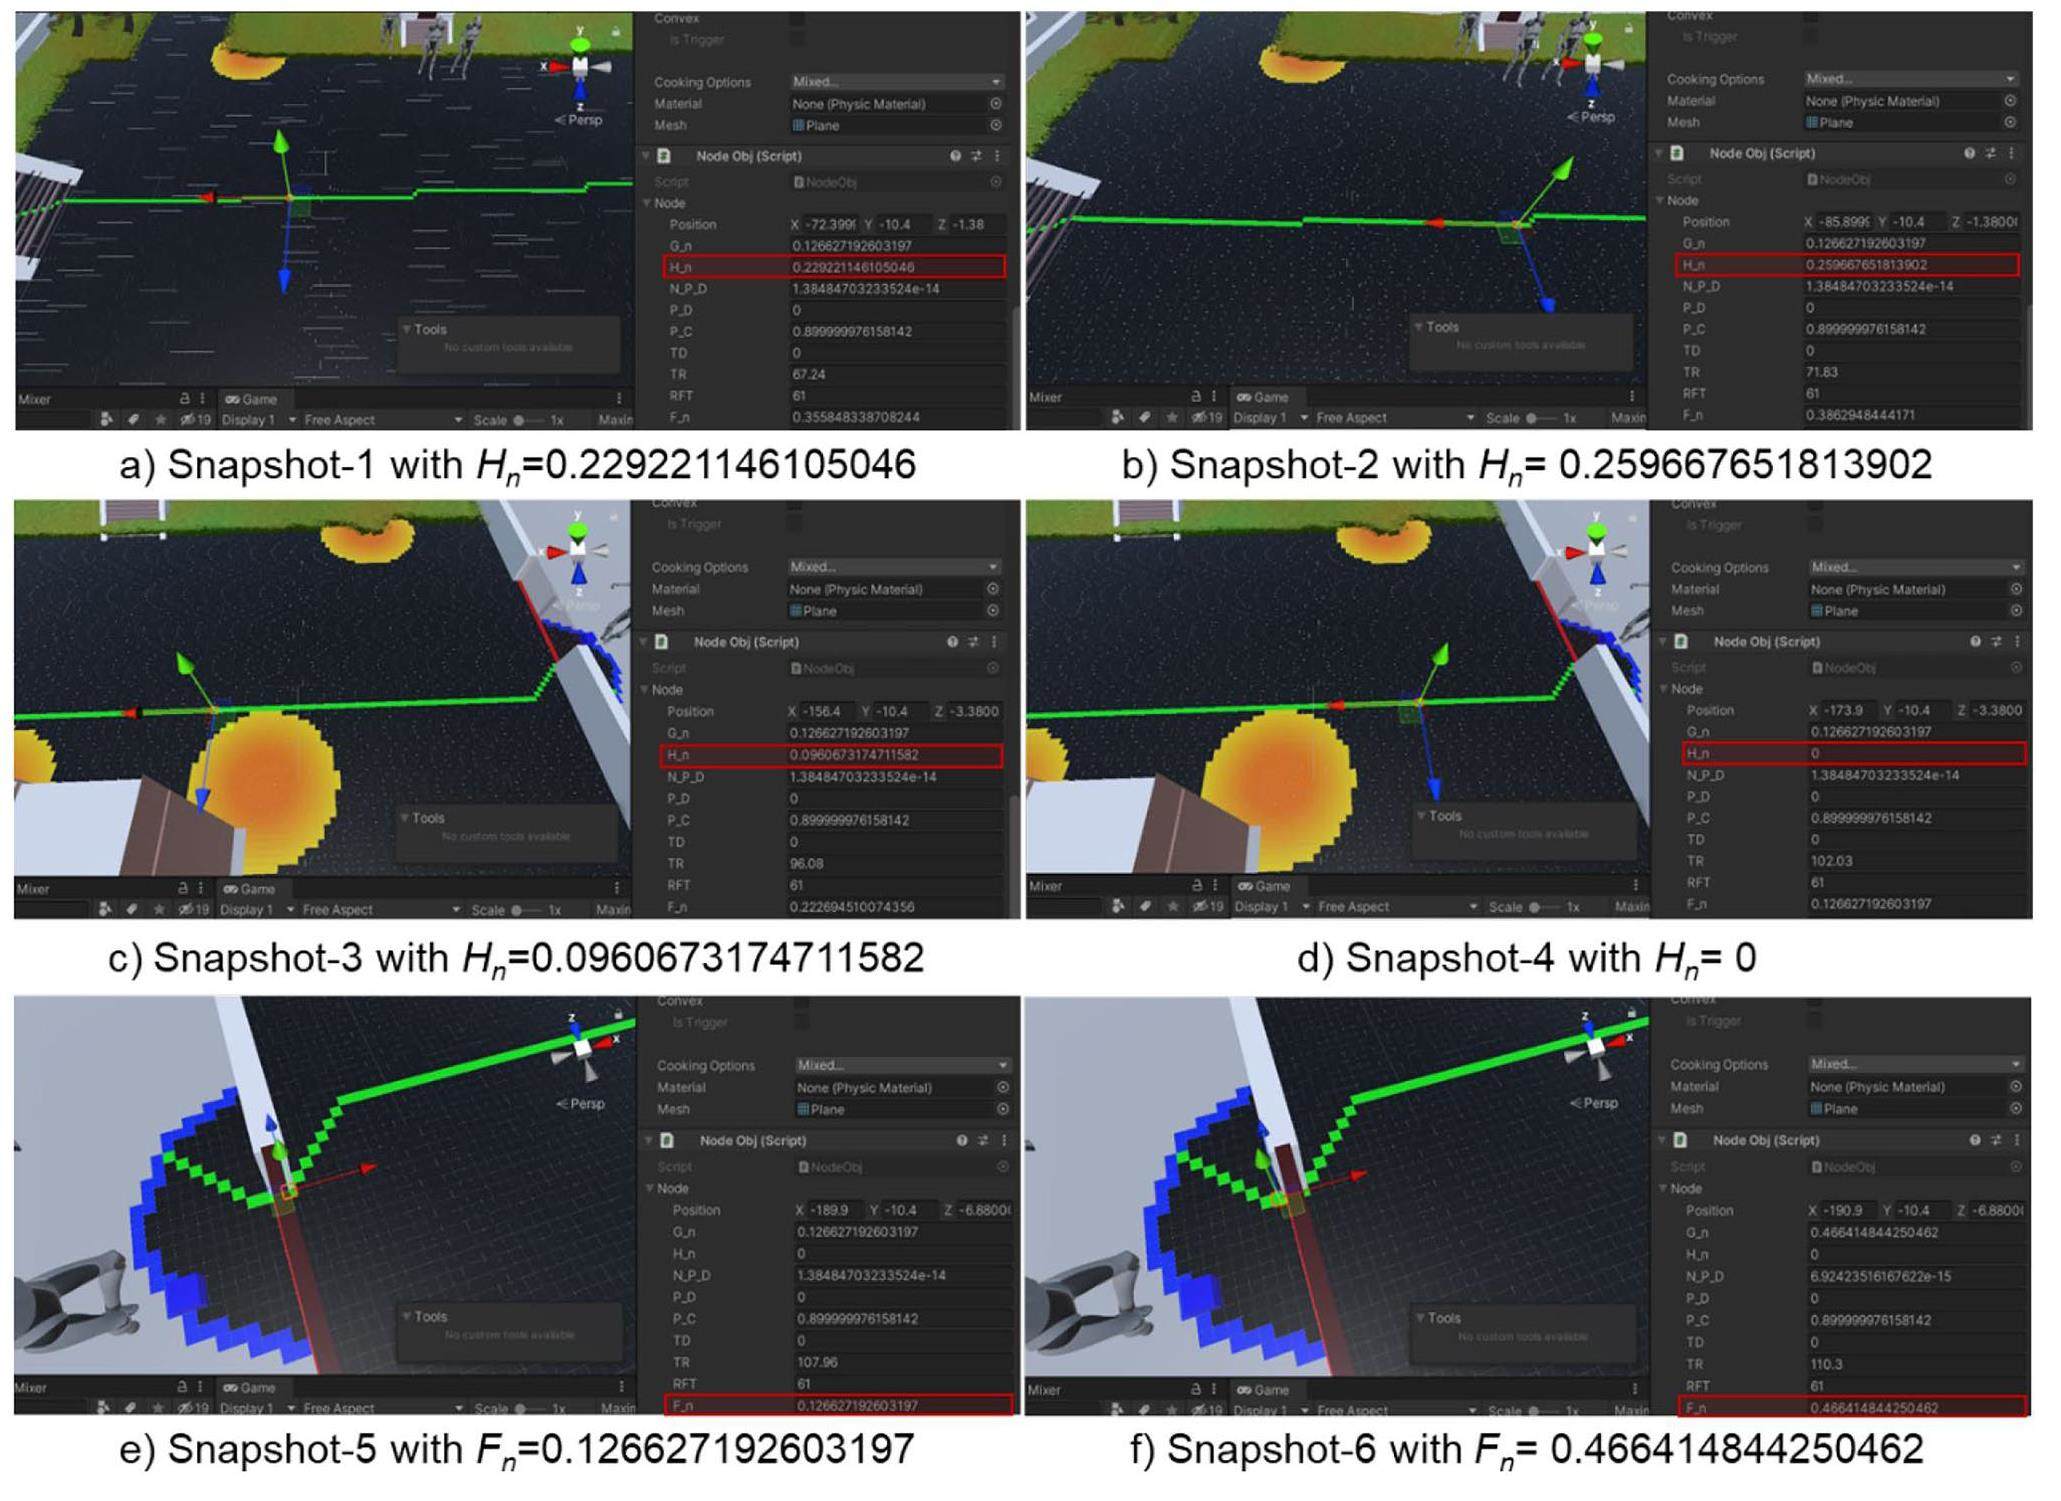
During the heuristic search analysis, the cost values, including [G(n), H(n), F(n)], were also reviewed for cross-validation of the optimal paths. As compared in Fig. 13, the heuristic cost H(n) shows a monotone decreasing change as we advance the path towards the origin of adversarial attack. However, it also exhibits local volatility in path guidance when the simultaneous contrast effects of the combined detection and delay functions are considered for the heuristic estimation of H(n). In other words, the simultaneous contrast effects resulting from the decreased cumulative probability of detection and increased probability of adversarial interruption (P(R|A)) can lead to unnecessary searches for local path optimization. Theoretically, the estimated cost H(n) will continue to decrease until zero because fewer detection grids need to be computed for the short-distance heuristic when the point moves close to the target. However, the monotonic increase in TR and P(R|A) has a countereffect on the heuristic estimates in backward pathfinding. There may even be a slight increase in the estimated value of H(n) during the path planning. This surprising phenomenon is highlighted in Fig. 13(a) and (b). Surprisingly, a sudden jump in the overall cost estimation F(n) resulting from a significant increase in the time delay at a detection point can be observed for a critical path element such as Gate #1. Gate #1 served as the main entrance to a limited area of the hypothetical laboratory facility. Because the delay elements in the open areas are not considered in the heuristic estimation, a sudden increase in the time delay caused by gate #1 immediately creates an obvious shoot-up in the overall cost estimation F(n) when compared to its neighboring nodes inside the boundary fence of the hypothetical laboratory facility. Gate nodes with relatively large values for the overall cost estimate F(n) are pushed down on OpenList. In such cases, the algorithm must prioritize the search in the free-walking area (Fig. 10 where the neighboring nodes are in fact fantastic with lower value of F(n), but not the optimal path extended to the off-site source node. This also leads to many unnecessary searches and the wastage of computational resources.
Discussions
Physical security modeling and vulnerability assessment are critical components of the integrated design and evaluation of a PPS. The heuristic pathfinding algorithm can provide a systematic and thorough method for traversing all possible adversarial paths in a 2D or 3D modeling environment. However, the search space becomes enormous as the refined mesh is applied for discretizing of security areas of large complex facilities. A big challenge is posed for computationally efficient searches with extremely large path spaces, especially when the timeliness of the immediate feedback of adversarial attacks is necessary to determine effective response measures at the site. It highlights several issues that require elegant elaboration with heuristic innovations to fit rapidly changing real-world scenes.
• Heuristic innovations for real-time dynamic pathfinding. Ideally, a heuristic function H(n) should provide an accurate estimate of the cost, guiding the search in the right direction at high efficiency. However, it is usually difficult and sometimes even impractical to find an optimal solution due to the unknown true cost that accompany the development of uncertain adversarial paths. In the study, we provide a novel heuristic estimation scheme to refine the detection and distance fields, providing a better estimate of the cost to reach the goal. A geometric probability model is also introduced to estimate the likelihood of intrusion detection by alarm system. The number of detection opportunities in approximated by the ratio of cell nodes distributed in the detection fields to the total number of cell nodes discretized for the entire scene. Here, the minimum probability of detection (
• Configuration of waypoints for search performance improvement. The optimal pathfinding in 3D environment poses a big challenge problem especially when facing the large-scale infrastructure facility security applications [43]. Compared to two-dimensional A* heuristic pathfinding, the moving directions are increased from 8 to 26 considering the three pairs of orthogonal axes. The rapid explosion of search space contributed to low search efficiency in a difficult search even with heuristic information. A waypoint is an intermediate point along the path to the goal, which can be used to make the routefinding faster. A waypoint is created and placed along the route through Gate #3, where adversarial travel is required in the study. The waypoint serves as the role to change the course, but also to guide the shortest path to the goal for distance heuristic estimation. It should also be noted that the incorporation of waypoints can lead to suboptimal paths, although a highway shortcut link can be constructed.
• Flexible meshing scheme for path smoothing and quality enhancement. Though A* heuristic search is mostly being used on the grid map representation, it can make a huge difference in the search performance and path quality. Additionally, the most common square grids adopted for the discretization of security areas do not fit all types of landform in a facility [44]. The study illustrates the A* heuristic search on a regular quadrilateral grid map as a good starting point for the guided tour of adversarial path planning. In our future studies, we will investigate a flexible meshing scheme to enable more sophisticated terrain modeling, enhancing path performance and quality.
Conclusion
In this study, a heuristic waypoint navigation algorithm was proposed, supplemented by a geometric probability model, to enhance the efficiency and effectiveness of path planning for adversary vulnerability assessment in a 3D environment. The 3D A*-heuristic search was demonstrated using a hypothetical laboratory facility, where 3D building models were developed on the 3ds Max/Unity platform. A 3D detection field with a critical detection point line was also highlighted to facilitate the security vulnerability assessment. A comparative study was conducted between the A* heuristic and Dijkstra search on the grid map representation of the facility for path traversal and performance analysis. The shortest path through the outside gate #1 and the designated waypoints to the target on the second floor were identified with the lowest PI=0.466414838754809. The search efficiency of A* is improved by almost two-thirds of the computation time compared with the full search of Dijkstra for the optimal solution. The proposed A* pathfinding algorithm is computationally efficient in assessing 3D security vulnerabilities.
Modeling and simulation as tools to increase the protection of critical infrastructure and the sustainability of the provision of essential needs of citizens
. Sustainability 13, 5898 (2021). https://doi.org/10.3390/su13115898Model-based development of design basis threat for physical protection systems
.Development of multipath adversary analysis tool for vulnerability assessment of physical protection system (MAVA)
. Journal of Engineering and Scientific Research. 3, 2 (2021). https://doi.org/10.23960/jesr.v3i2.92A heuristic approach to evaluate the effectiveness of the physical protection system
. Ann. Nucl. Energy. 105, 302-310 (2017). https://doi.org/10.1016/j.anucene.2017.03.029A study on utilization plans for already constructed BIM data for physical protection simulation
. International Journal of Engineering Science Invention. 7, 58-62 (2018).MetThe EASI approach to physical security evaluation. SAND Report 760500
, 1977.MAPPS: A stochastic computational tool for multipath analysis of physical protection systems
. Ann. Nucl. Energy. 137,Development of multipath adversary analysis tool for vulnerability assessment of physical protection systems (MAVA)
. Journal of Engineering and Scientific Research. 3, 2 (2021). https://doi.org/10.23960/jesr.v3i2.92Development of an EASI-based multipath analysis code for nuclear security systems with extension of variability
. Nucl. Eng. Technol. 54, 3604-3613 (2022). https://doi.org/10.1016/j.net.2022.05.023Development of a vulnerability assessment code for a physical protection system: systematic analysis of physical protection effectiveness (SAPE)
. Nucl. Eng. Technol. 41, 747-752 (2009). https://doi.org/10.5516/NET.2009.41.5.747Evaluation of the vulnerable path: Using a heuristic pathfinding algorithm in the physical protection system of a nuclear power plant
. Int. J. Crit. Infrastruct. Prot. 23, 90-99 (2018). https://doi.org/10.1016/j.ijcip.2018.08.006A heuristic approach to evaluate the effectiveness of the physical protection system
. Ann. Nucl. Energy. 105, 302-310 (2017). https://doi.org/10.1016/j.anucene.2017.03.029Vulnerability Learning of adversary paths in Physical Protection Systems using AMC/EASI
. Prog. Nucl. Energy. 134,Development of a structure-analytic hierarchy approach for the evaluation of the effectiveness of the physical protection system
. Nucl. Eng. Technol. 52, 1661-1668 (2020). https://doi.org/10.1016/j.net.2020.01.033Controlling of local search methods' parameters in memetic algorithms using the principles of simulated annealing
. Procedia Engineering. 136, 70-76 (2016). https://doi.org/10.1016/j.proeng.2016.01.176A heuristic approach based on the 2D graph model to visual backtracking security vulnerabilities in physical protection systems
. Int. J. Crit. Infrastruct. Prot. 28,Evaluation of Physical Protection Systems Using an Integrated Platform for Analysis and Design
. IEEE Trans. Syst. Man Cybern.-Syst. 47, 2945-2955 (2017). https://doi.org/10.1109/TSMC.2016.2531995Using 3D model and simulation to support the force-on-force test of the physical protection system
. IEEE Access. 9, 63833-63840 (2021). https://doi.org/10.1109/ACCESS.2021.3074942Computing physical security system effectiveness at commercial reactors
. Nucl. Sci. Eng. 197, S13-S23 (2023). https://doi.org/10.1080/00295639.2022.2120315Development of a leading simulator/transport simulator methodology as part of an integrated safety-security analysis for nuclear power plants
. Proc. Inst. Mech. Eng. Part OJ. Risk Reliab, (2022). https://doi.org/10.1177/1748006X221091048Energy efficient selective hybrid beamforming for satellite-terrestrial integrated networks
. IEEE Transactions on Communications. 69, 6345-6360 (2021). https://doi.org/10.1109/TCOMM.2021.3088898energy-efficient secure beamforming based on SLNR in multibeam satellite systems
. IEEE Transactions on Aerospace and Electronic Systems. 59, 2085-2088 (2023). https://doi.org/10.1109/TAES.2022.3190238Damage without gain: destructive beam formation from a malicious RIS perspective in IoT networks
. IEEE Internet of Things Journal. 11, 7619-7629 (2024). https://doi.org/10.1109/JIOT.2023.3316830Safe and energy efficient transmission for RSMA-based cognitive satellite-terrestrial networks
. IEEE Wireless Communications Letters. 10, 251-255 (2021). https://doi.org/10.1109/LWC.2020.3026700Using virtual reality to support the physical security of nuclear facilities
. Prog. Nucl. Energy. 78, 19-24 (2015). https://doi.org/10.1016/j.pnucene.2014.07.004Unity game development engine: a technical survey
. Univ. Sindh J. Inf. Commun. Technol. 4, 73-81 (2020).Physical protection evaluation process for nuclear facility via sabotage scenarios
. Alex. Eng. J. 57, 831-839 (2018). https://doi.org/10.1016/j.aej.2017.01.045On the complexity of admissible search algorithms
. Artif. Intell. 8, 1-13 (1977). https://doi.org/10.1016/0004-3702(77)90002-9Greedy, A-Star, and Dijkstra's algorithms to find the shortest path
. International Journal of Advances in Data and Information Systems. 2, 45-52 (2021). https://doi.org/10.25008/ijadis.v2i1.1206A novel waypoint guidance and adaptive evolution strategy for 3D route planning of unmanned aerial vehicles
. Journal of the Franklin Institute. 360, 9602-9636 (2023). https://doi.org/10.1016/j.jfranklin.2023.07..002Path planning in complex 3D environments using a probabilistic roadmap method
. International Journal of Automation and Computing. 10, 525-533 (2013). https://doi.org/10.1007/s11633-013-0750-9Modeling and simulation as tools to Increase the protection of critical infrastructure and the sustainability of the provision of essential needs of citizens
. Sustainability. 13, 5898 (2021). https://doi.org/10.3390/SU13115898The authors declare that they have no competing interests.

