Introduction
Dose calculation remains a significant numerical challenge in radiation applications [1-3], particularly in particle radiotherapy, which is an interesting research area, including proton and ion radiotherapy [4-6], involving devices [7-10], dose algorithm [11, 12], scanning modes [13], etc. Accurate dose algorithms are essential for maximizing the effectiveness of proton radiotherapy by leveraging the unique Bragg-peak characteristics of this approach [14]. Several dose algorithms have been proposed for proton radiotherapy, including the pencil beam algorithm [15-17], track-repeating methods [18, 19], the Boltzmann transport equation solver [20, 21], and full MC simulations [22, 23]. Although the pencil beam algorithm is widely used in clinical settings, there is an urgent need to improve its accuracy. The MC technique offers the highest accuracy, but it is hampered by prolonged computation times. Thus, the primary goal of proton dose calculation is to ensure both the precision and efficiency of the algorithm simultaneously.
In recent years, the integration of graphics processing units (GPUs) into photon dose algorithms has led to significant advancements, providing practical solutions through the implementation of various balancing strategies [24-28]. Similarly, GPU-based MC methods have shown promising results for proton radiation transport [29-33].
According to data from ICRU Report 46 [34], the weight ratio of hydrogen (H) atoms to the combined weight of nitrogen (N), carbon (C), and oxygen (O) atoms in human tissues is believed to mirror the proportion of H atoms to O atoms in water. Furthermore, as outlined in ICRU Report 63 [35], these atoms are arranged in the same order when adjusting the nuclear reaction cross-sections of C, N, and O atoms to their atomic masses. This alignment enables human tissues to behave similarly to water during nuclear reactions. Consequently, many proton programs assume that human tissues mimic the behavior of water, focusing primarily on proton interactions with H and O atoms in the nuclear reaction model [29, 36, 32].
In contrast, according to ICRP publication 70 [37], the skeleton comprises approximately 20% of the average total body weight, excluding adipose tissue, with 5% to 20% of the skeleton being composed of calcium (Ca) and a small amount of phosphorus (P). The nuclear interaction cross-sections of these atoms are approximately 25% lower than that of oxygen (O) [38]. Consequently, substituting water for the elements present in the human body during dose calculations may lead to specific discrepancies. Additionally, atoms of elements such as sodium (Na), magnesium (Mg), phosphorus (P), sulfur (S), chloride (Cl), potassium (K), iron (Fe), and iodine (I) exhibit notable differences from O atoms. However, to date, only a few programs have developed extensive nuclear reaction models that consider interactions between protons and other constituent elements of human tissues [31].
Both types of programs have shown promising results and efficiency through their distinct strategies. Nevertheless, there is a dearth of quantitative research investigating the impact of the refinement level in nuclear reactions on dose calculations for human tissues. Given that increased refinement in nuclear reactions increases algorithmic effort and redundancy, comprehensive research into this topic is warranted.
This study aimed to develop an advanced proton transport program named gMCAP that utilizes a GPU. The code incorporates precise discrete interactions and refined nuclear reaction models. The initial implementation of gMCAP refined electromagnetic interactions using approaches such as the energy loss method and multiple scattering model. Subsequently, two nuclear reaction models were developed: simplified (APPROX) and refined (REFINED). The APPROX model considers proton interactions with water of varying densities, encompassing p-H elastic nuclear reactions, p-O elastic nuclear reactions, and p-O inelastic nuclear reactions. In contrast, the REFINED model accounts for interactions between protons and specific elements present in human tissues, including H, C, N, O, Na, Mg, P, S, Cl, K, Ca, Fe, and I atoms. Finally, the entire program was ported to the CUDA platform to leverage parallel architecture, and the accuracy and computational efficiency of the code were assessed.
Materials and methods
In the gMCAP code, both APPROX and REFINED models utilize the same electromagnetic interaction algorithm. This article focuses on modeling and correction of electromagnetic interactions in Subsections A-C. Subsection D introduces the nuclear reaction algorithm employed by the APPROX model, specifically addressing the nuclear interactions between protons and H and O atoms. In Subsection E, the nuclear reaction algorithm of the REFINED model is presented, encompassing elastic nuclear reactions and inelastic nuclear reaction processes occurring between protons and each element present in the human body.
Geometry and proton transport algorithm
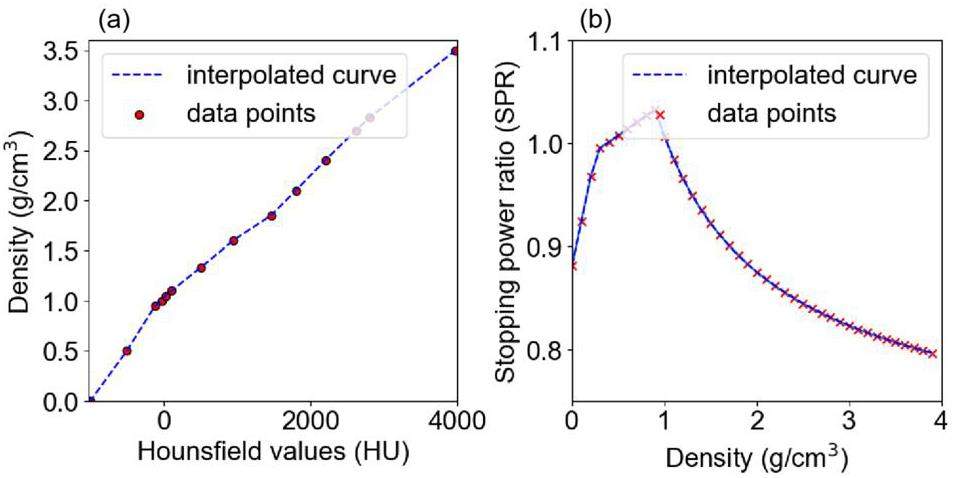
Serial CT images are routinely used for the planning and optimization of clinical treatment. First, standard calibration methods such as the Hounsfield unit (HU) look-up table are utilized to transform CT images into a three-dimensional density matrix ρ, as illustrated in Figure 1(a). Subsequently, regions of interest (ROI) are delineated using either threshold segmentation or artificial intelligence-based segmentation algorithms [39] to accurately represent tissues and organs with distinct material compositions. Furthermore, to determine the energy deposition at a specific step length Δs, we utilized the stopping power ratio (SPR) to rescale it to a step length in water, referred to as Δsw, using Eq. (1). The SPR is related to the proton energy and material density. It can be determined by using a fitting formula [22], stoichiometric calibration [40], or artificial intelligence [41]. In this case, the first method was utilized, and a portion of the conversion curve (160 MeV) is shown in Figure 1(b). The geometric structure and processes employed enable the transport of protons within voxels.
The transport of protons in the medium is influenced by both elastic and inelastic Coulomb collisions as well as elastic and inelastic nuclear interactions. Among these, numerous elastic Coulomb collisions occur, with almost 1×10⁶ instances per centimeter of the path [22]. Because of the impracticality of simulating these interactions individually, a Class II condensed history algorithm was employed for proton transport. A production threshold
Protons are transported stepwise in the voxel geometry. One step Δs is defined by the minimum of three step sizes: (1) the distance to the closest voxel boundaries; (2) the user-defined maximum step size, which is set to 1 mm, or the residual range corresponding to 20% of the initial energy; and (3) the mean free path of each interaction, including ionization, elastic nuclear interaction, and inelastic interaction. The mean free path λ is defined by Eq. (2):
Continuous interactions
Energy loss algorithm
According to Zhang et al. [42], the energy loss (ΔE) of a geometric step Δs in a material is equal to the energy deposited in the step Δsw in water. The proton's energy loss fluctuates around its mean energy loss

For a proton with initial energy Tp, the energy loss
The energy straggling model was implemented to rectify the exact energy deposition of the protons within a single step. The energy deposition exhibits a Gaussian distribution with
Multiple scattering model
Protons undergo elastic Coulomb collisions when they traverse matter, resulting in numerous small-angle deflections. These deflections can be simulated using a multiple scattering model. This study employs the multiple scattering theory proposed by Rossi and Greisen [44], which states that the deflection angle on the projection plane containing the initial track obeys a Gaussian distribution with σ as shown in Eqs. (5)-(6):
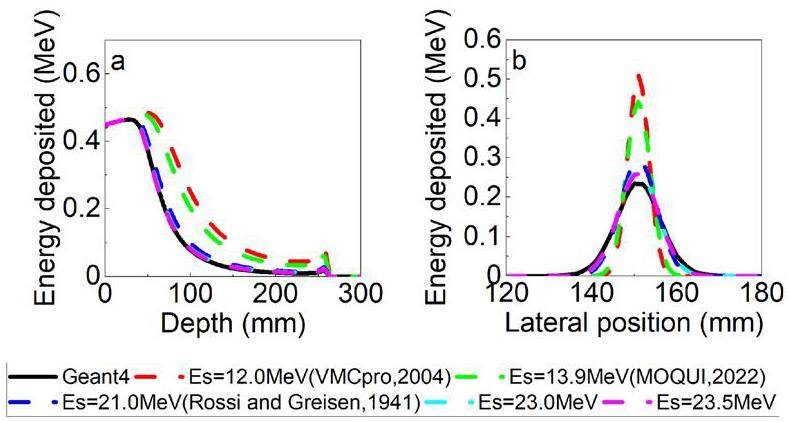
Within the gMCAP program of the registration-only electromagnetic interaction model, comparisons were made between the central axis depth dose (CADD) curve and the lateral dose distribution (LDD) at the peak position across various Es values. The experimental results, illustrated in Figure 3, were compared with Geant4 simulations to identify the most appropriate Es value. After conducting the simulations, the energy parameter was refined by setting Es to 23.5 MeV. This adjustment was implemented to maximize the precision of the electromagnetic process.
Ionization
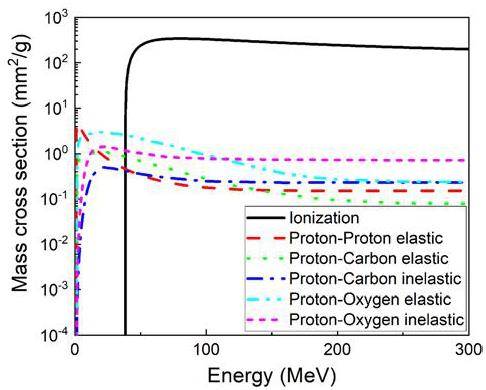
The ionization interactions between protons and matter are crucial for dose estimation. The cross-section for electromagnetic interactions is approximately two orders of magnitude larger than that for nuclear reactions. Taking G4_SKIN_ICRP as an example, which is composed of H (10%), C (20.4%), N (4.2%), O (64.5%), Na (0.2%), P (0.1%), S (0.2%), Cl (0.3%), K (0.1%). Figure 4 shows the cross-sectional data obtained from Geant4 scaled by mass density.
According to the two-body collision energy transfer relationship, the maximum energy
• G4BetheBlochModel, valid for Tp >2 MeV
• G4BraggModel, valid for Tp <2 MeV
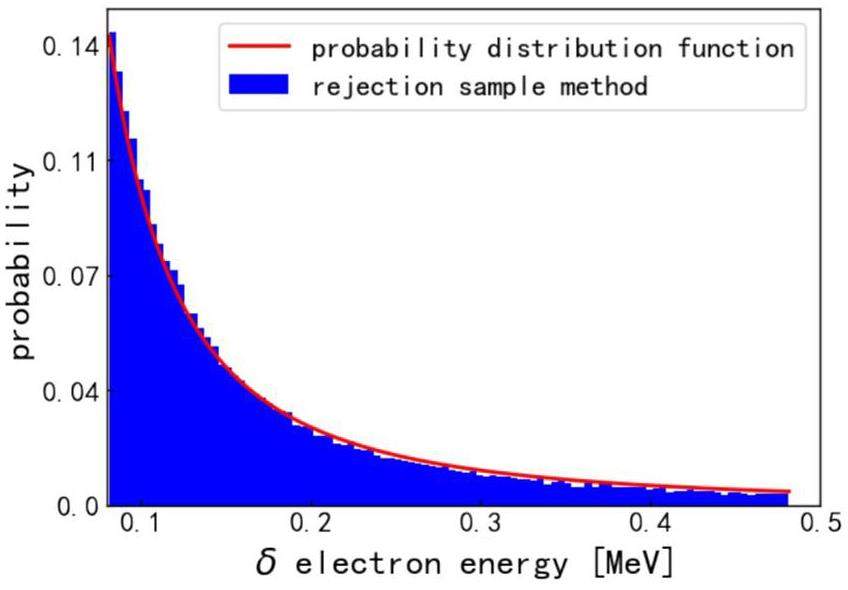
If an ionization event occurs during transport, a δ-electron is produced. The energy of the δ-electron is determined using a random sampling method with a probability distribution function [22]. Figure 5 shows the electron energy distribution produced by a 200 MeV proton.
The scattering angular deflection of the proton during this process is ignored, as the mass of the proton is much larger than that of an electron, and its direction hardly changes during a collision. The δ-electrons deposit energy locally and cease to be transported.
Simplified nuclear reaction: APPROX model
The simplified APPROX model focuses on nuclear interactions between protons and H and O atoms, including elastic and inelastic reactions. In the APPROX model, soft tissue is presumed to undergo nuclear reactions similar to those in water. Assuming this, all tissues consist of H and O with a mass ratio of 1:8. Different tissues and organs exhibit variations in density.
The cross-sections of the three nuclear reactions were calculated using Geant4 and tabulated. The model proposed by Fippel and Soukup [22] was used to sample the energy and scattering angle of the nucleus. For the secondary particles, where secondary protons are stored in the stack for further transportation, other charged particles release energy locally, and long-range particles, such as photons and neutrons, deposit energy proportionally.
Refined nuclear reaction: REFINED model
Because human tissues contain atoms other than H and O, it is necessary to consider the nuclear reactions of these atoms. Particularly for middle-Z and high-Z atoms, such as P, Ca, Fe, and I, the normalized nuclear reaction cross-section with protons is significantly lower than that of O. Thus, employing the APPROX model to estimate the radiation dose to the bone may result in inaccuracies.
Consequently, a more advanced nuclear reaction model, REFINED, was developed in this study. It encompasses the nuclear interactions between protons and elements including H, C, N, O, Na, Mg, P, S, Cl, K, Ca, Fe, and I. Similarly, the cross-sections of protons with these atoms were obtained using Geant4. Next, the program was initialized to compute the cross-sections for various materials and each individual nuclear reaction. At the post-step point, the discrete interaction type was sampled and specific nuclear reaction procedures were executed.
Elastic nuclear interactions
An elastic nuclear reaction is a two-body collision event that follows the laws of conservation of energy and momentum. The deflection angle of the recoil nuclei is sampled based on the differential section and calculated using Ranft's empirical formula [45], as shown in Eq. 9:
Once the deflection angle θ has been calculated, the energies of the incident proton and recoil nuclei can be acquired, and the direction of the incident proton can be updated. The energy of the heavy recoil nucleus is assumed to be deposited locally, and the updated protons continue to be transported.
Inelastic nuclear interactions
Inelastic nuclear interactions cause the proton to evaporate and transfer its energy to secondary particles. Similarly, distinct reaction channels are sampled depending on the cross-section of the inelastic nuclear reactions between the protons and each atomic nucleus. This study rectifies the distribution of the scattering angles for secondary protons, considering various target nuclei. According to Qin et al. [36], the sample expression for the angular cosine value cosθ of the secondary proton is given as Eq. 10:
The approach proposed by Fippel and Soukup [22] allows for the classification of secondary particles into three distinct categories: secondary protons, large-range particles (such as photons and neutrons), and short-range particles (such as alpha particles and heavier nucleus fragments). The energy of the secondary particles is sampled from a uniform distribution between the minimum energy (3 MeV here) and the remaining energy of the system. Subsequently, the new remaining energy is assigned by subtracting the energy of the secondary particles and additional binding energy. The energy of the short-range particles is deposited locally, whereas that of the long-range particles is released proportionally.
GPU implementation
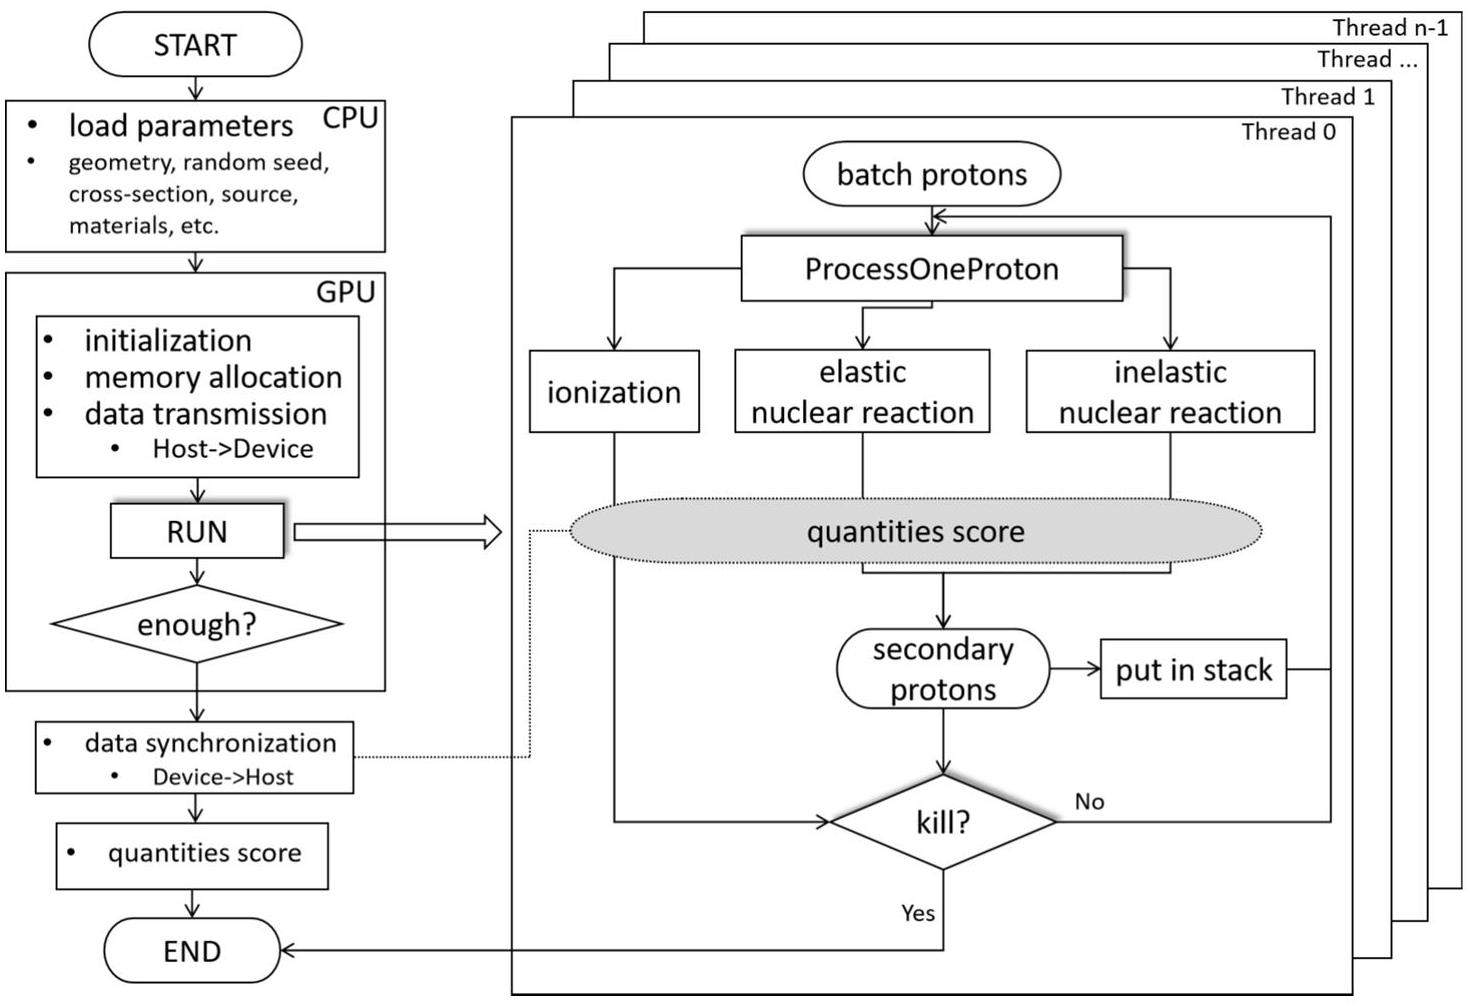
GPU parallel computing was implemented using CUDA v11.5, which supports programming in C/C++. When the program starts, the CPU initializes the cross-sectional data of the material, source information, geometric configuration, and random number seed. All these data are transferred from the CPU memory to the GPU global memory. After initialization, the primary and secondary protons are transported in batches, and each primary proton is transported using a GPU thread. Atomic addition is used to write the results to global memory to obtain the average dose of each voxel, thus avoiding memory conflicts and saving execution time.
The code employs a batch-based approach to compute statistical fluctuations, also known as statistical uncertainty. Typically, a single simulation consists of 10 batches. The calculation process is shown in Eq. 14, where v is the voxel, N is the number of batches,
Validation and comparison
Geant4 setup
Geant4 simulations were conducted using version 10.06 as a benchmark to compare dose distributions. The electromagnetic model utilized was G4EmStandardPhysics_option4, whereas G4HadronPhysicsQGSP_BERT_HP was employed as the hadron physics model along with G4HadronElasticPhysicsHP. In addition, the physical models G4StoppingPhysics, G4IonBinaryCascadePhysics, and G4DecayPhysics were included, as they are commonly used in proton radiation therapy [32]. The electron production cut was set to 0.1 mm, corresponding to an energy cutoff of 81.5 keV in gMCAP. The proton cutoff step size was set to 0.4 mm to balance accuracy and computation time. The Geant4 simulation was executed using an Intel Core i7-10875H CPU operating at a clock speed of 2.30 GHz.
Homogeneous and heterogeneous phantoms
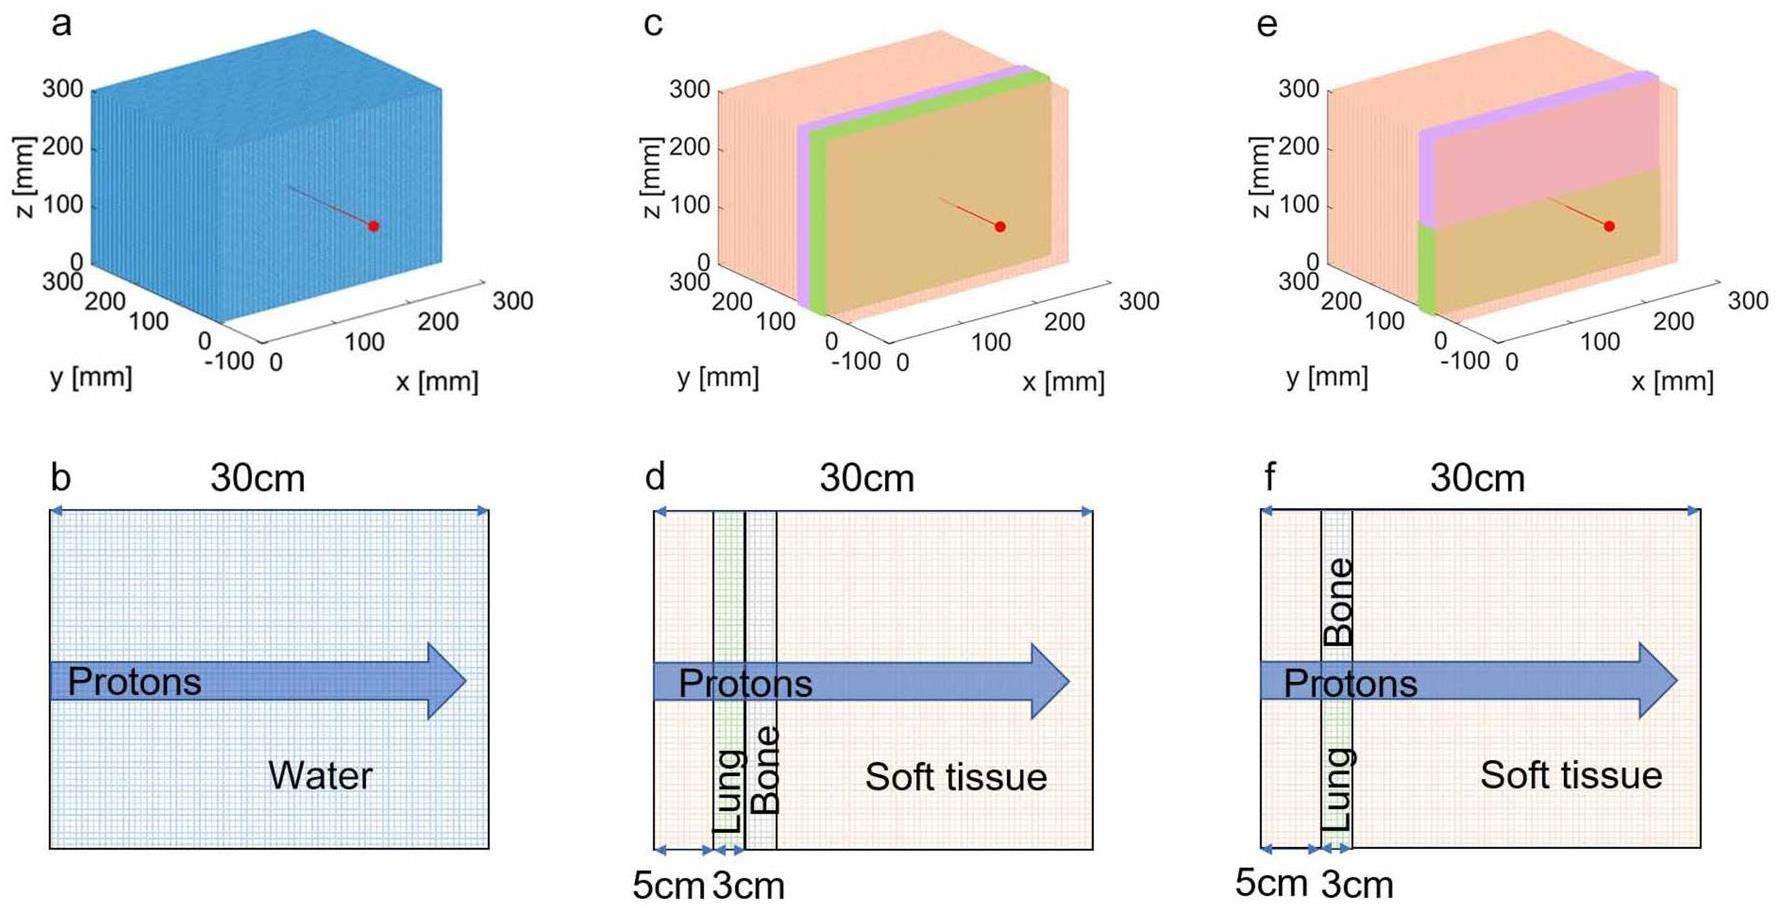
An extremely small proton beam was used to evaluate the stability of the gMCAP. The code was tested using three different phantoms: a uniform water phantom (WaterPhan), two standard heterogeneous phantoms (PhantomI and PhantomII) consisting of soft tissue, bone, and lung tissue. The voxel resolution for both the homogeneous and heterogeneous models was set to 1 mm×1 mm×1 mm, and the phantom size was 300 mm×300 mm×300 mm. In this experiment, proton beams with energies of 100 MeV, 150 MeV, and 200 MeV were employed to examine the water phantom. Additionally, a monoenergetic proton beam of 160 MeV was used to assess the heterogeneous phantom. Figure 7 illustrates a schematic of the source and geometry, as shown by Maneval et al. [31].
Clinical cases based on patient treatment plans
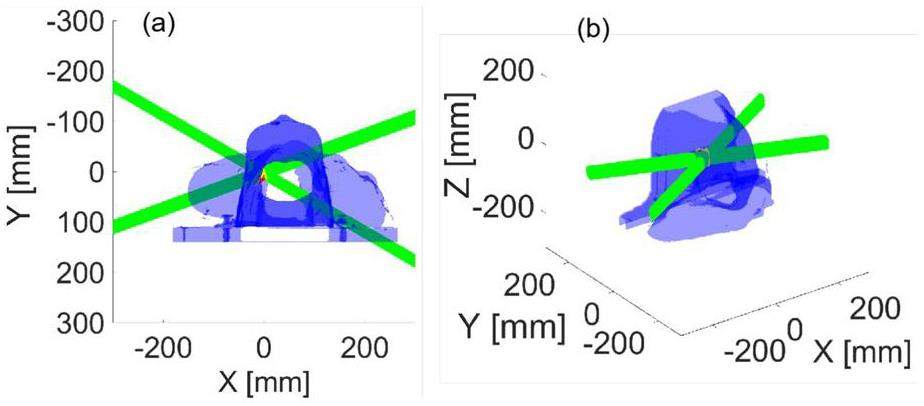
The suitability of the clinical case was evaluated using a dataset comprising head and neck CT data. The CT data were voxelized at a resolution of 0.875 mm×0.875 mm×3.000 mm, resulting in a total size of 512×512×79 voxels. Initially, a conversion process was applied to transform the HU values of the CT data into density values. Subsequently, the tissues were assigned. For the dose computation, the proton bixel width was set to 1 mm using the open-source treatment planning system matRad [46]. Information on 9651 rays from two irradiation fields was obtained. Figure 8 presents a schematic of the treatment plan in the laboratory coordinate system.
Moreover, in order to evaluate the impact of the two nuclear reaction models (APPROX and REFINED), proton beams with energies of 120 MeV, 140 MeV, and 180 MeV were utilized to irradiate the mandibular and tooth regions. These anatomical structures comprise tissues and organs that contain elements such as P and Ca. The dose distribution was recorded, and the relative deviations were analyzed using the two models.
Results
Validation for discrete interactions
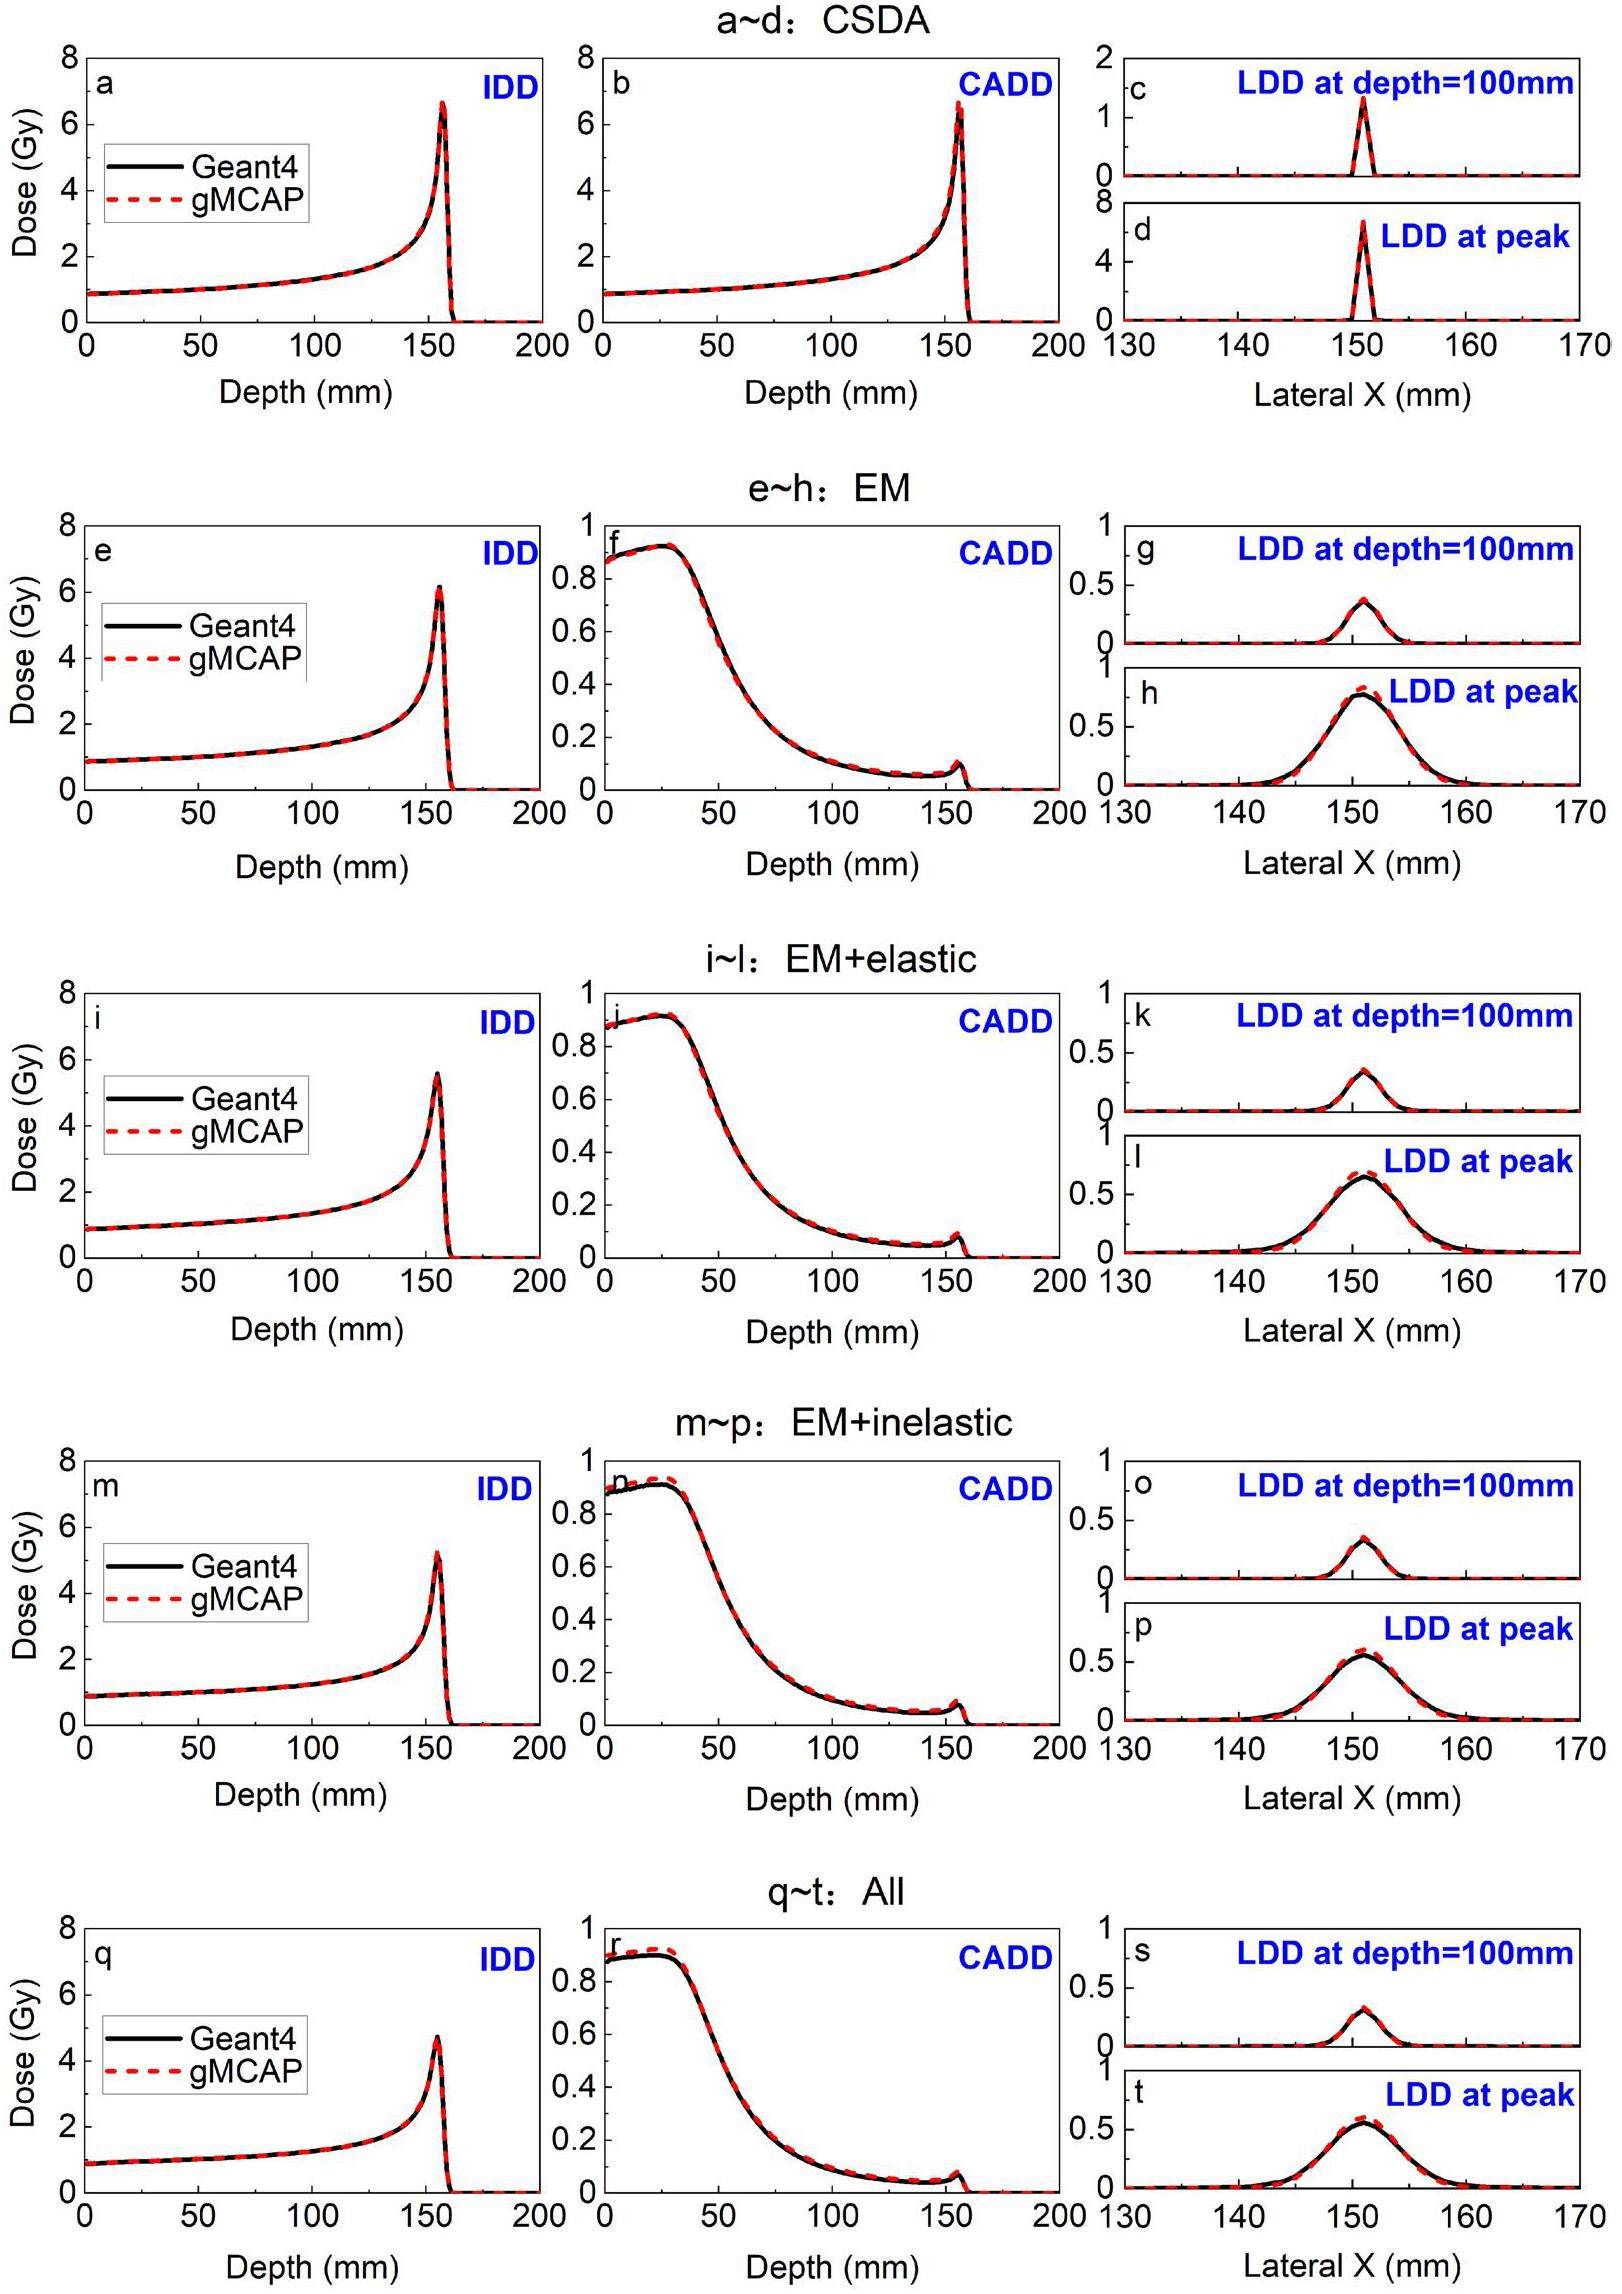
The discrete interaction was validated by comparing the dose distribution of a 150 MeV proton beam interacting with water using different physical models. In this study, the refined physical model, REFINED, of gMCAP was employed, whereas the well-studied simplified model, APPROX, was omitted because it has been extensively examined by previous researchers. Various physical models were tested separately, including CSDA, Electromagnetic Interactions (EM, which includes CSDA, Multiple Scattering, and Energy Straggling), Elastic Nuclear Interactions (EM + Elastic), Inelastic Nuclear Interactions (EM + Inelastic), and the complete set of physical models (All).
To verify the accuracy of the energy loss and angular deflection processes in each physical model, the integral depth dose (IDD), central axis depth dose (CADD), and lateral depth dose (LDD) at depth = 100 mm with LDD at the peak were examined and compared with the corresponding Geant4 results. The results, depicted in Fig. 9, demonstrate a strong agreement between gMCAP and Geant4, confirming the accuracy of the program's physical model. Notably, the LDD at the peak in gMCAP is slightly higher than that in Geant4. This discrepancy could be attributed to differences in the Multiple Scattering model being utilized. Despite the corrections made to this model in the present study, some deviations from Geant4 still exist. This discrepancy may be attributed to the exclusion of electron transport. However, it is important to emphasize that the level of inaccuracy is within an acceptable level. Further research on the transport model of secondary electrons will be conducted in the future.
Quantitative analysis
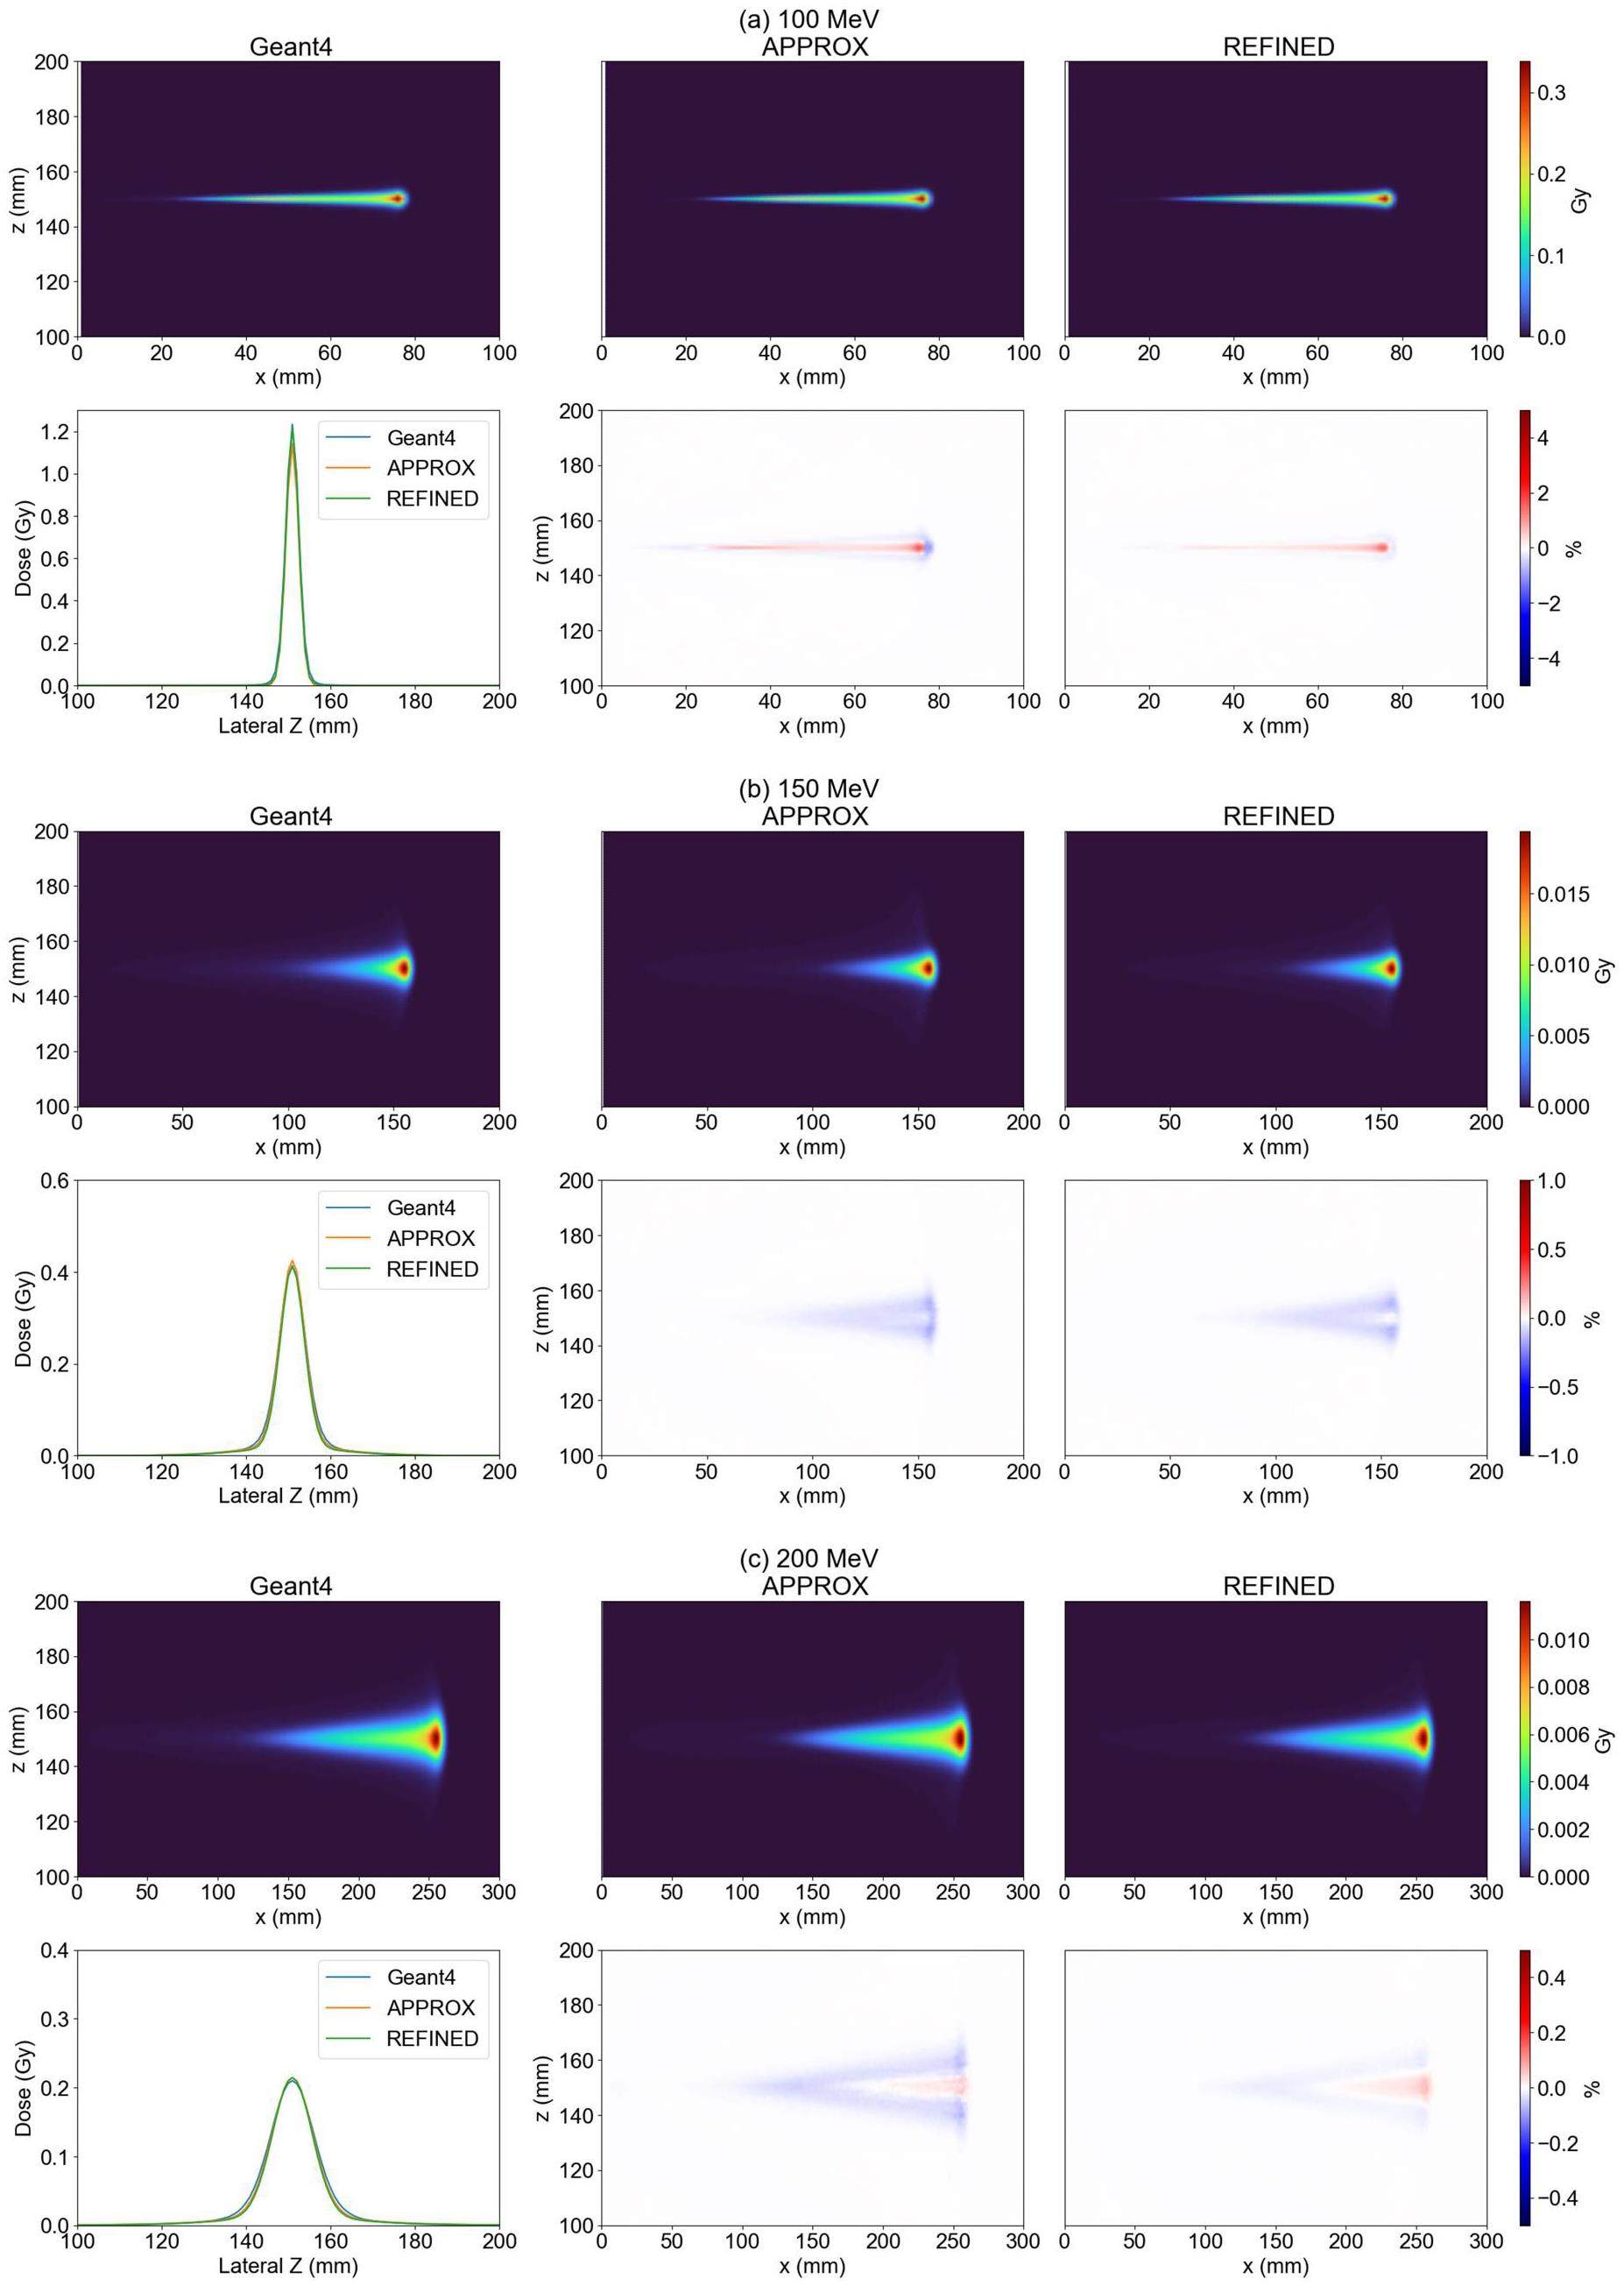
A quantitative analysis was conducted to compare the dose distributions of protons at different energy levels. This analysis involved the use of the APPROX and REFINED nuclear reaction models. The IDD curve was examined, as shown in Fig. 10. The results indicated that the disparity between the APPROX model and Geant4 was less than 5%. However, the REFINED model further reduced the overall deviation to 2%, with only a 1% deviation observed in the region beyond the distal fall-off area.

The analysis of the lateral distribution is presented in Fig. 11. The results demonstrate that the relative deviation between Geant4 and 90% of the data fell within 1%, indicating that the REFINED model exhibited better performance than the APPROX model.
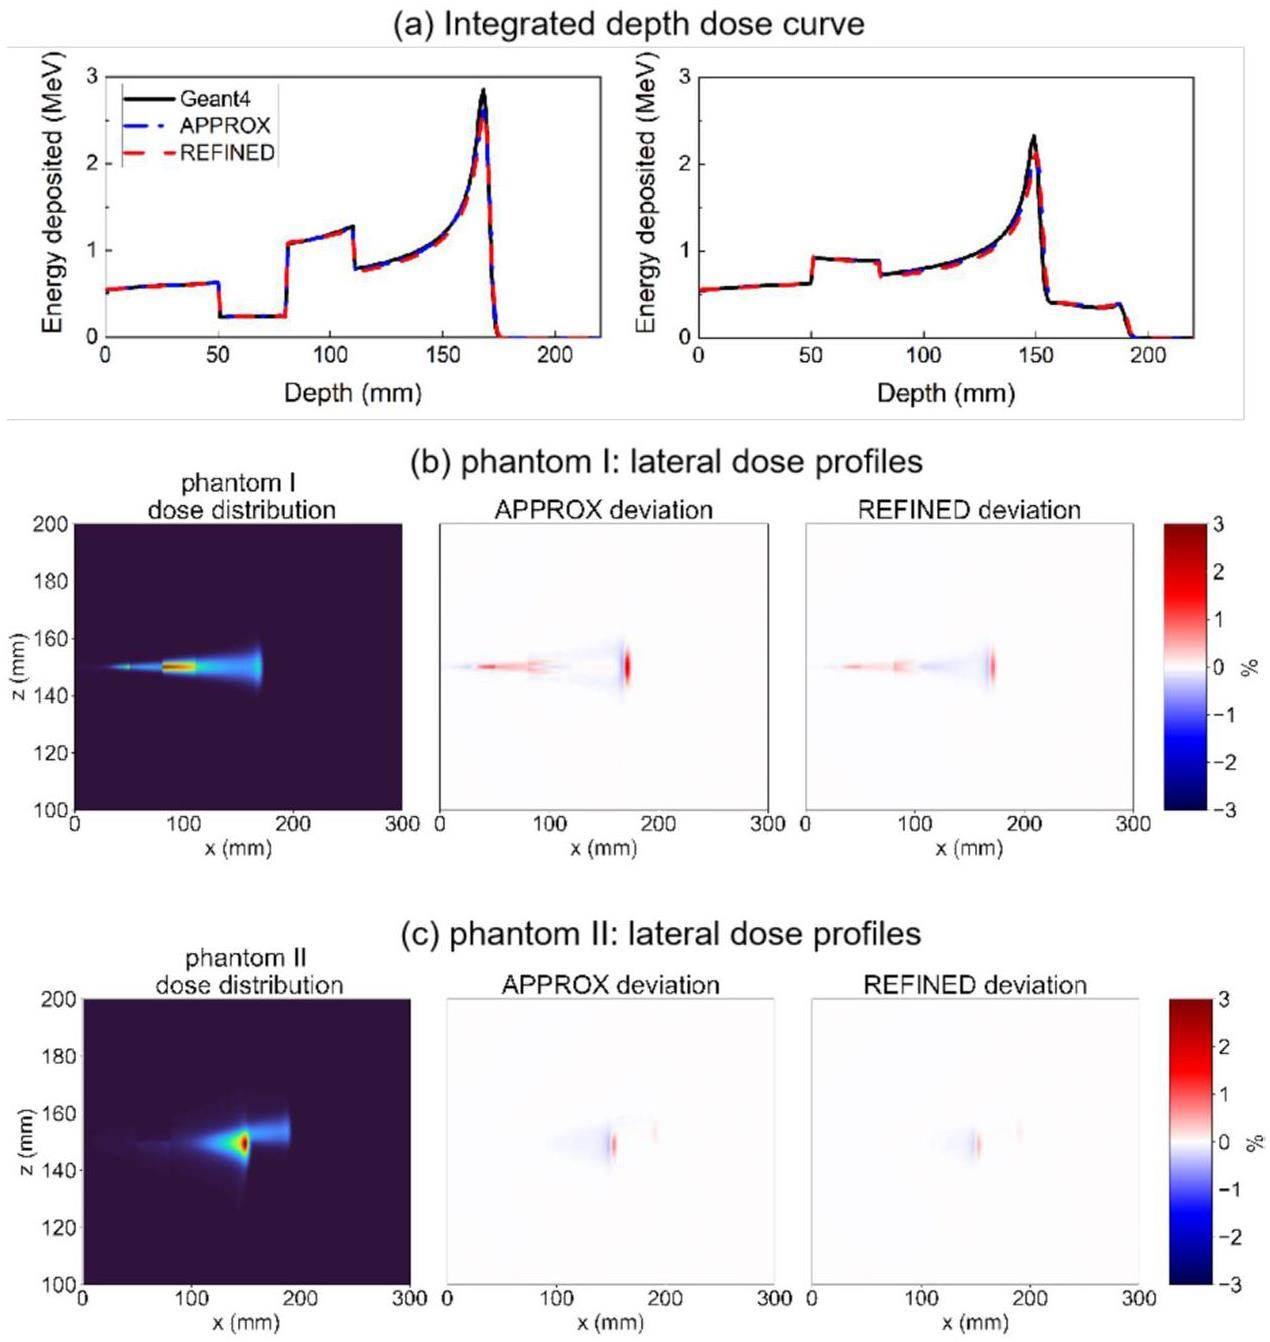
In addition, the heterogeneous model was used to evaluate the IDD curve and lateral dose profiles; the results are illustrated in Fig. 12. The results demonstrate good agreement between the dose distributions obtained from gMCAP and Geant4. Specifically, the relative deviation in the lateral dose profile was found to be within 3%. Notably, the REFINED model exhibited a reduced overall deviation compared to Geant4, in contrast to the APPROX model.
The gamma passing rate, defined in [47], is a widely employed metric in radiotherapy for assessing the similarity of dose distribution maps. It considers voxels with doses greater than 10% of the maximal dose. The findings, presented in Table 1, indicate a high level of concurrence with the Geant4. The gamma passing rate of 2mm/2% exceeds 99%. Moreover, the REFINED model outperformed the APPROX model in terms of results.
| Geometry | Criteria | APPROX (%) | REFINED (%) |
|---|---|---|---|
| WaterPhan 200 MeV | 1 mm, 1% | 98.39 | 99.26 |
| 2 mm, 2% | 98.90 | 100 | |
| 3 mm, 3% | 99.94 | 100 | |
| PhantomI 70 MeV | 1 mm, 1% | 97.14 | 97.75 |
| 2 mm, 2% | 98.97 | 99.31 | |
| 3 mm, 3% | 99.82 | 99.97 | |
| PhantomI 160 MeV | 1 mm, 1% | 97.63 | 98.12 |
| 2 mm, 2% | 99.46 | 99.90 | |
| 3 mm, 3% | 100 | 100 | |
| PhantomII 70 MeV | 1 mm, 1% | 95.15 | 95.28 |
| 2 mm, 2% | 98.16 | 99.53 | |
| 3 mm, 3% | 99.27 | 99.46 | |
| PhantomII 160 MeV | 1 mm, 1% | 95.33 | 95.73 |
| 2 mm, 2% | 98.88 | 99.87 | |
| 3 mm, 3% | 99.86 | 99.93 |
Dose results of clinical cases
The dose outcomes for treatment plans targeting the head and neck region were compared. The dose distribution for the middle slice is shown in Fig. 13. The overall dose results closely match those of Geant4, with the relative deviation between gMCAP and Geant4 within 4%. Moreover, the gamma passing rates for both the APPROX and REFINED models were nearly identical at approximately 99%.
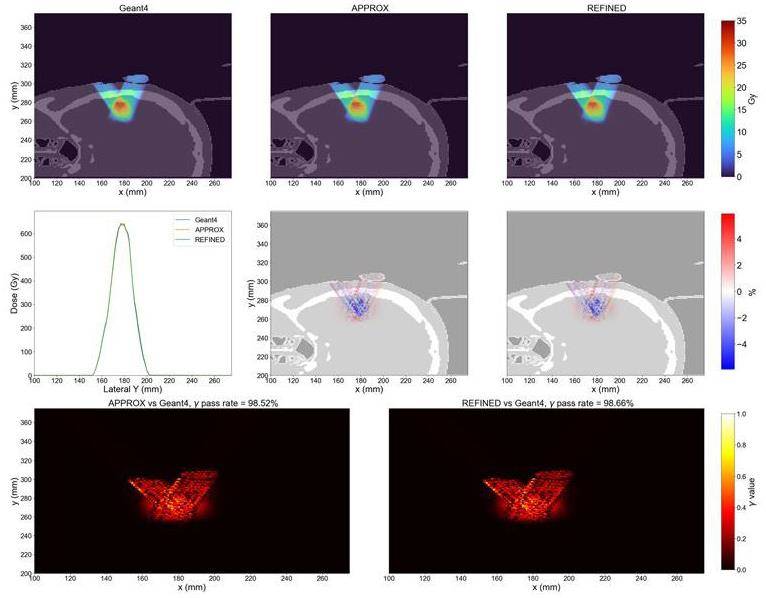
Furthermore, the dose outcomes along a line intersecting both beams and parallel to the y-axis were analyzed. The corresponding gamma values are also presented in the provided figure. This analysis provides additional insight into the agreement between gMCAP and Geant4 in terms of dose accuracy and conformity.
Efficiency gain
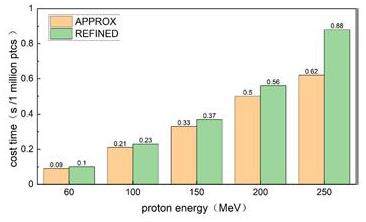
Compared to Geant4 running on a CPU for over 5 hours, gMCAP offers a significant reduction in runtime, completing the simulations within seconds. This translates to an efficiency gain of more than 1800 times in comparison to Geant4. The execution times for the two versions of gMCAP using the APPROX and REFINED models are summarized in Fig. 14. Using an NVIDIA GeForce RTX 4090 GPU, gMCAP achieved the transportation of one million particles in less than 1 second. Note that the REFINED model requires approximately 1.15 times more time than the APPROX model, with variations depending on the geometry and source type used in the simulations. These results highlight the efficiency and speed advantages of gMCAP for particle transport simulations.
The impact of various nuclear models
Figure 15 shows the dose distribution and relative deviation of the two nuclear reaction models. Deviation primarily occurs in the teeth and downstream regions. The proton energies of 120 MeV, 140 MeV, and 180 MeV result in a maximum variance of approximately 15%. The primary explanation for this deviation is the ability of nuclear events to substantially alter the angular dispersion of secondary particles, primarily secondary protons. The tooth area comprises approximately 29% Ca and 14% P. The angular distribution of secondary protons generated through nuclear reactions differs from that produced by p-O nuclear reactions, leading to distinct energy and momentum distributions of the secondary protons downstream. The REFINED model incorporates the nuclear reactions of Z elements such as P and Ca, which rectify the angular distribution of secondary particles, leading to distinct downstream dose distributions.

Conclusion and discussion
We have developed a GPU-accelerated program, gMCAP, which accurately calculates Monte Carlo (MC) proton dose distributions with precise discrete interactions and refined nuclear reaction models. gMCAP offers two nuclear interaction models: APPROX and REFINED. The APPROX model considers only H and O atoms, whereas the REFINED model considers all constituent elements of human tissues.
gMCAP with the REFINED nuclear model provides more accurate proton transport compared to that of certain programs employing simplified models. It demonstrates strong agreement with Geant4 and achieves a precision similar to that of current GPU-based Monte Carlo codes [29, 30] that utilize simplified models. For homogeneous phantoms, gMCAP achieved a gamma passing rate exceeding 99% for a 2mm/2% criterion. Moreover, the REFINED model in gMCAP outperformed the APPROX codes by achieving a gamma passing rate exceeding 95% for all phantoms with a 1mm/1% criterion. These results highlight the superior performance and precision of gMCAP in simulating proton dose distributions.
Additionally, gMCAP demonstrated favorable execution times. For instance, when simulating 10 million primary protons with an energy of 150 MeV in a water phantom consisting of 1 mm voxels, gMCAP required 3.7 seconds using an NVIDIA RTX 4090. In comparison, the Moqui software [32] required 18 seconds on an NVIDIA GTX 2080 Ti for the same simulation. Similarly, when simulating 10 million primary protons with an energy of 200 MeV, gMCAP [29] took 5.6 seconds on an NVIDIA RTX 4090, whereas the gPMC software took 21 seconds on a Tesla C2050. These results demonstrate that gMCAP offers efficient execution times, outperforms certain alternative software packages, and leverages the power of modern GPUs for accelerated Monte Carlo simulations.
Compared to the APPROX model, the REFINED model in gMCAP improves the gamma pass rate by 3%. This enhancement is particularly significant in tissue regions rich in elements such as Ca and P, which are abundant in the bones and teeth. In these regions, the difference between the REFINED and APPROX models can reach up to 15%. To ensure calculation accuracy, the REFINED model should be employed in tissue regions containing a higher proportion of middle-Z and high-Z components.
Despite offering a refined nuclear model for precise discrete proton reactions, the current implementation of gMCAP has certain limitations. One is that neutral particles are not considered, which can lead to specific discrepancies in dose calculations. Additionally, the absence of secondary electron transport may affect the evaluation of the radiation dose in the lungs [29].
To address these limitations, we plan to integrate our previous research on electron transport [48] into gMCAP in the next phase of development. Furthermore, we are exploring the integration of gMCAP with the open-source treatment planning system (TPS) matRad for dose calculation. In the future, we envision enhancing gMCAP as a versatile TPS calculation engine. Further improvements and advancements are required to make this system a comprehensive and reliable tool for treatment planning. Please note that the gMCAP code is still in the development stage and is not yet open source.
Studies of the radiation environment on the Mars surface using the Geant4 toolkit
. Nucl. Sci. Tech. 33, 11 (2022). https://doi.org/10.1007/s41365-022-00987-2Monte Carlo study of the neutron ambient dose equivalent at the heavy ion medical machine in Wuwei
. Nucl. Sci. Tech. 33, 119 (2022). https://doi.org/10.1007/s41365-022-01093-zTHUDose PD: a three-dimensional Monte Carlo platform for phantom dose assessment
. Nucl. Sci. Tech. 34, 164 (2023). https://doi.org/10.1007/s41365-023-01315-yMonte Carlo simulation for calculation of fragments produced by 400MeV/u carbon ion beam in water
. Nucl. Instrum. Meth. B 396, 18-25 (2017). https://doi.org/10.1016/j.nimb.2017.01.077Comparison between 4D robust optimization methods for carbon-ion treatment planning
. Nucl. Sci. Tech. 34, 139 (2023). https://doi.org/10.1007/s41365-023-01285-1Gate/Geant4-based Monte Carlo simulation for calculation of dose distribution of 400 MeV/u carbon ion beam and fragments in water
. Nucl. Sci. Tech. 27, 83 (2016). https://doi.org/10.1007/s41365-016-0097-3Design of a rapid-cycling synchrotron for flash proton therapy
. Nucl. Sci. Tech. 34, 145 (2023). https://doi.org/10.1007/s41365-023-01283-3SAPT: a synchrotron-based proton therapy facility in Shanghai
. Nucl. Sci. Tech. 34, 148 (2023). https://doi.org/10.1007/s41365-023-01293-1Investigation of combined degrader for proton facility based on BDSIM/FLUKA Monte Carlo methods
. Nucl. Sci. Tech. 33, 17 (2022). https://doi.org/10.1007/s41365-022-01002-4A scheme design of collimator for gantry in proton therapy facility
. Nucl. Instrum. Meth. A 791, 47-53 (2015) https://doi.org/10.1016/j.nima.2015.04.045.Dose reconstruction with Compton camera during proton therapy via subset-driven origin ensemble and double evolutionary algorithm
. Nucl. Sci. Tech. 34, 59 (2023). https://doi.org/10.1007/s41365-023-01207-1MCDB Monte Carlo Code with Fast Track Technique and Mesh Tally Matrix for BNCT
. J. Nucl. Sci. Tech.nol 44, 1518-1525 (2007). https://doi.org/10.1080/18811248.2007.9711401GPU-accelerated scanning path optimization in particle cancer therapy
. Nucl. Sci. Tech. 30, 56 (2019). https://doi.org/10.1007/s41365-019-0582-6Range uncertainties in proton therapy and the role of Monte Carlo simulations
. Phys. Med. Biol. 57,Differential pencil beam dose calculations for charged particles
. Med. Phys. 19, 137-149 (1992). https://doi.org/10.1118/1.596887A pencil beam algorithm for proton dose calculations
. Phys. Med. Biol. 41, 1305 (1996). https://doi.org/10.1088/0031-9155/41/8/005A pencil beam algorithm for intensity modulated proton therapy derived from Monte Carlo simulations
. Phys. Med. Biol. 50, 5089 (2005). https://doi.org/10.1088/0031-9155/50/21/010A particle track-repeating algorithm for proton beam dose calculation
. Phys. Med. Biol. 50, 1001 (2005). https://doi.org/10.1088/0031-9155/50/5/022A GPU implementation of a track-repeating algorithm for proton radiotherapy dose calculations
. Phys. Med. Biol. 55, 7107 (2010). https://doi.org/10.1088/0031-9155/55/23/S11Comparison of a finite-element multigroup discrete-ordinates code with Monte Carlo for radiotherapy calculations
. Phys. Med. Biol. 51, 2253 (2006). https://doi.org/10.1088/0031-9155/51/9/010Accuracy of Acuros XB and AAA dose calculation for small fields with reference to RapidArc® stereotactic treatments
. Med. Phys. 38, 6228-6237 (2011). https://doi.org/10.1118/1.3654739A Monte Carlo dose calculation algorithm for proton therapy
. Med. Phys. 31, 2263-2273 (2004). https://doi.org/10.1118/1.1769631A generic algorithm for Monte Carlo simulation of proton transport
. Nucl. Instrum. Meth. B 316, 144-159 (2013). https://doi.org/10.1016/j.nimb.2013.08.035Development of a GPU-based Monte Carlo dose calculation code for coupled electron–photon transport
. Phys. Med. Biol. 55, 3077 (2010). https://doi.org/10.1088/0031-9155/55/11/006GPU-based fast Monte Carlo simulation for radiotherapy dose calculation
. Phys. Med. Biol. 56, 7017 (2011). https://doi.org/10.1088/0031-9155/56/22/002ARCHERRT–A GPU-based and photon-electron coupled Monte Carlo dose computing engine for radiation therapy: Software development and application to helical tomotherapy
. Med. Phys. 41,GPUMCD: a new GPU‐oriented Monte Carlo dose calculation platform
. Med. Phys. 38, 754-764 (2011). https://doi.org/10.1118/1.3539725THUBrachy: fast Monte Carlo dose calculation tool accelerated by heterogeneous hardware for high-dose-rate brachytherapy
. Nucl. Sci. Tech. 32, 32 (2021). https://doi.org/10.1007/s41365-021-00866-2GPU-based fast Monte Carlo dose calculation for proton therapy
. Phys. Med. Biol. 57, 7783 (2012). https://doi.org/10.1088/0031-9155/57/23/7783Fred: a GPU-accelerated fast-Monte Carlo code for rapid treatment plan recalculation in ion beam therapy
. Phys. Med. Biol. 62, 7482 (2017). https://doi.org/10.1088/1361-6560/aa8134pGPUMCD: an efficient GPU-based Monte Carlo code for accurate proton dose calculations
. Phys. Med. Biol. 64,MOQUI: an open-source GPU-based Monte Carlo code for proton dose calculation with efficient data structure
. Phys. Med. Biol. 67,GPU-based cross-platform Monte Carlo proton dose calculation engine in the framework of Taichi
. Nucl. Sci. Tech. 34, 77 (2023). https://doi.org/10.1007/s41365-023-01218-yThe Composition of Body Tissues
. Reports of the International Commission on Radiation Units and Measurements os-24, 5-9 (1992). https://doi.org/10.1093/jicru_os24.1.5Appendix D: proton data tables
. Reports of the International Commission on Radiation Units and Measurements os-32, 166-236 (2000). https://doi.org/10.1093/jicru_os32.2.166Recent developments and comprehensive evaluations of a GPU-based Monte Carlo package for proton therapy
. Phys. Med. Biol. 61, 7347 (2016). https://doi.org/10.1088/0031-9155/61/20/7347Basic anatomical and physiological data: The skeleton
. Annals of the ICRP. 25, 1-80 (1995). https://doi.org/10.1016/S0146-6453(00)80004-4Nuclear data needs for neutron therapy and radiation protection
. Radiat. Port. Dosim 70, 1-12 (1997). https://doi.org/10.1093/oxfordjournals.rpd.a031920A review of deep learning based methods for medical image multi-organ segmentation
. Phys. Medica 85, 107-122 (2021). https://doi.org/j.ejmp.2021.05.003j.ejmp.2021.05.003The calibration of CT Hounsfield units for radiotherapy treatment planning
. Phys. Med. Biol. 41, 111 (1996). https://doi.org/10.1088/0031-9155/41/1/009Convolutional neural network based proton stopping-power-ratio estimation with dual-energy CT: a feasibility study
. Phys. Med. Biol. 65,Calculation of water equivalent thickness of materials of arbitrary density, elemental composition and thickness in proton beam irradiation
. Phys. Med. Biol. 54, 1383 (2009). https://doi.org/10.1088/0031-9155/54/6/001GEANT4—a simulation toolkit
. Nucl. Instrum. Meth. A 506, 250-303 (2003). https://doi.org/10.1016/S0168-9002(03)01368-8Cosmic-ray theory
. Rev. Mod. Phys 13, 240 (1941). https://doi.org/10.1103/RevModPhys.13.240Estimation of radiation problems around high-energy accelerators using calculations of the hadronic cascade in matter
. Part. Accel. 3, 129-161 (1972). https://doi.org/10.1130/0016-7606(1981)92<197:TPODRA>2.0.CO;2Development of the open‐source dose calculation and optimization toolkit matRad
. Med. Phys. 44, 2556-2568 (2017). https://doi.org/10.1002/mp.12251A technique for the quantitative evaluation of dose distributions
. Med. Phys. 25, 656-661 (1998). https://doi.org/10.1118/1.598248Development of a GPU-accelerated photon-electron coupled transportation Monte Carlo code and its application
. J. Harb. Eng. Uni 43, 1649-1656 (2022). https://doi.org/10.11990/jheu.202206028The authors declare that they have no competing interests.

