Introduction
Liquid scintillator (LS) detectors are extensively used in nuclear and particle physics. Over the past few decades, LS detectors have played crucial roles in achieving remarkable scientific results in neutrino experiments [1-5]. The central detector (CD) of the Jiangmen Underground Neutrino Observatory (JUNO) will be the largest liquid scintillator detector in the world, aiming to probe multiple physics goals. One of the primary goals of the JUNO is to determine the mass ordering of neutrinos by accurately measuring and distinguishing tiny structural differences in the energy spectra of reactor neutrinos. Additionally, JUNO has a good potential for measuring neutrino oscillation parameters, supernova neutrinos, solar neutrinos, atmospheric neutrinos, and more. JUNO developed highly transparent LS and highly efficient photomultiplier tubes (PMTs) [6] with 78% photo coverage [7]. JUNO requires these designs to achieve the key requirements for determining neutrino mass ordering, including an unprecedented energy resolution of
Efficient algorithms are necessary to reconstruct individual event energies at the JUNO. In the LS, physics events deposit energy that is converted into photons that propagate and are detected by the PMTs. The type of particle and the magnitude and location of its energy deposition correspond to different hit patterns in the detector. Therefore, we can utilize hit information from the detector to reconstruct both the deposited energy and vertex of the particles and to identify their type. Typically, the energy is reconstructed based on the number of detectable photons, known as the visible energy (Evis). Conversely, events can be classified as track-like (mainly muon-like events with long tracks in the detector) or cluster-like based on the topology of energy deposition in the detector. In addition, if a cluster is sufficiently small, it can be treated as a point-like event. The second moment S (Eq. (1)) was introduced to describe the shapes of both point- and cluster-like events. This physical quantity is commonly used in collider experiments to describe the shapes of the clusters in energy calorimetry [10, 11].
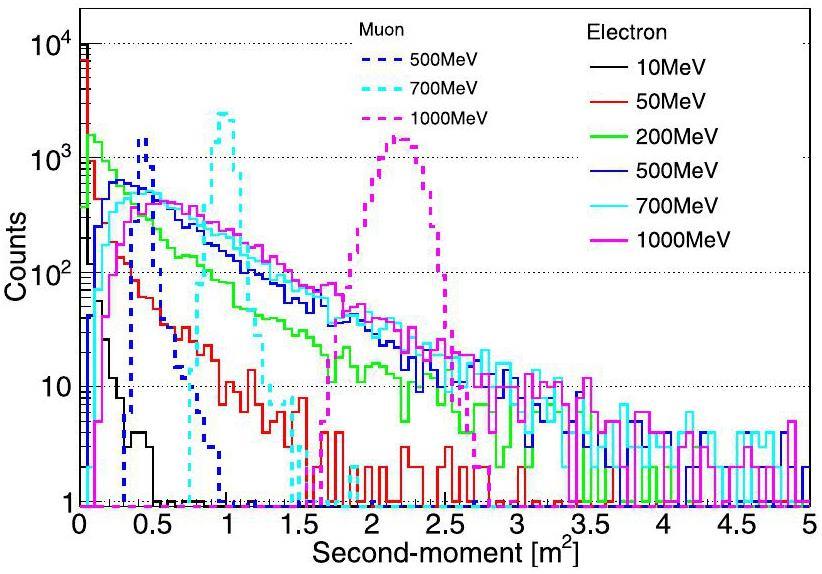
Figure 1 compares the distributions of the second moment for electrons with different kinetic energies in the JUNO's LS. As the kinetic energy of the electrons increased, the distribution of the second moment became more diffused, indicating that it corresponded to a larger cluster of energy deposition. For comparison, Fig. 1 also shows the second-moment distribution of muons with different energies deposited in the LS. It can be observed that the second-moment distribution of the cluster- and track-like events with the same energy deposition is very different, which is related to their shape differences in energy deposition.
The basic idea of the current energy reconstruction algorithms in the JUNO central detector is based on either a data-driven maximum likelihood method (traditional method) or a machine learning strategy that utilizes information from the detector hit pattern. For example, reactor neutrinos (
In general, the precise energy reconstruction in LS detectors faces several challenges:
(1) Precise PMT charge reconstruction. Because energy reconstruction primarily relies on the PMT charge information, any deviations in the PMT charge reconstruction will affect the accuracy of the energy measurement. In particular, the potential deviation of the reconstructed charge of the PMT (charge nonlinearity) is a crucial issue to consider for the energy reconstruction of high-energy events.
(2) Energy nonuniformity. Owing to the optical attenuation effect during the photon transmission process and the potential optical shielding effect caused by the mechanical structure of the detector and the PMT reception efficiency, the visible energy of the event is position-dependent.
(3) Event topology. Different reconstruction methods are typically required to handle track- and point- /cluster-like events separately.
(4) The impact of deviations in event tracks or the vertex/energy-deposit center on the energy reconstruction must be estimated.
(5) Energy leakage.
The data-driven maximum likelihood method has the advantage of better modeling of the response of a real detector. It primarily utilizes the detector response to radioactive sources as calibration templates, with the energy of radioactive sources being in the MeV range. A calibration map describing the dependence of visible energy on location can be constructed according to the calibration templates of the radioactive sources loaded at different locations of the detector. Consequently, the energy nonuniformity can be controlled to less than 1% [13]. Machine learning approaches, including convolutional neural networks (e.g., VGG and ResNet), have shown good performance in event reconstruction by effectively utilizing information from the detector response [15-17, 20-22]. However, it is crucial to note that machine learning methods rely on a pure training sample from the data or simulation. A pure training sample from the data requires a reliable selection strategy and data accumulation, whereas the simulation usually requires adjustments according to the real data, especially in the early stages of detector operation.
In this study, we investigated the energy reconstruction of events spanning from MeV to GeV in the JUNO CD using the data-driven maximum likelihood method [14]. The data-driven maximum likelihood method and machine learning method in previous reconstruction algorithms have high requirements for the accuracy of PMT charge reconstruction, as mentioned earlier. We only utilized information of the PMT firing states (fired or unfired), known as the OCCUPANCY method to reduce the dependence on the accuracy and nonlinearity of the PMT charge reconstruction. The determination of the PMT firing states depends on the relationship between the PMT charge and the threshold. The fired state corresponds to the PMT charge equal to or greater than a certain threshold, whereas the unfired state corresponds to the PMT charge less than this threshold. This study focused on the reconstruction of cluster-like events because the calibration templates in this study were constructed using point-like (or cluster-like) calibration sources. Based on a study of event identification at JUNO [18], we can effectively distinguish cluster-like events from track-like events. The reconstruction of track-like events is also an important topic and was investigated in [18-22, 26-29]; however, it is not the subject of this study.
The details of our study are as follows. First, we introduce the JUNO detector and 3-inch PMT system (Sect. 2). We then present the methodology of our reconstruction (Sect. 3), including the construction of calibration maps and the construction of the maximum likelihood function. In Sect. 4, we show and compare the reconstruction performances. Finally, the summary is presented in Sect. 5.
JUNO detector and 3-inch PMT system
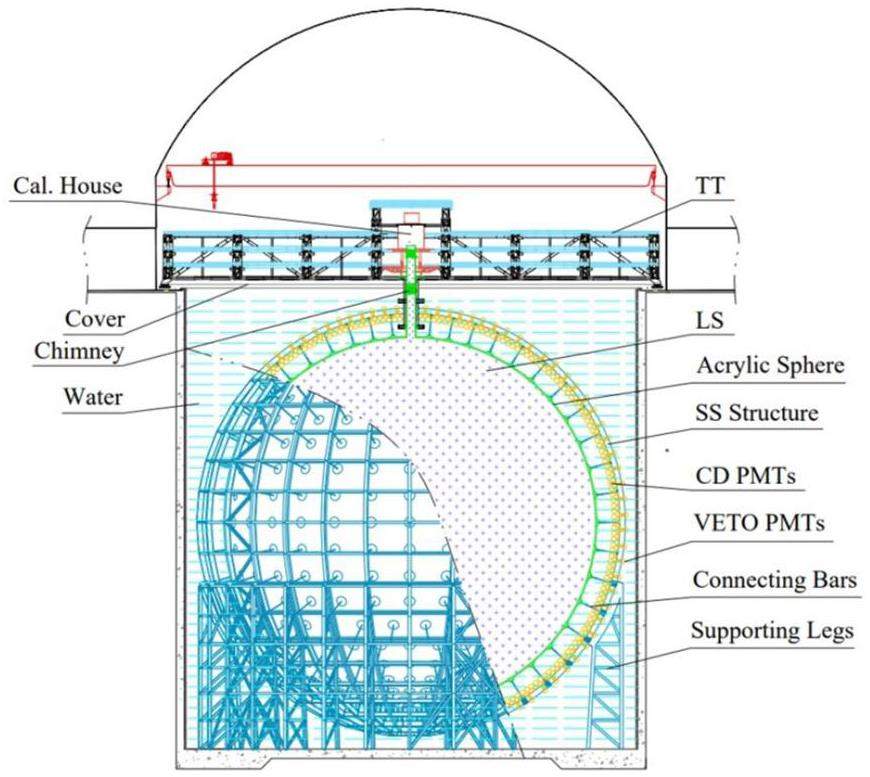
As shown in Fig. 2, JUNO mainly comprises three subdetectors: the CD, water Cherenkov detector, and top tracker detector [7, 30]. The CD consisted of 20 kilotons of LS and a 12 cm thick acrylic spherical container with a diameter of 35.4 m. The acrylic sphere is supported by a stainless-steel latticed shell through acrylic nodes and connecting bars. The primary component of the LS is linear alkyl benzene (LAB) with PPO (2.5-diphenyloxazole) as fluor and bis-MSB as the wavelength shifter. A total of 17612 20-inch PMTs (LPMTs) and 25600 3-inch PMTs (SPMTs) will be installed on the exterior of the container as photosensors to collect photon signals. Consequently, more than 1345 photoelectrons (PEs) will be observed by CD for a 1 MeV electron that fully deposits its kinetic energy in the LS [7]. SPMTs will operate almost exclusively in the single photoelectron (spe) mode for reactor antineutrino detection (Evis < 10 MeV). Therefore, SPMTs can serve as linear references for LPMTs and can be used to calibrate the charge nonlinearity of LPMTs. This feature is helpful in constraining some of the systematic uncertainties in LPMT energy reconstruction and improving the energy resolution. Moreover, SPMTs have the potential to detect supernova neutrinos and measure solar parameters (θ12 and
For the detection of events with energies greater than tens of MeV or even GeV, most LPMTs receive tens or even hundreds of PEs. For example, Fig. 3a shows the distribution of the number of PEs (nPE) received by the LPMTs for 500 MeV electrons that deposit their kinetic energies in the LS. All the LPMTs were fired in this case. If energy deposition occurs at the edge of the detector, nearby LPMTs receive even more PEs. The linearity of the LPMT charge reconstruction over a large charge dynamic range is a challenge that requires calibration and validation in the future. Based on the experience with Daya Bay, an independent measurement system is an effective solution [32, 33]. In JUNO, the SPMT can be used to calibrate the nonlinearity in the charge reconstruction of the LPMT. For comparison, in the same case in which 500 MeV electrons deposited their kinetic energies in the LS, approximately 45%-60% of SPMTs were not triggered (Fig. 3c, and most of the fired SPMTs received fewer than 5 PEs (Fig. 3b because their photocathode areas are approximately 40 times smaller. Therefore, we developed an energy reconstruction algorithm using only the information from SPMTs. In addition, the study in [34, 35] suggested that the readout electronics of JUNO SPMTs may also exhibit nonlinearity when receiving multiple hits. To minimize this effect, we used only the firing information (fired or unfired). Further details are provided in Sec. 3

The JUNO detector is currently under construction. To investigate the performance of our reconstruction, Monte Carlo (MC) simulation data generated by the JUNO offline software [36-40] was utilized. The software is based on the Geant4 toolkit [41-43] and the software for non-collider physics experiments (SNiPER) framework [44]. In the simulation, a realistic detector geometry, comprehensive physical interaction processes, scintillation processes, and optical transmission processes were employed. The optical parameters of the LS were implemented based on precise measurements [45-52]. Furthermore, we incorporated official electronic simulations that include SPMT's charge smearing, transit time spread, and dark noise, which are referenced in the measurement [53, 54]). In this study, both the calibration and validation samples were generated based on MC simulations with identical configurations.
Method of energy reconstruction
The probabilities of SPMT's firing states
For each SPMT, the number of detected PEs obeys a Poisson distribution as follows:
(1)
(2)
Construction of the calibration map
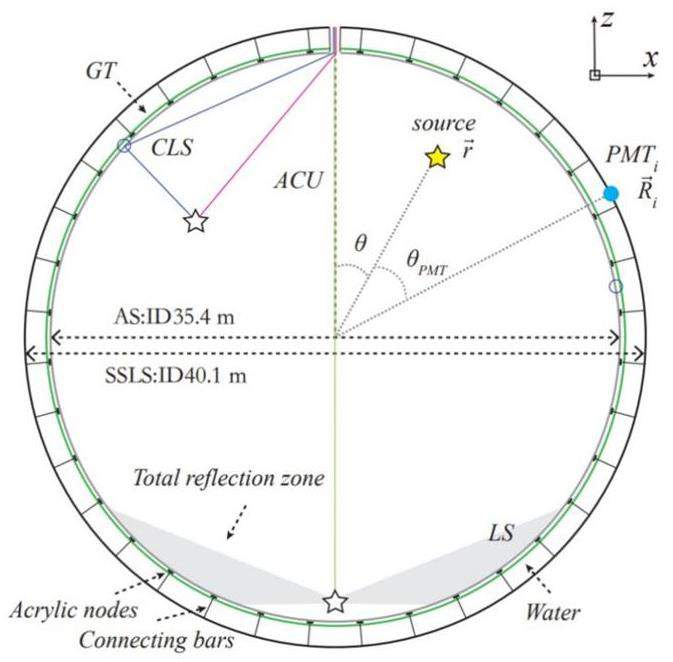
JUNO designed a comprehensive calibration system [7] to understand the detector response by deploying multiple radioactive sources in various locations inside/outside the CD, including the Auto Calibration Unit (ACU), Cable Loop System (CLS), Guide Tube Calibration System (GTCS), and Remotely Operated Vehicle (ROV). Figure 4 shows the individual calibration systems in the CD and their scanning regions. For example, the ACU system scans the detector response along the central axis with multiple calibration sources, and the CLS system can scan in a 2-dimensional plane (X-Z plane) with multiple calibration sources using the central and side cables. The strategy of the JUNO calibration system was developed and optimized based on the Monte Carlo simulation results [57].
In energy reconstruction,
Based on the calibration strategy of JUNO [57], this study used the 68Ge source (positron source, with Esource=1.022 MeV) to calibrate the X-Z plane with assistance from both the ACU and CLS systems across 227 positions. Using the JUNO offline software [36-40], 10000 68Ge events were generated for each calibration location on the X-Z calibration plane. During the calibration, when the 68Ge source is loaded at one of the 227 planned locations [58], the probability of the unfired state for the ith SPMT can be estimated using Eq. (9). Where
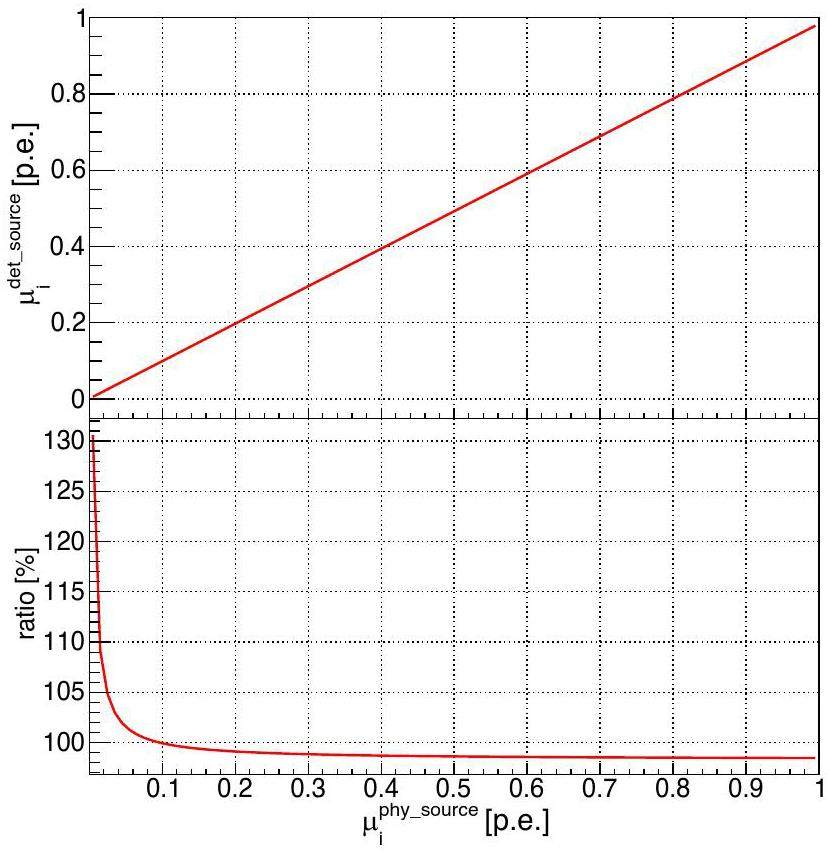
Considering that the CD has good symmetry and the SPMTs with the same relative position with respect to the calibration source exhibit similar responses, to enhance the accuracy, we further group and combine SPMTs with similar θSPMT values in the calculation of
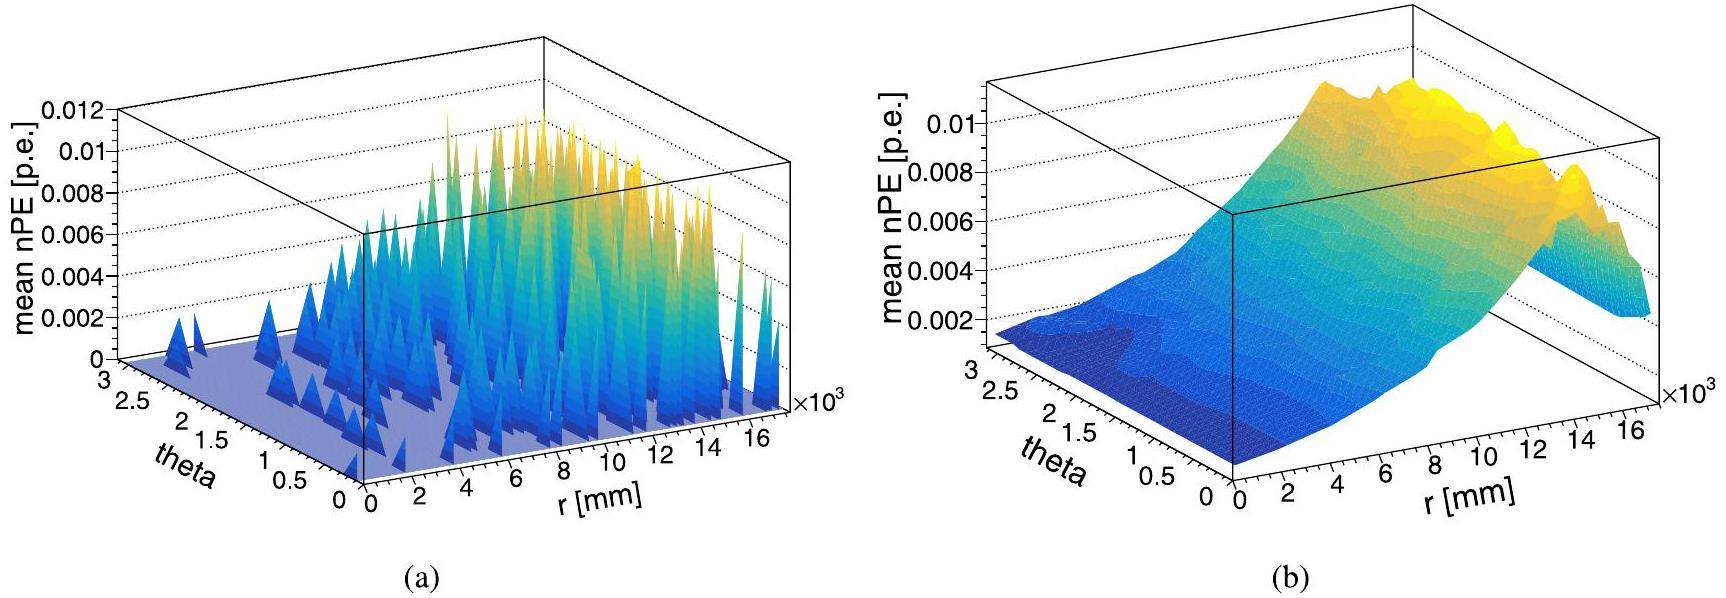
The following is a brief summary of the main steps involved in constructing the calibration map.
(1) For 68Ge loading at location
(2) Calculate
(3) Calculate
(4) Repeat the above steps for the calibration data at all locations.
(5) Apply interpolation to the remaining positions.
(6) For a given 68Ge location
The calibration map was generated using the calibration data on the X-Z plane (ϕ=0) by considering that the detector exhibits good symmetry along the ϕ direction [57]. Based on the detailed study in [13], the ϕ symmetry is reliable for events located within 16 m. However, considering that the acrylic sphere is supported by a stainless-steel latticed shell through acrylic nodes and connecting bars, the dependence on ϕ near the edge cannot be ignored anymore due to the shadowing effect caused by the numerous acrylic nodes. In the future, the ϕ symmetry needs to be checked and validated using real data, which can be corrected if necessary.
Construction of maximum likelihood function
To reconstruct the visible energy of a cluster-like event whose energy-deposit center is known in the detector, a likelihood function can be constructed as follows:
Next, the ROOT's minimization class TMinuit2Minimizer [60-62] is used to minimize
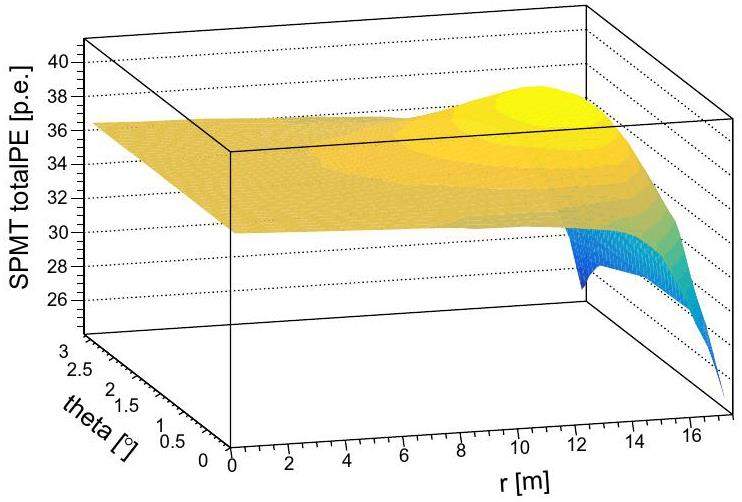
Comparison of cluster-like event and point-like event
68Ge was used as the positron source. The positron annihilated in the source capsule (stainless steel + PTFE) with a pair of 0.511 MeV γs emitted. Most of the energy of γs is deposited within ~30 cm in the LS; therefore, 68Ge is not strictly a point-like source but a cluster-like source similar to the high-energy electrons described in Sect. 1. In [13], it was found that accurate energy reconstruction below 10 MeV can be affected by the cluster size of the energy deposition. In this study, we constructed a calibration map using the approximate point-like 68Ge source (cluster size in ~30 cm) to determine the location-dependent
According to Eq. (8),
Reconstruction result
In this section, the JUNO offline software was used to simulate electrons uniformly distributed in the CD with different kinetic energies (10, 20, 50, 100, 200, 350, 500, 700, 1000, and 2000 MeV) as the MC sample to validate the reconstruction algorithm. The MC samples were generated after a full-chain simulation at JUNO. A 16 m radius cut was applied to avoid energy leakage for high-energy events and the total reflection effect at the edge of the detector. Finally, approximately 10000 events exist for each electron sample.
Reconstruction of energy-deposit center
As introduced in Sect. 3.3, the energy-deposit center of the event is required to reconstruct the visible energy. Therefore, before energy reconstruction, it is necessary to reconstruct the energy-deposit center. The energy-deposit center reconstruction of high-energy cluster-like events faces greater dispersion compared with the vertex reconstruction of point-like events (Sect. 1). After the investigation, it was found that the time-based algorithm developed and verified by [63] was suitable and could be applied to our analysis.
The time-based algorithm uses the distribution of the time-of-flight (t.o.f.) corrected time Δt (Eq. (19)) of an event to reconstruct its vertex and t0 (event time). The principle of the time-based algorithm is that the Δt distribution is independent of the event vertex after applying time-of-flight correction. In this study, we applied it to the reconstruction of an energy-deposit center.

In Fig. 9, it can be observed that the reconstruction resolutions of r, θ and ϕ increase with electron energy between 50 MeV and 1 GeV. For example, the resolutions of r, θ and ϕ were approximately 100 mm, 0.5° and 1.0° for 50 MeV electrons, respectively, whereas the resolutions of r, θ and ϕ were approximately 340 mm, 1.8° and 3.0° for 1 GeV electrons, respectively. This effect is primarily due to the greater dispersion of the energy deposition of high-energy electrons. The resolutions of 10 MeV electrons are slightly larger than that of 50 MeV electrons. This is because the hit number of the SPMTs is small (~400 PEs for 10 MeV) and less information is available for reconstruction using the time-based algorithm.
Energy reconstruction performance
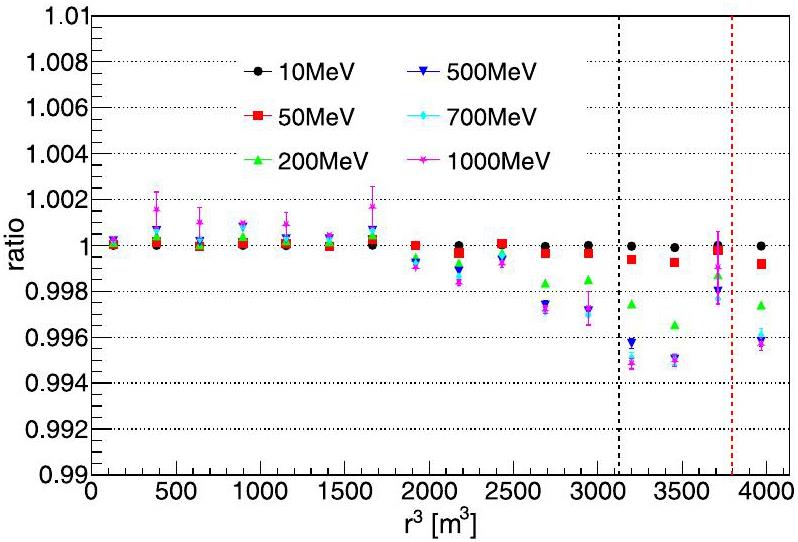
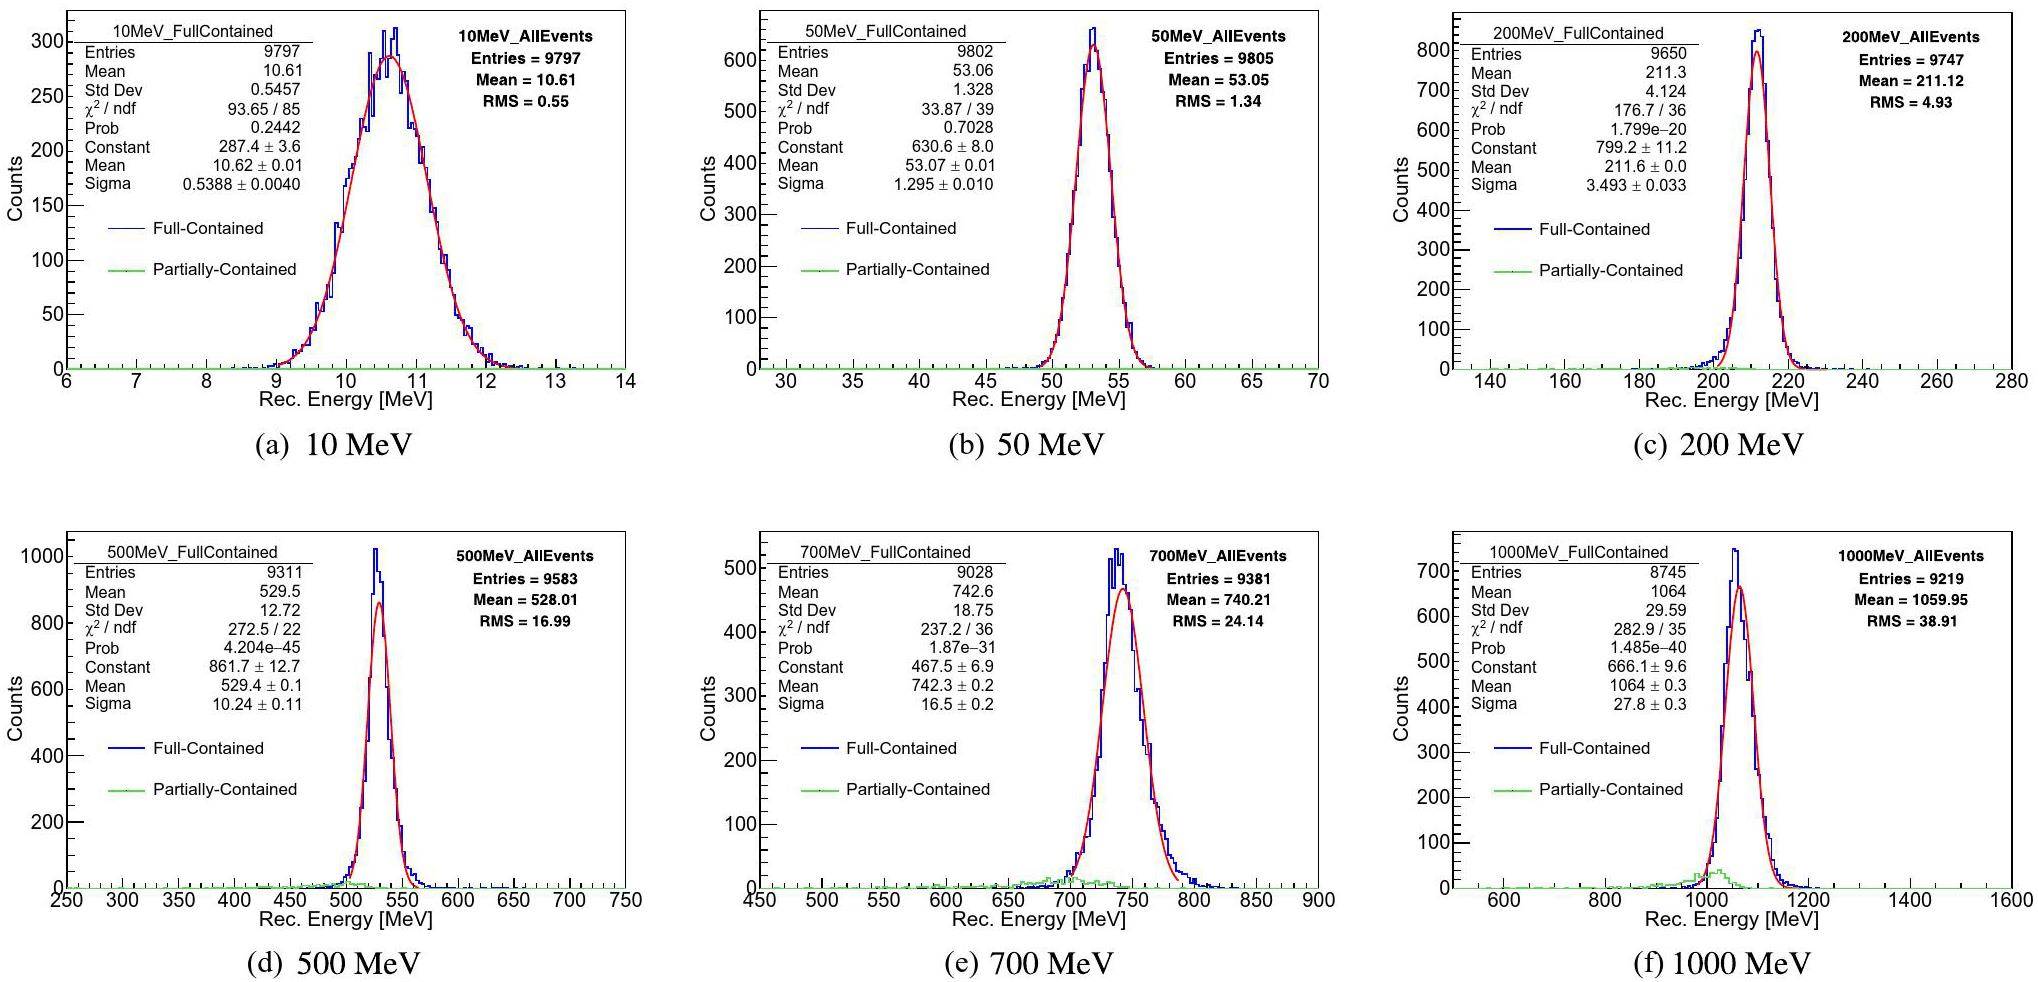
Next, the performance of energy reconstruction is introduced. The reconstructed energy spectra of the electrons with different kinetic energies are shown in Fig. 10. The blue spectra correspond to events whose energies were fully contained (FC) in the LS, whereas the green spectra correspond to events whose energies were partially contained (PC) in the LS. For electrons with energies greater than 500 MeV, the proportion of PC events increased, and the 16 m cut cannot completely exclude the case of energy leakage. The FC spectra could be fitted well with a Gaussian function, and the reconstructed energy was approximately 6% higher than the deposited energy of the electron. According to the official simulation in JUNO, when anchored at the 2.223 MeV gamma peak generated by (n,γ)H, high-energy electrons exhibit an energy nonlinearity of ~6% [64]. Thus, this deviation is understood to be mainly caused by the energy nonlinearity response of the LS. Conversely, the nonuniformity of the energy reconstruction may also introduce some small deviations, but generally, less than 1%, as shown in Fig. 11c.

To understand the non-uniformity shown in Fig. 11c, a and b can be compared, which corresponds to the cases using true energy-deposit center without/with electronic simulation and charge reconstruction. In Fig. 11a, for electron samples with different energies, the non-uniformity is consistent at about 0.5% from the center of the detector to the edge. After the electronic simulation and charge reconstruction (Fig. 11b, there is a slight increase in non-uniformity, but it still remains within 1.5%. Fig. 11c corresponds to the case using reconstructed energy-deposit center that shows deviation (Fig. 15, as a result, for 500 MeV and 1 GeV electrons, their energy non-uniform are about 2% and 3% at the edge. Furthermore, when PC events were included (Fig. 12, they mainly affected the non-uniformity of high-energy electrons located in the edge region.

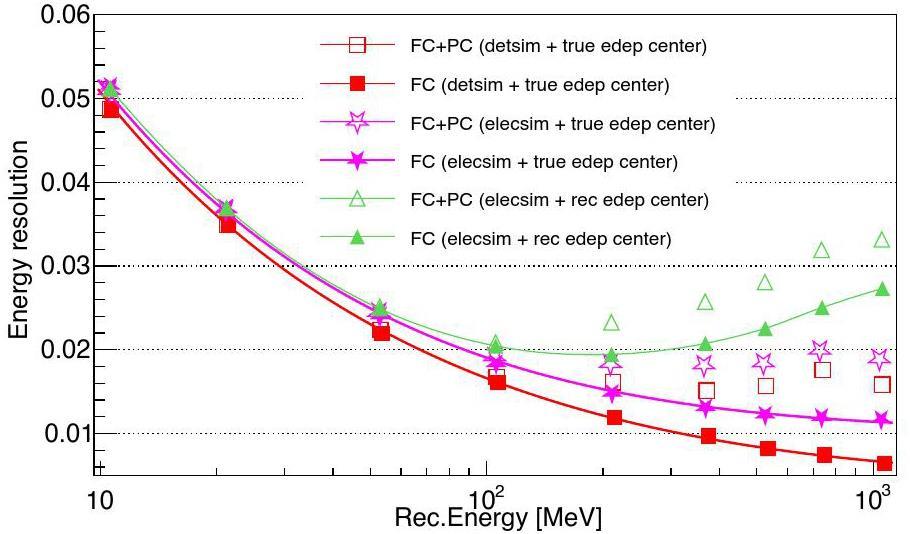
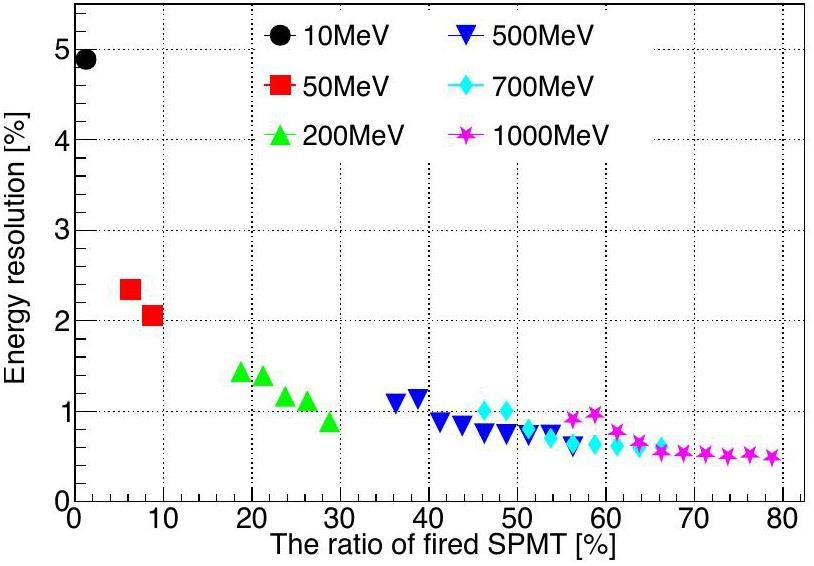
Figure 13 shows the energy resolution performance. The solid points correspond to the reconstruction results of the FC events, whereas the hollow points include both FC events and PC events. The red squares and pink stars denote the cases using the true energy-deposit center for energy reconstruction, whereas the green triangles denote the reconstructed energy-deposit center. In addition, electronic simulation, and charge reconstruction were applied to the reconstruction results shown by the pink stars and green triangles. Comparing energy resolutions in different conditions, it can be found that the energy reconstruction performance of the high-energy events is good using the OCCUPANCY strategy and the energy resolution is about 0.8% for 1 GeV electrons in the ideal case (red solid squares). In a more realistic situation, by including electronic simulation and charge reconstruction, the resolution is only approximately 0.3% worse, indicating that the correction works well in controlling the influence of the PMT dark count and threshold effect. From the comparison of solid points and hollow points, the PC events mainly affect the electrons whose kinetic energy is larger than 100 MeV, and their energy resolutions deteriorate by approximately 1%. In real detection, the reconstructed energy-deposit center is required for energy reconstruction, and its smearing introduces additional smearing on the reconstructed energy, especially for high-energy electrons. Consequently, the energy resolution was approximately 3.2% for 1 GeV electrons based on our algorithm. In Fig. 14, the relationship between the energy resolution and the fired ratio of the SPMT is investigated using an electron sample without electronics simulation, and a true energy-deposit center was applied. In general, a higher fired ratio of the SPMT corresponds to a better energy resolution. This indicates that our algorithm has the potential to be applied to higher energy events when the fired ratio of the SPMT is not close to 1 but must solve the problem of energy-deposit center reconstruction, which has a larger bias at higher energies.

To apply the algorithm to the experiment, we need to consider how to perform performance validation in the future, especially given the lack of calibration sources in the hundreds of MeV range, which is a common challenge in the validation of high-energy event reconstruction. First, we can select calibration samples in the tens of MeV range from the data for algorithm performance verification, such as 12B and Michel electrons. In addition, MC tuning is helpful for examining the various uncertainties that may arise from extrapolating low-energy events to high-energy events and estimating their potential impact.
Summary
Accurate energy reconstruction is crucial for detecting various physics events across a wide energy range, from MeV to GeV, in JUNO. This study proposes a unique method to reconstruct event energy using PMT counting technology, i.e., the OCCUPANCY method, which does not rely on precise charge measurements in a single PMT channel. Our reconstruction showed good performance in tests of the MC simulation samples. The energy nonuniformity can be controlled within 1% from the center of the detector to the edge for electrons with kinetic energies smaller than 500 MeV. As for 1 GeV electron, the energy nonuniformity can be controlled within 3%. The energy resolutions for 1 GeV electron FC events and FC+PC events were approximately 2.7% and 3.2%, respectively. This is the first demonstration of digital calorimetry using tens of thousands of PMTs in a large neutrino detector with potential applicability in current and future experiments employing similar detection techniques.
Observation of electron-antineutrino disappearance at Daya Bay
. Phys. Rev. Lett. 108,Indication of Reactor ν¯e Disappearance in the Double Chooz Experiment
. Phys. Rev. Lett. 108,Observation of reactor electron antineutrinos disappearance in the RENO experiment
. Phys. Rev. Lett. 108,Reactor on-off antineutrino measurement with KamLAND
. Phys. Rev. D 88,Neutrinos from the primary proton-proton fusion process in the Sun
. Nature 512, 383-386 (2014). https://doi.org/10.1038/nature13702A new design of large area MCP-PMT for the next generation neutrino experiment
. Nucl. Instrum. Meth. A 695, 113-117 (2012) https://doi.org/10.1016/j.nima.2011.12.085JUNO Physics and Detector
. Prog. Part. Nucl. Phys. 123,Double calorimetry system in JUNO
. Radiat. Detect. Technol. Methods 1, 21 (2017). https://doi.org/10.1007/s41605-017-0022-2The 3-inch Photomultiplier System of the JUNO Experiment
. PoS ICHEP2020, 203 (2021). https://doi.org/10.22323/1.390.0203Polarization and Entanglement in Baryon-Antibaryon Pair Production in Electron-Positron Annihilation
. Nature Phys. 15, 631-634 (2019). https://doi.org/10.1038/s41567-019-0494-8Oscillating features in the electromagnetic structure of the neutron
. Nature Phys. 17, 1200-1204 (2021). https://doi.org/10.1038/s41567-021-01345-6A new method of energy reconstruction for large spherical liquid scintillator detectors
. JINST 14,Improving the energy uniformity for large liquid scintillator detectors
. Nucl. Instrum. Meth. A 1001,Data-driven simultaneous vertex and energy reconstruction for large liquid scintillator detectors
. Nucl. Sci. Tech. 34, 83 (2023). https://doi.org/10.1007/s41365-023-01240-0Vertex and energy reconstruction in JUNO with machine learning methods
. Nucl. Instrum. Meth. A 1010,Improvement of machine learning-based vertex reconstruction for large liquid scintillator detectors with multiple types of PMTs
. Nucl. Sci. Tech. 33, 93 (2022). https://doi.org/10.1007/s41365-022-01078-yEnergy reconstruction for large liquid scintillator detectors with machine learning techniques: aggregated features approach
. Eur. Phys. J. C 82, 1021 (2022). https://doi.org/10.1140/epjc/s10052-022-11004-6Atmospheric neutrino spectrum reconstruction with JUNO
. PoS EPS-HEP2019, 041 (2020). https://doi.org/10.22323/1.364.0041JUNO sensitivity to low energy atmospheric neutrino spectra
. Eur. Phys. J. C 81, 10 (2021). https://doi.org/10.1140/epjc/s10052-021-09565-zFirst attempt of directionality reconstruction for atmospheric neutrinos in a large homogeneous liquid scintillator detector
. Phys. Rev. D 109,[JUNO], Reconstruction of atmospheric neutrino events at JUNO
. PoS ICHEP2022, 1114 (2022). https://doi.org/10.22323/1.414.1114Reconstruction of atmospheric neutrinos in JUNO
. PoS ICRC2023, 1189 (2023). https://doi.org/10.22323/1.444.1189Neutrino physics with JUNO
. J. Phys. G 43,Prospects for detecting the diffuse supernova neutrino background with JUNO
. JCAP 10, 033 (2022). https://doi.org/10.1088/1475-7516/2022/10/033JUNO Sensitivity on Proton Decay p→ν¯K+ Searches
. Chin. Phys. C 47,Muon reconstruction with a geometrical model in JUNO
. JINST 13,Muon Tracking with the fastest light in the JUNO Central Detector
. Radiat. Detect. Technol. Methods 2, 13 (2018). https://doi.org/10.1007/s41605-018-0040-8Muon reconstruction with a convolutional neural network in the JUNO detector
. Radiat. Detect. Technol. Methods 5, 364-372 (2021). https://doi.org/10.1007/s41605-021-00259-4Reconstruction of a muon bundle in the JUNO central detector
. Nucl. Sci. Tech. 33, 59 (2022). https://doi.org/10.1007/s41365-022-01049-3JUNO conceptual design report
. https://doi.org/10.48550/arXiv.1508.07166Sub-percent precision measurement of neutrino oscillation parameters with JUNO
. Chin. Phys. C 46,The Flash ADC system and PMT waveform reconstruction for the Daya Bay Experiment
. Nucl. Instrum. Meth. A 895, 48-55 (2018). https://doi.org/10.1016/j.nima.2018.03.061A high precision calibration of the nonlinear energy response at Daya Bay
. Nucl. Instrum. Meth. A 940, 230-242 (2019). https://doi.org/10.1016/j.nima.2019.06.031Performance of CATIROC: ASIC for smart readout of large photomultiplier arrays
. JINST 12,CATIROC: an integrated chip for neutrino experiments using photomultiplier tubes
. JINST 16,Design and development of JUNO event data model
. Chin. Phys. C 41,GDML based geometry management system for offline software in JUNO
. Nucl. Instrum. Meth. A 908, 43-48 (2018). https://doi.org/10.1016/j.nima.2018.08.008DAQ readout prototype for JUNO
. Radiat. Detect. Technol. Methods 5, 600–608 (2021). https://doi.org/10.1007/s41605-021-00290-5A method for sharing dynamic geometry information in studies on liquid-based detectors
. Nucl. Sci. Tech. 32, 21 (2021). https://doi.org/10.1007/s41365-021-00852-8Simulation software of the JUNO experiment
. Eur. Phys. J. C 83, 382 (2023). https://doi.org/10.1140/epjc/s10052-023-11514-x[GEANT4], GEANT4–a simulation toolkit
. Nucl. Instrum. Meth. A 506, 250-303 (2003). https://doi.org/10.1016/S0168-9002(03)01368-8Geant4 developments and applications
. IEEE Trans. Nucl. Sci. 53, 270 (2006). https://doi.org/10.1109/TNS.2006.869826Recent developments in Geant4
. Nucl. Instrum. Meth. A 835, 186-225 (2016). https://doi.org/10.1016/j.nima.2016.06.125SNiPER: an offline software framework for non-collider physics experiments
. J. Phys. Conf. Ser. 664,Rayleigh scattering of linear alkylbenzene in large liquid scintillator detectors
. Rev. Sci. Instrum. 86,Attenuation length measurements of a liquid scintillator with LabVIEW and reliability evaluation of the device
. Chin. Phys. C 37,Using monochromatic light to measure attenuation length of liquid scintillator solvent LAB
. Nucl. Sci. Tech. 30, 30 (2019). https://doi.org/10.1007/s41365-019-0542-1Optical scattering lengths in large liquid-scintillator neutrino detectors
. Rev. Sci. Instrum. 81,A complete optical model for liquid-scintillator detectors
. Nucl. Instrum. Meth. A 967,Measurement of the fluorescence quantum yield of bis-MSB
. Chin. Phys. C 39,Light propagation and fluorescence quantum yields in liquid scintillators
. JINST 10,Scintillation decay time and pulse shape discrimination in oxygenated and deoxygenated solutions of linear alkylbenzene for the SNO+ experiment
. Nucl. Instrum. Meth. A 640, 119-122 (2011). https://doi.org/10.1016/j.nima.2011.03.027Characterization of 3-inch photomultiplier tubes for the JUNO central detector
. Radiat. Detect. Technol. Methods 3, 6 (2019). https://doi.org/10.1007/s41605-018-0085-8Mass production and characterization of 3-inch PMTs for the JUNO experiment
. Nucl. Instrum. Meth. A 1005,Performance evaluation of the 8-inch MCP-PMT for Jinping Neutrino Experiment
. Nucl. Instrum. Meth. A 1055,Calibration Strategy of the JUNO Experiment
. JHEP 03, 004 (2021). https://doi.org/10.1007/JHEP03(2021)004Low-radioactivity ultrasonic hydrophone used in positioning system for Jiangmen Underground Neutrino Observatory
. Nucl. Sci. Tech. 33, 76 (2022). https://doi.org/10.1007/s41365-022-01059-1Activity measurement of 55Fe using the liquid scintillation TDCR method
. Nuclear Techniques (in Chinese) 46,ROOT: An object oriented data analysis framework
. Nucl. Instrum. Meth. A 389, 81-86 (1997). https://doi.org/10.1016/S0168-9002(97)00048-XMinuit: A system for function minimization and analysis of the parameter errors and correlations
. Comput. Phys. Commun. 10, 343-367 (1975). https://doi.org/10.1016/0010-4655(75)90039-9Developments of mathematical software libraries for the LHC experiments
. IEEE Trans. Nucl. Sci. 52, 2818-2822 (2005). https://doi.org/10.1109/TNS.2005.860152Event vertex and time reconstruction in large-volume liquid scintillator detectors
. Nucl. Sci. Tech. 32, 49 (2021). https://doi.org/10.1007/s41365-021-00885-zA universal energy response model for determining the energy nonlinearity and resolution of e± and γ in liquid scintillator detectors
. Eur. Phys. J. C 83, 403 (2023). https://doi.org/10.1140/epjc/s10052-023-11541-8The authors declare that they have no competing interests.

