Introduction
The charge-exchange reaction, a type of direct nuclear reaction, serves as a valuable experimental tool for exploring the intricate structure of atomic nuclei, particularly through the lens of spin-isospin excitation [1, 2]. Reactions such as (3He,t), (t,3He), and (d,2He) are widely employed in charge-exchange studies due to their high resolution and detection efficiency [3-7]. On the theoretical side, the Distorted Wave Born Approximation (DWBA) is a commonly used theoretical framework for analyzing reaction cross sections. Furthermore, a research group at Peking University developed an improved Eikonal method, achieving better agreement with experimental data across a wide energy range [8, 9]. Experimentally, charge-exchange reactions such as (3He,t) and (t,3He) have been studied for various nuclei using 3He and triton beams produced by accelerators. For instance, researchers at the Institute of Modern Physics measured the Gamow-Teller strength distribution of the odd-mass nucleus 93Nb using a triton beam at 115 MeV/u from the Coupled Cyclotron Facility (CCF) at the National Superconducting Cyclotron Laboratory (NSCL) [10]. Exclusive measurements of the 59Co(t,3He+γ)59Fe reaction enabled the first determination of Gamow-Teller strengths from low-lying states in 59Fe to its ground state 59Co [11]. These experimental efforts have yielded significant insights in nuclear astrophysics, particularly in understanding the late stages of core-collapse supernovae. Additionally, charge-exchange reactions are pivotal in the study of nuclear structures, including isospin excitations, giant resonances, β-decay, and the neutron skin thickness of nuclei. However, experimental studies of the charge exchange reaction have largely been limited to stable nuclides due to current experimental constraints. Hence, conducting charge exchange reaction experiments on unstable nuclides in inverse kinematics remains challenging but is a promising research frontier. For the first time, a research team at Michigan State University successfully extracted the Gamow-Teller transition strength, B(GT), in the β+ direction from an unstable nucleus using the (d,2He) reaction in inverse kinematics. This milestone was achieved through the combined use of an active-target time projection chamber (AT-TPC) and a magnetic spectrometer, providing a robust solution for conducting inverse kinematics experiments [12, 13].
The Heavy Ion Research Facility in Lanzhou (HIRFL) is a prominent nuclear physics experimental facility in China, hosting numerous groundbreaking experiments. A research group from Beihang University measured charge-changing cross-sections of exotic nuclei at the Radioactive Ion Beam Line in Lanzhou (RIBLL) to extract charge radii and investigate the structure of exotic nuclei [14, 15]. Researchers from the Institute of Modern Physics successfully measured cross-sections for single-neutron removal, two-neutron removal, and one-proton knockout reactions on a carbon target at a beam energy of approximately 240 MeV/u at the External Target Facility (ETF) [16-18]. Additionally, the breakup reaction of 9Li on a Pb target at 32.7 MeV/u was measured for the first time at RIBLL by researchers from the Institute of Modern Physics and Lanzhou University [19].Given these achievements, the HIRFL is expected to play a crucial role in advancing charge-exchange reaction research [20]. One such application involves (3He,t) charge-exchange reaction experiments in inverse kinematics, where a 3He target is bombarded with a radioactive beam generated by the HIRFL to study unstable neutron-rich nuclides. To explore the feasibility of (3He,t) experiments in inverse kinematics using a heavy-ion beam, we designed and constructed a detection system for large-angle scattering tritons (t). The detection system is based on a ΔE–E telescope configuration, where the ΔE detector is a semi-cylindrical time projection chamber (scTPC), and the E detector is a CsI(Tl) array [21]. The CsI(Tl) array offers excellent energy detection capabilities, facilitating efficient particle identification [22].
The time projection chamber (TPC) is a versatile detector capable of accurately measuring the scattering angle θ of secondary particles by reconstructing three-dimensional tracks and providing precise energy measurements [23]. Consequently, TPCs have been extensively utilized in nuclear physics experiments [24-31]. For instance, researchers at Peking University developed a compact active-target time projection chamber (CAT-TPC) to investigate resonant scattering related to cluster structures in unstable nuclei, achieving an angular resolution of approximately 0.45 degree [27, 28]. To meet the demands of the cooling storage ring external-target experiment (CEE), a TPC prototype was designed and tested using pulsed ultraviolet laser beams. Testing demonstrated excellent performance in both track and energy resolution [29]. In addition, the High-energy Fragment Separator (HFRS), currently under construction, incorporates multiple sets of position-sensitive twin TPC detectors for particle identification and beam monitoring [30]. Similarly, a multipurpose time projection chamber (MTPC) has been developed to measure cross-sections of neutron-induced nuclear reactions at the back-streaming white neutron facility (Back-n) of the China Spallation Neutron Source [31].
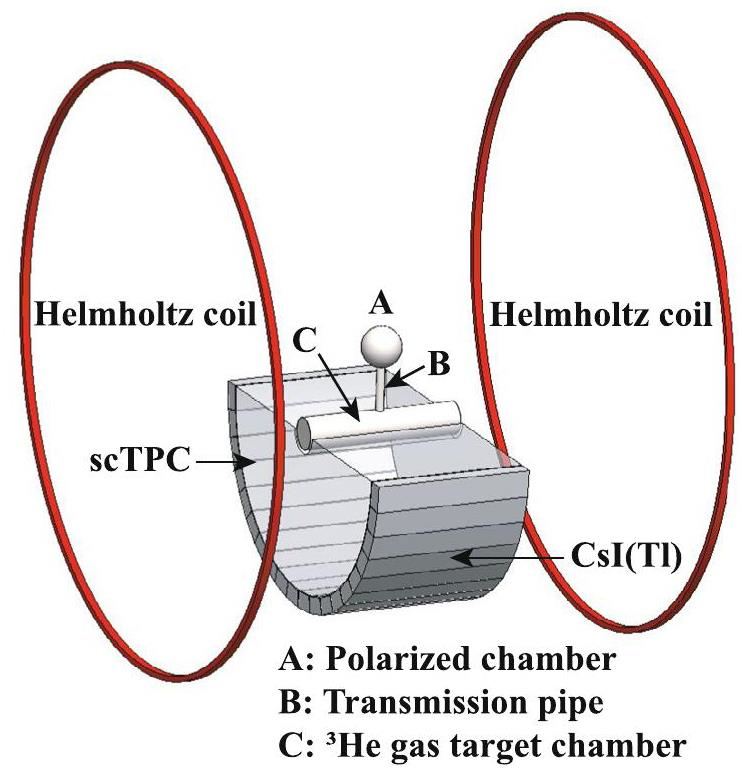
The semicylindrical detector design was chosen to reserve space for future heavy-ion nuclear reaction experiments utilizing a polarized 3He target. The nuclei in 3He gas can be polarized (aligned in the same spin direction) through a spin-exchange optical pumping (SEOP) process [32]. In this setup, the polarized 3He target is bombarded by an intermediate- or high-energy heavy-ion beam, enabling the selection of specific coupling terms and providing insight into the spin-related components of nuclear interactions [33]. Experiments in inverse kinematics further extend the range of atomic nuclei that can be studied. The polarized 3He target is based on a design similar to the 3He glass cell developed at Lanzhou University [34], featuring a spherical glass chamber above the target tube, constructed from aluminosilicate (GE180) glass, as shown in Fig. 1. During the polarization process, 3He gas is polarized in the spherical chamber and then transported through a transmission pipe into the cylindrical target chamber.To maintain polarizability, a magnetic field of approximately 50 G is applied to the 3He target using Helmholtz coils. This field also extends to the TPC, but the low field strength ensures a negligible effect on charged particle tracking. Hence, a semi-cylindrical structure considering these factors must be implemented. However, we initially plan to perform experiments with a non-polarized 3He target. Hence, the employed target is a non-polarized, as described in Sect. 3.6.
This study focused on evaluating the performance of the scTPC component of the detector. The assessment was conducted using a combination of radioactive sources, UV lasers, cosmic-ray muons, and heavy-ion beams. First, the energy resolution and gain inhomogeneity of the THGEM were tested using a 55Fe X-ray source, which provided a normalized gain correction factor for each channel. Subsequently, the drift velocity of electrons in the scTPC was calibrated using both laser signals and cosmic rays, with the results from these two methods showing good agreement. Track reconstruction for cosmic-ray and beam tests was performed using a recognition algorithm based on the Hough transform. The position resolution of cosmic-ray tracks was also measured. In later tests, the heavy-ion beam was directed at the 3He target, and the secondary charged particles produced in the collision were detected using the scTPC. Their tracks were reconstructed to determine both position and angular resolutions. The structure of the detector is outlined in Sect. 2, while the performance test results are presented in Sect. 3. A summary of the findings is provided in Sect. 4.
Experimental setup
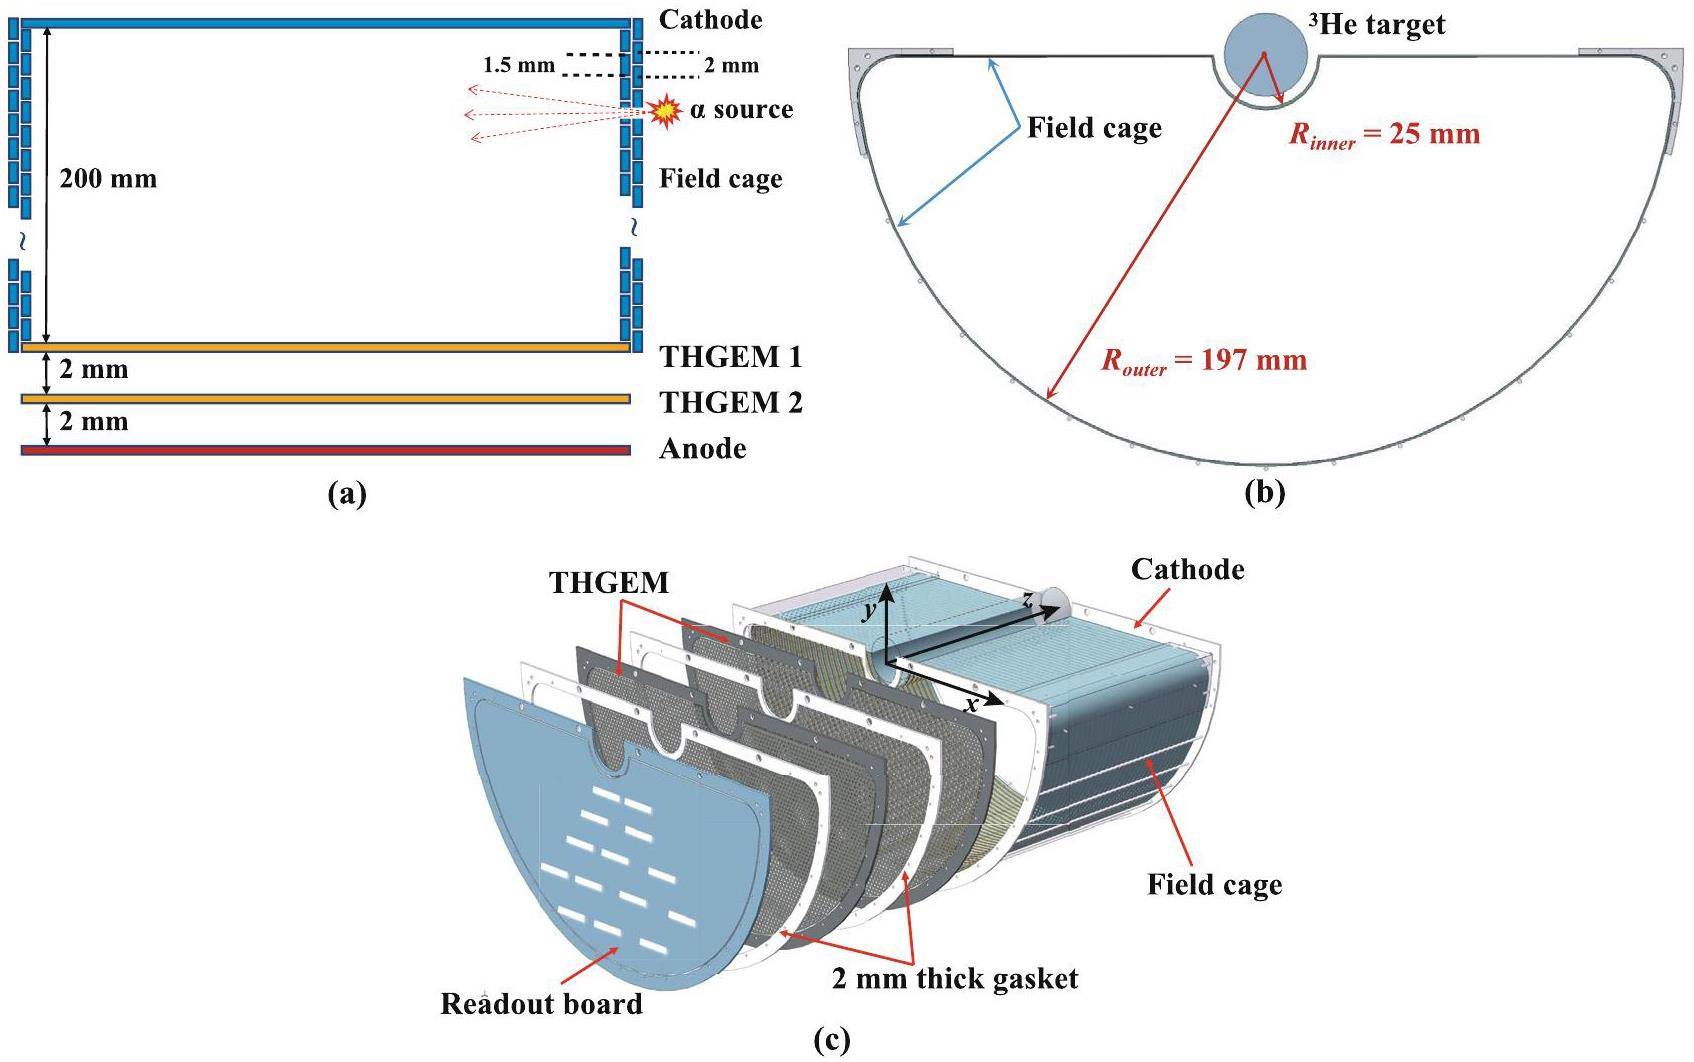
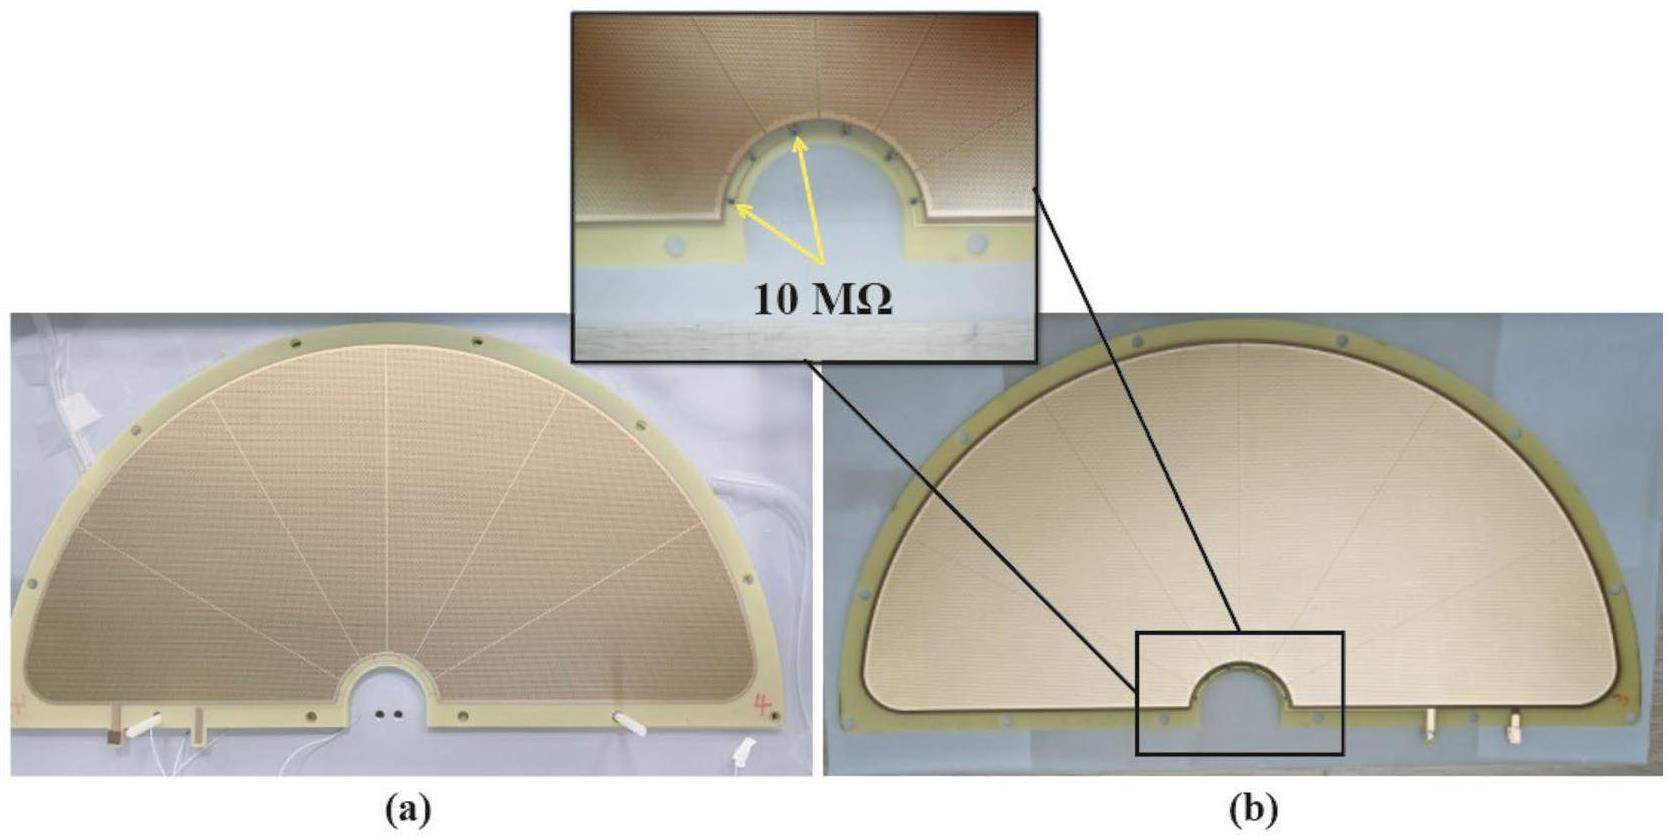
The TPC section of the detector (refer to Refs. [21] for a comprehensive description of the detector construction), as shown in Fig. 2, consists of a cathode board, a field cage, two layers of THGEM films, and a readout electrode. The detailed scTPC parameters are listed in Table 1. The cathode is a single-sided copper-coated PCB (printed circuit board). The field cage is a semi-cylindrical structure, with an inner radius of 25 mm and an outer radius of 197 mm, made from a flexible PCB. Uniformly distributed copper-coated electrode strips are present on both sides of the PCB. Each electrode strip has a width of 1.5 mm, with a 2 mm pitch between the centers of adjacent strips. The voltage gradient in the field cage is supplied by a voltage divider circuit consisting of 198 1 MΩ series resistors. The amplification structure consists of a double-layer THGEM [35, 36], with high voltage supplied by a voltage-divider circuit, as shown in Fig. 3. To limit the total charge during discharge [37], one side of the THGEM is partitioned into six fan-shaped segments, with a 1 mm gap between adjacent segments, as illustrated in Fig. 4. Each segment is connected to a common high-voltage distribution via a 10 MΩ resistor, ensuring that the potential of each segment remains consistent. THGEM 1 has a partitioned side on the lower surface, while THGEM 2 has a partitioned side on the upper surface. The readout electrode consists of 886 zigzag-shaped pads [38], each measuring 7.29 mm in the vertical direction and 3.43 mm in the horizontal direction. The readout electronics and data-acquisition systems for the scTPC are based on ASICs for General Electronics for TPC (AGET) chips [39, 40].A gas mixture of Ar-iC4H10 is commonly used in THGEM tests [41, 42] due to its high gain and fast drift velocity. For the THGEM-based scTPC, a gas mixture of Ar-iC4H10 (95:5) [42] was selected as the operating gas.
| Items | Parameters |
|---|---|
| Operating gas | Ar (95%) + iC4H10 (5%) |
| Gas pressure (mbar) | 850 |
| Maximum drift length (mm) | 200 |
| Length of transfer region (mm) | 2 |
| Length of induced region (mm) | 2 |
| Inner radius of field cage (mm) | 25 |
| Outer radius of field cage (mm) | 197 |
| Width of field cage electrode strip (mm) | 1.5 |
| Pitch of field cage electrode strips (mm) | 2 |
| Height of Zigzag-shaped pad (mm) | 7.29 |
| Wifth of Zigzag-shaped pad (mm) | 3.43 |
| Total number of effective pads | 886 |
| Drift electric field (V/(cm atm)) | 200 |
| THGEM 1 voltage (V) | 650 |
| THGEM 2 voltage (V) | 600 |

Performance test
Waveform Fit
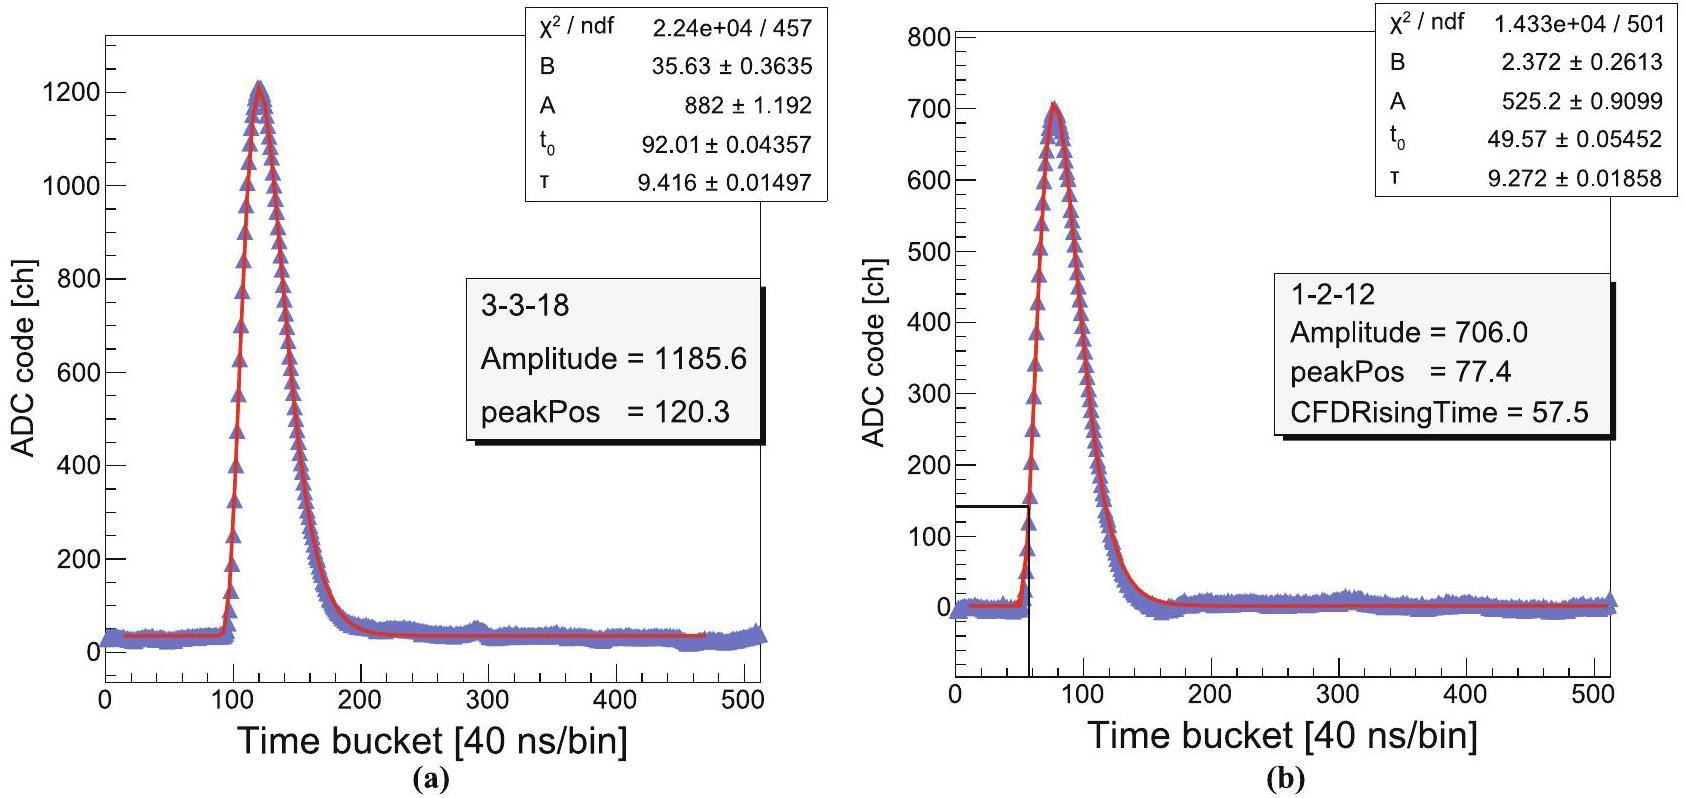
The AGET output waveform has an asymmetric shape, as shown in Fig. 5. A fitting function is used to fit the waveform to extract information from the signal waveform, mainly temporal (e.g., peak position) and amplitude information. The waveform is fitted using the following function [31]:
X-ray test
The field cage was temporarily removed for the 55Fe source test. The voltage divider circuit for the THGEM power supply remained consistent with those used in other tests, as shown in Fig. 3. The cathode consisted of a 25 μm thick double aluminized Mylar film, and the 55Fe source was placed outside the drift region, directly in front of the cathode film. The length of the drift region was 4 mm.
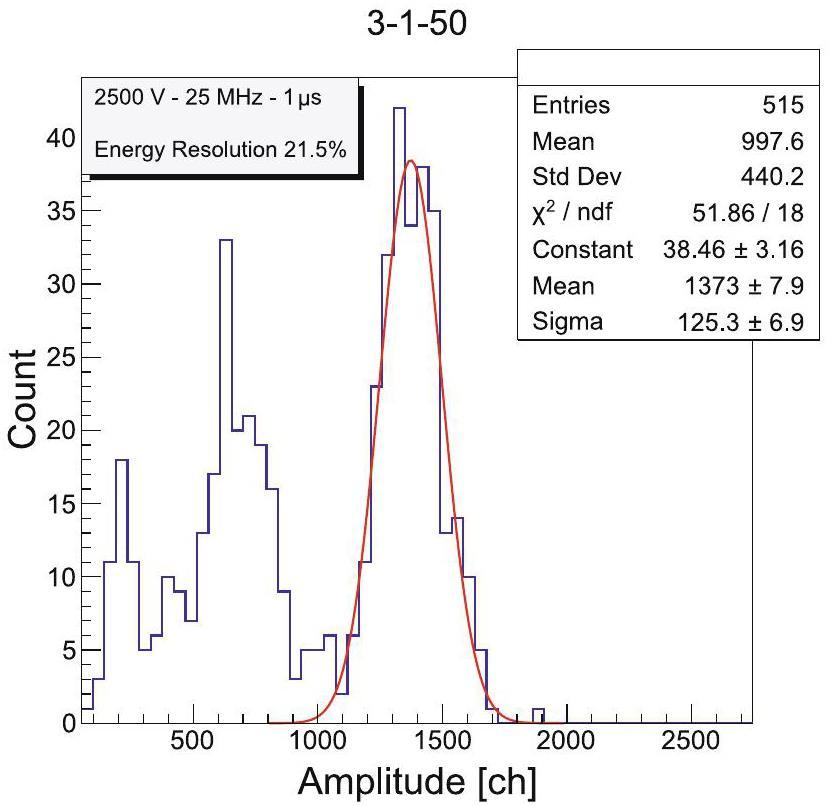
X-rays deposit their entire energy at a single point in the operating gas, resulting in a small electron cloud produced by single X-ray photon ionization. This typically generates a signal on one or two pads. Different positions on the THGEM were irradiated using the X-ray source. By selecting events in which only one pad was triggered, we reconstructed the energy deposition spectrum generated by the X-rays on each pad, as shown in Fig. 6. In the spectrum, the full-energy peak and the Ar escape peak of the X-ray are clearly visible. The escape peak is located at half the energy of the full-energy peak. Due to the small drift region, annihilation photons were more likely to escape from the sensitive region of the TPC, resulting in a higher count in the escape peak. The voltage of the cathode was set to 2400 V. With a THGEM operating voltage of -2500 V (-663 V for THGEM 1 and -612 V for THGEM 2), a sampling frequency of 25 MHz, and a shaping time of 1 μs, the scTPC achieved an energy resolution (FWHM) of approximately 22% for the 5.9 keV X-ray.
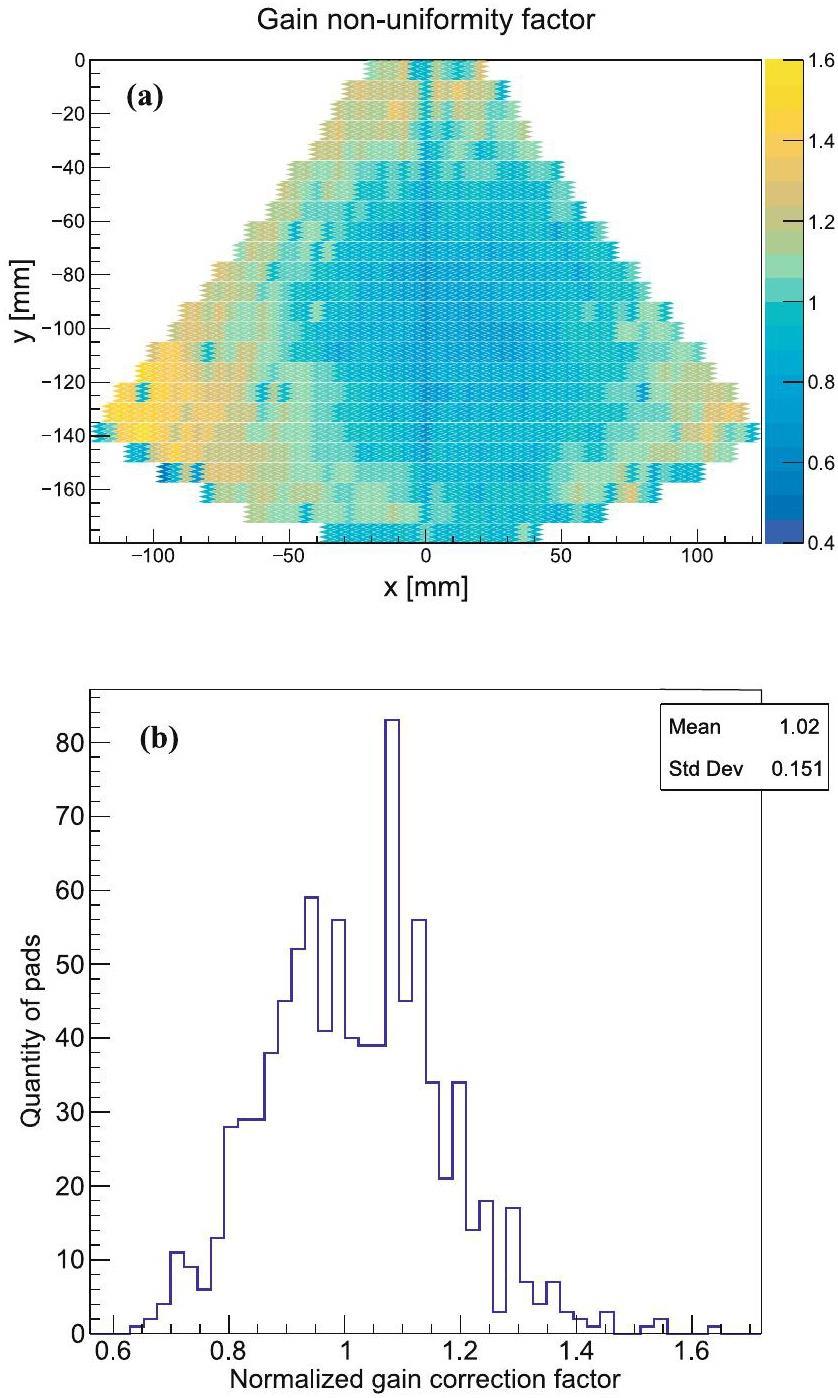
Due to factors such as the manufacturing process of the THGEM, detector assembly, readout electrode collection efficiency, transmission of the electronics, and data acquisition system, gain nonuniformity may occur across different channels. To characterize this nonuniformity, the full-energy peak position in the X-ray energy spectrum for each pad can be extracted. By normalizing the peak positions of all channels, the fluctuations between the channels can be calibrated, as shown in Fig. 7(a). The gain fluctuations across the readout plane reveal that the gain was relatively low for the central electrodes and high for the peripheral electrodes. This discrepancy may be due to differences in the tension experienced by the peripheral and central electrodes during the THGEM manufacturing process and detector assembly. When processing charged particle events, the normalized gain correction factors derived from the X-ray test, as shown in Fig. 7(b), can be applied in the data analysis to partially correct for the degradation in energy measurement caused by channel fluctuations.
Drift velocity
The drift velocity of electrons in the scTPC drift region is crucial for the reconstruction of three-dimensional tracks of charged particles. Two methods were adopted to measure the drift velocity: The first method used a 266 nm UV laser. The laser beam was split into two beams through a half-lens (50% transmissive and 50% reflective). These two laser beams entered the drift region of the scTPC through two collimating holes (approximately 1 mm in diameter) on the inner wall of the field cage, and the drift velocity was calculated from the time difference between the two laser beams. Although attempts were made to keep both laser beams parallel to the readout plane, this was still difficult to achieve. There is still an angle between the two laser beams. Therefore, we extrapolated the two laser tracks back to their respective vertices (i.e., the positions of the two collimating holes). The distance between collimating holes was 16 cm. At each of the two collimating hole locations, there was a distinct and pronounced peak in the drift time, as shown in Fig. 8(a). The drift velocity was calculated based on the time difference between collimating holes. The measured drift velocity was 3.95 cm/μs under an electric field of 200 V/(cm atm) in an Ar(95%)+iC4H10(5%) gas mixture.
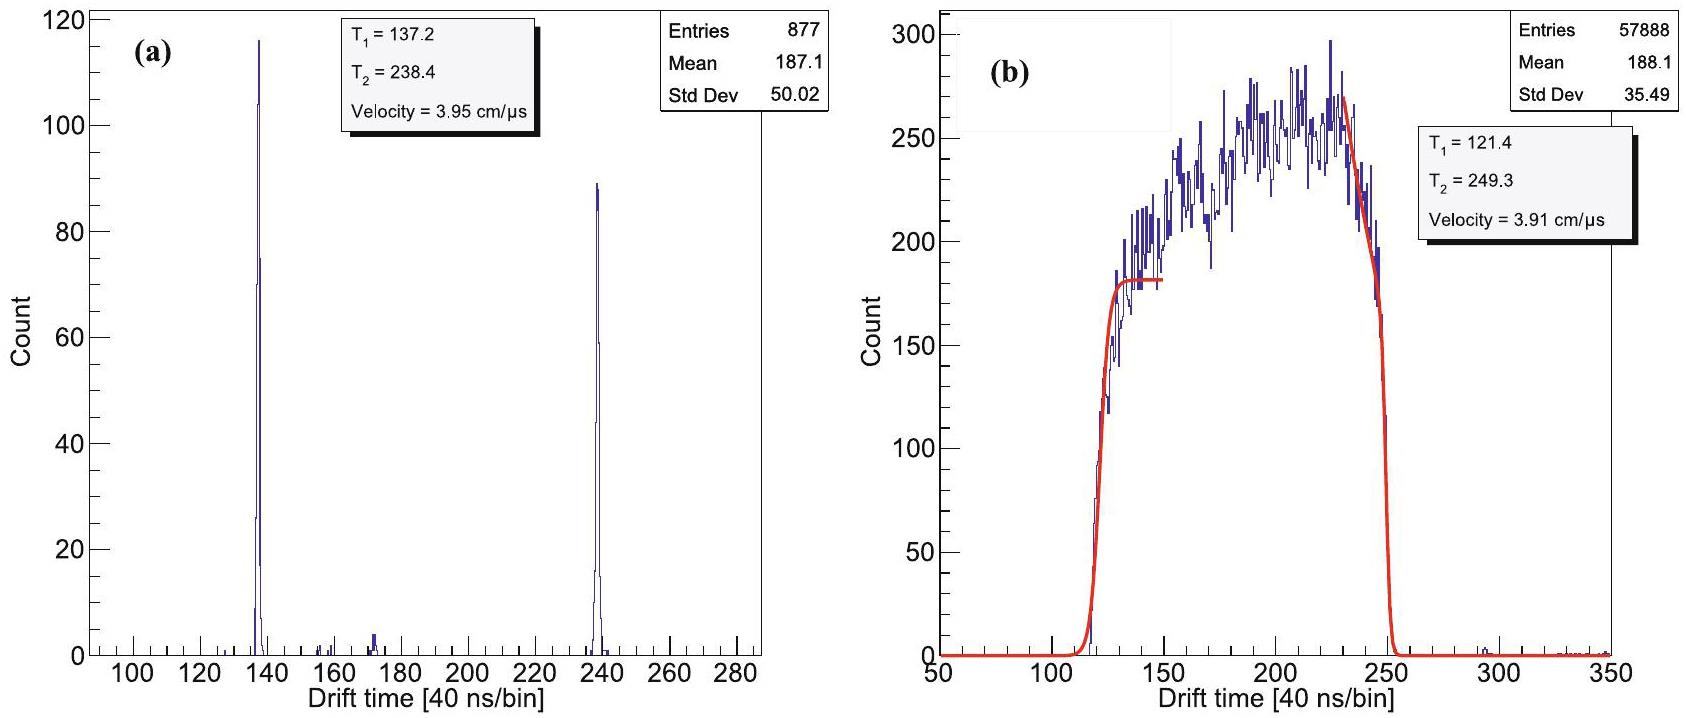
The second method utilizes cosmic-ray muons to calculate drift velocity. There were no strict restrictions on the direction of the cosmic rays, which could pass through the scTPC from any position within the drift region. A 20 cm × 20 cm plastic scintillator was placed on the top side of the scTPC to serve as a trigger and provide a common zero time for all cosmic-ray events. This setup allowed for the extraction of the time distribution in the drift direction for all cosmic-ray tracks, as shown in Fig. 8(b). The drift time exhibited a platform-like distribution, with steep leading and trailing edges indicating the closest point (infinitely close to the upper surface of THGEM 1) and the farthest point (infinitely close to the cathode surface) from the upper surface of THGEM 1, respectively. The leading and trailing edges were fitted using the following edge functions [43]:
The equipment for measuring drift velocity using a laser is complex and only provides the drift velocity at a specific position. In contrast, the method using cosmic rays offers a simpler setup for characterizing the average drift velocity. Since a flow-type gaseous chamber is used, the gas pressure in the chamber fluctuates with the external air pressure, and the purity of the operating gas may vary. Consequently, calibration of the electron drift velocity is essential for each test and experiment. Using cosmic rays, real-time measurement of the drift velocity can be performed easily and quickly.
Track reconstruction
The particle track is three-dimensional and can be projected onto the xy-plane and zy-plane. The x-axis is aligned with the pad row, and the y-axis is aligned with the pad column, as shown in Figs. 2(c) and 7(a). The z-axis represents the direction of the drift electric field, opposite to the drift direction of the electron and perpendicular to the readout plane. The xy-plane is parallel to the readout plane, while the zy-plane is perpendicular to it. A pad with a detected signal is classified as a hit, with the x- and y-coordinates of the hit corresponding to the geometric center of the pad in the horizontal and vertical directions, respectively. All hits in the same row are grouped into a cluster. The y-coordinates of the cluster are defined as the y-coordinates of the row, while the x-coordinates are the average of the x-coordinates of all hits, weighted by the deposited charge (i.e., Amplitude). The z-coordinates of the hits are calculated by multiplying the drift time by the drift velocity, which is 3.91 cm/μs as determined in Sect. 3.3. The drift time is calculated from the leading edge of the signal waveform relative to the zero-th time bucket, i.e., CFDRisingTime as shown in Fig. 5(b). Since the drift time is not an absolute value, it must be referenced to a common zero point. The z-coordinate of the cluster is the average of the z-coordinates of all hits, weighted by the Amplitude. The reconstructed track is a straight line that fits through a series of clusters.
The track resolution consists of the spatial resolution on the xy-plane (referred to as x-resolution) and the spatial resolution on the zy-plane (referred to as z-resolution). The spatial resolution was evaluated using the residuals, which represent the distance from the charge center of the cluster to the fitted track line. For example, in the xy-plane,
Cosmic ray test
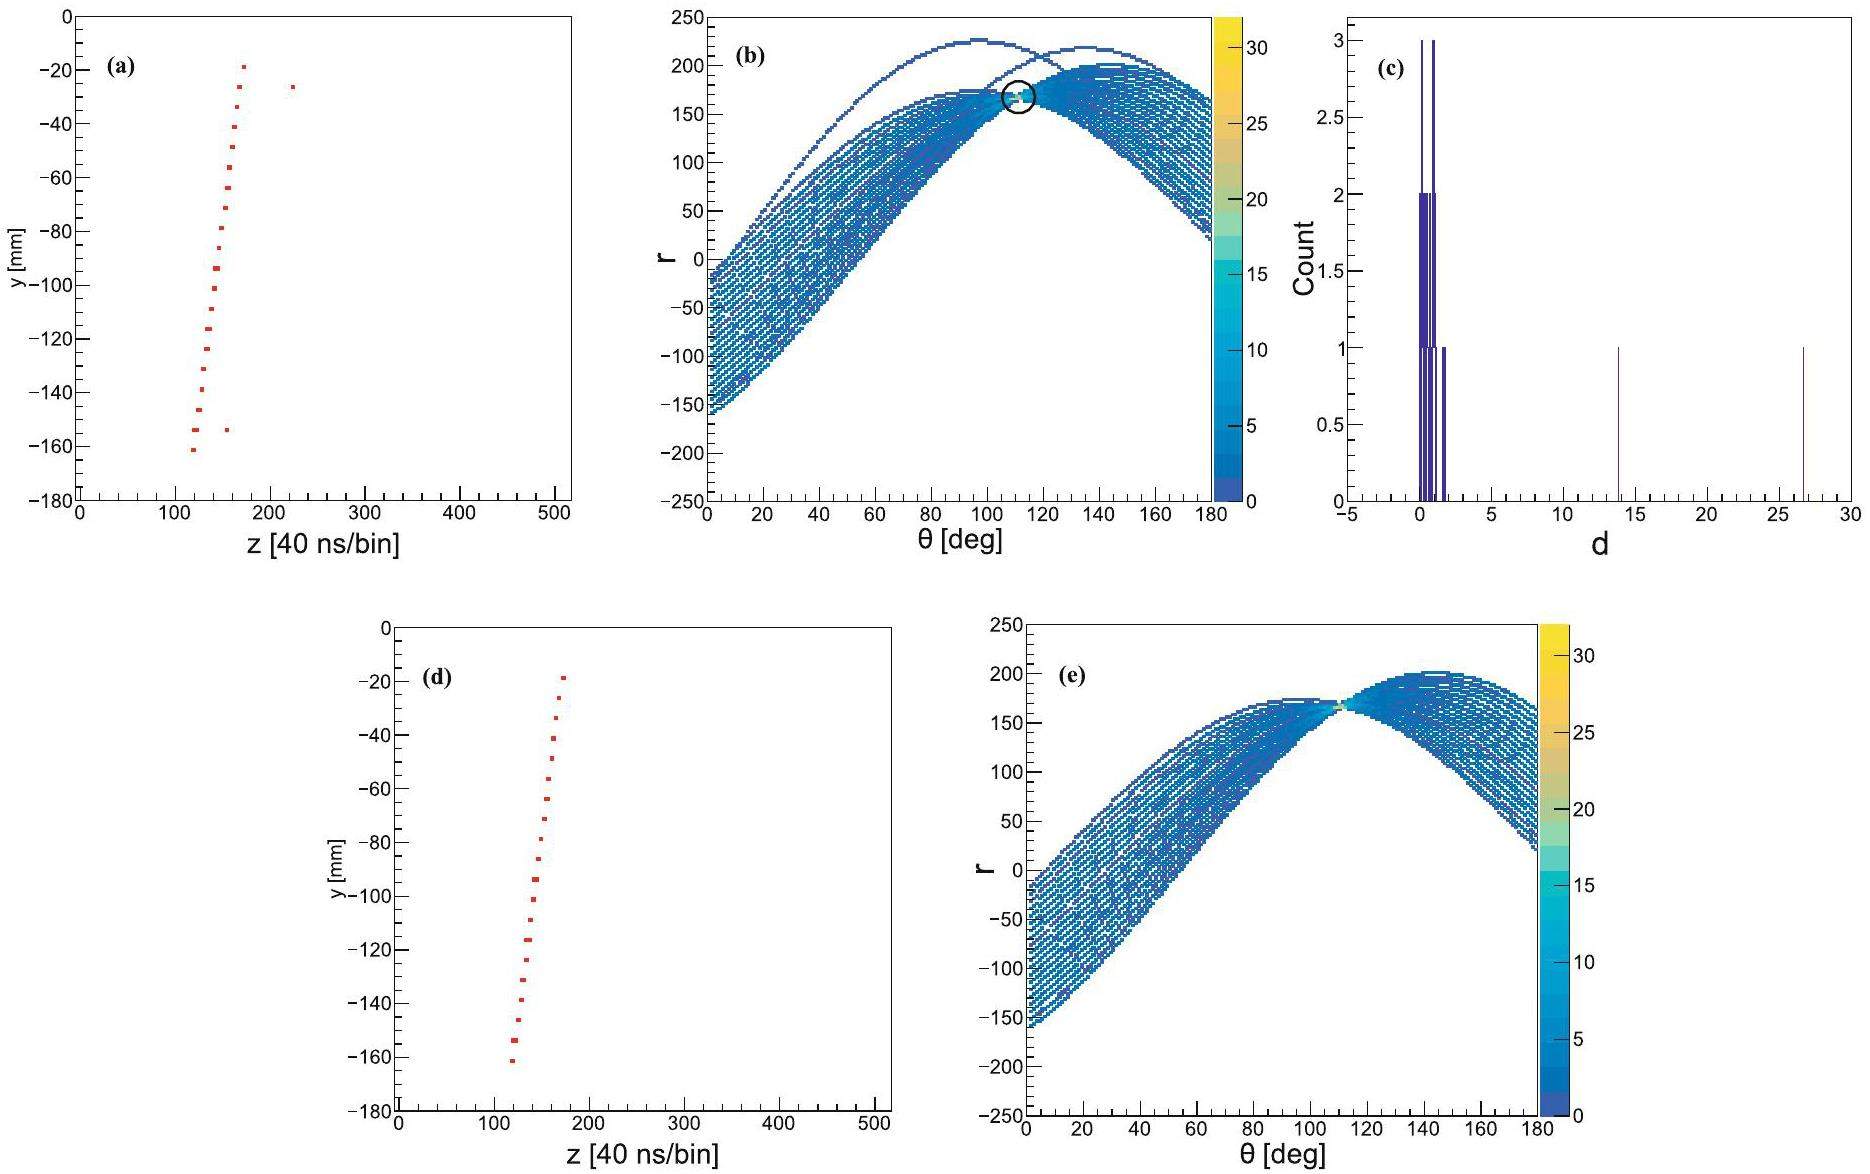
Cosmic ray muons traverse the scTPC in stochastic directions and positions, enabling a comprehensive assessment of the overall performance of the scTPC. The energy deposition from cosmic rays within the scTPC is low, leading to a suboptimal signal-to-noise ratio. As a result, higher amplification is necessary to clearly detect the cosmic ray track. This amplification may cause unrelated hits to accompany the muon track, resulting in positional inaccuracies (Fig. 9(a)). Additionally, due to the large size of the plastic scintillators, there are instances when multiple tracks are detected within the same sampling time window, though such occurrences are rare. Therefore, track recognition must be performed prior to track reconstruction [46-51]. To address this challenge, we employ the Hough transform for track recognition and derive a flag value ddd in the Hough space to distinguish between effective and ineffective hits [52, 53]. A hit with a d value within a specific range is considered effective, and the judgment condition is determined by analyzing the ddd-distribution of multiple tracks. The Hough transform has been widely applied and extended to particle track recognition due to its simple and intuitive transformation method. The particle under investigation in our future experiments exhibits characteristics similar to cosmic rays, specifically long tracks that penetrate the TPC, with typically only one track present per event. In such cases, the classical Hough transform is effective for recognizing and reconstructing secondary particle tracks. The original coordinate system (x,y,z) (in Euclidean space) is consistent with the coordinate system defined in Sect. 3.4 and Fig. 2 (c).
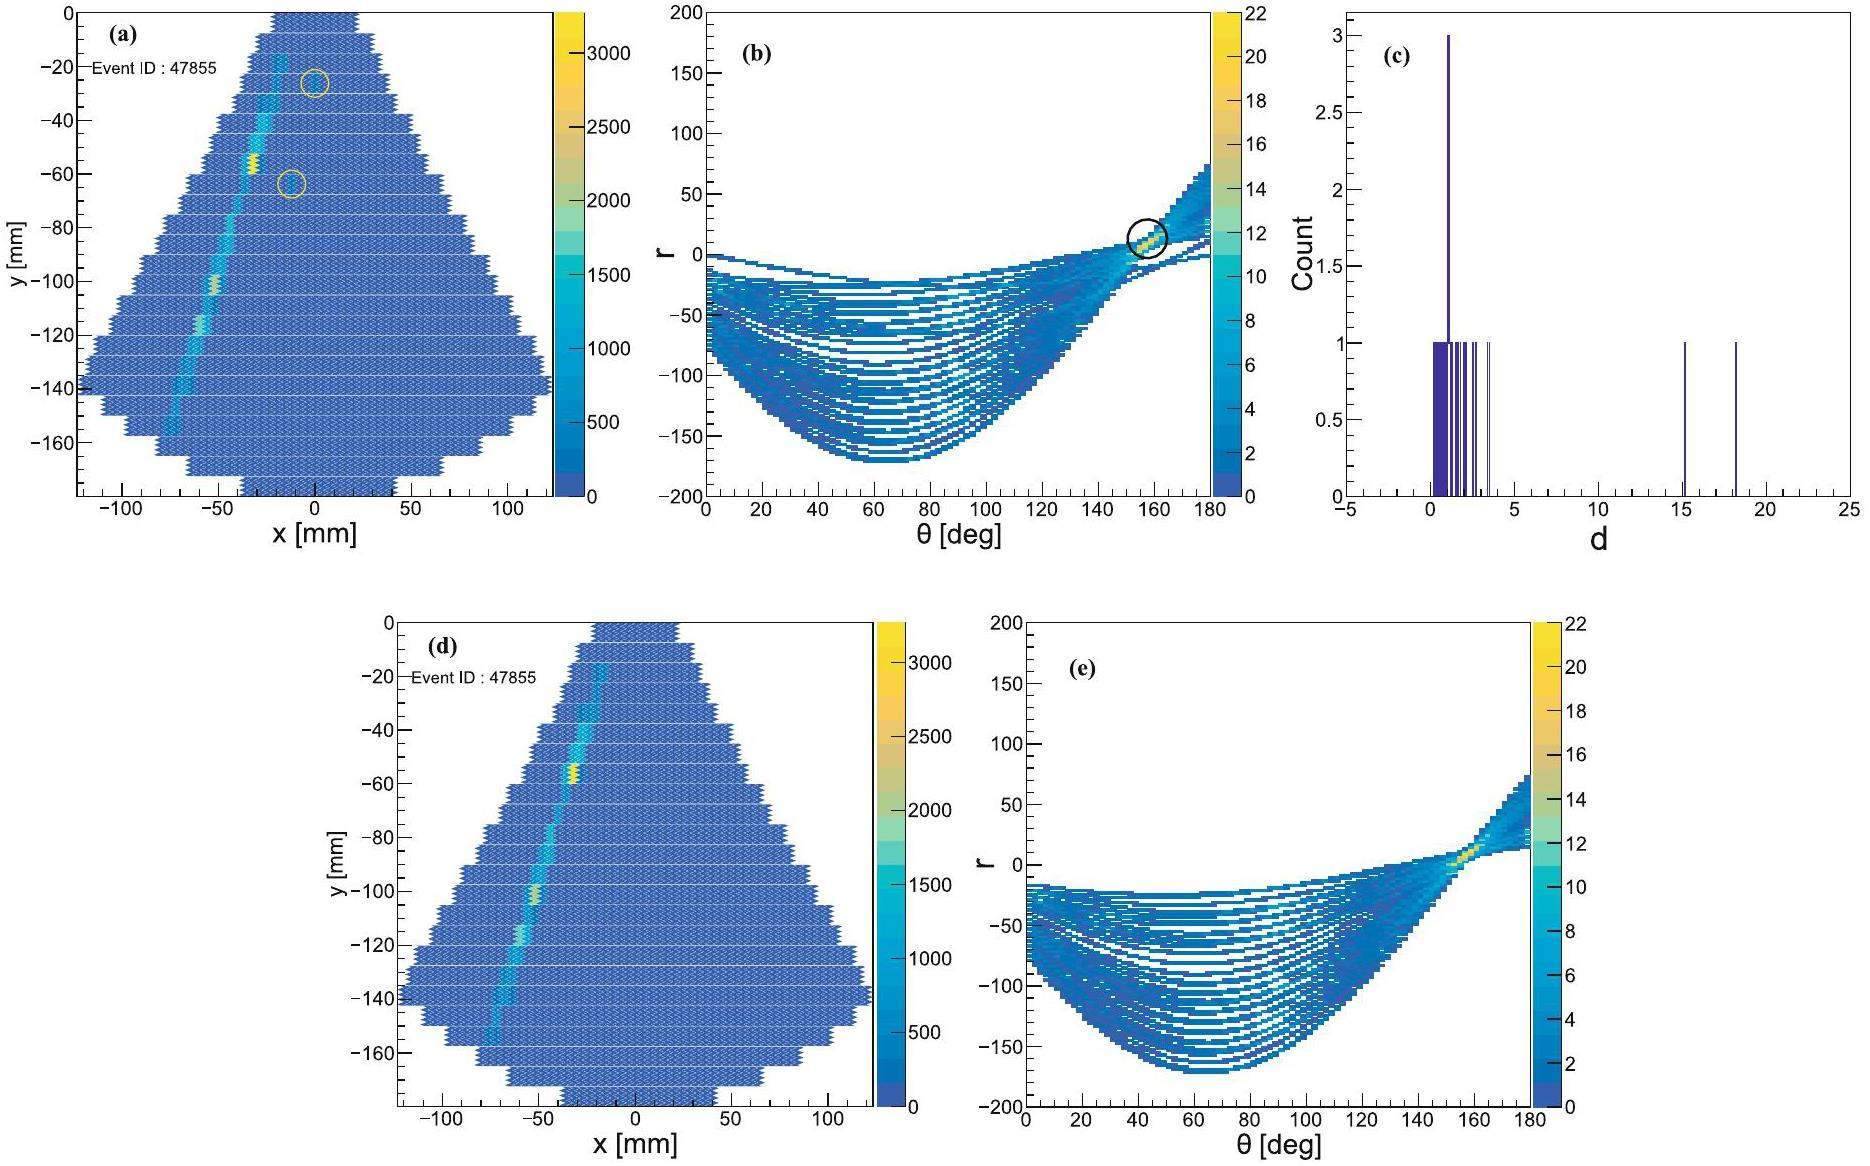
The (x,y) coordinates of hits in Euclidean space are first transformed into Hough space, where a point in Euclidean space corresponds to a curve in the Hough space. When multiple hits lie along the same linear track, their corresponding curves in Hough space intersect at a common point. In contrast, the Hough curves of ineffective hits located away from the track do not converge at this common point, as shown in Fig. 9(a) and (b). The coordinates of the common point in Hough space, (θxy,com, rxy,com), were determined, and the minimum distance dxy from each Hough curve to the common point was calculated. For a point on the track, its dxy value should be nearly equal to or slightly greater than zero, while the dxy value of a stray point will be larger, as illustrated in Fig. 9(c). After comparing across multiple tracks, points with dxy≤4.0 are considered effective hits, while those with dxy > 4.0 are deemed ineffective. After applying this dxy discrimination, stray hits can be rejected, and track recognition can be successfully achieved on the xy-plane, as shown in Fig. 9(d) and (e). Note that this threshold may require adjustment depending on the detector design and the complexity of events involving multiple tracks.
Track recognition on the zy-plane using the Hough transform follows a similar approach. The (z,y) coordinates of the hits in Euclidean space are transformed into Hough space, as shown in Fig. 10. The coordinates of the common point in Hough space, (θzy,com, rzy,com), are determined, and the minimum distance dzy from each Hough curve to the common point is calculated. On the zy-plane, points with
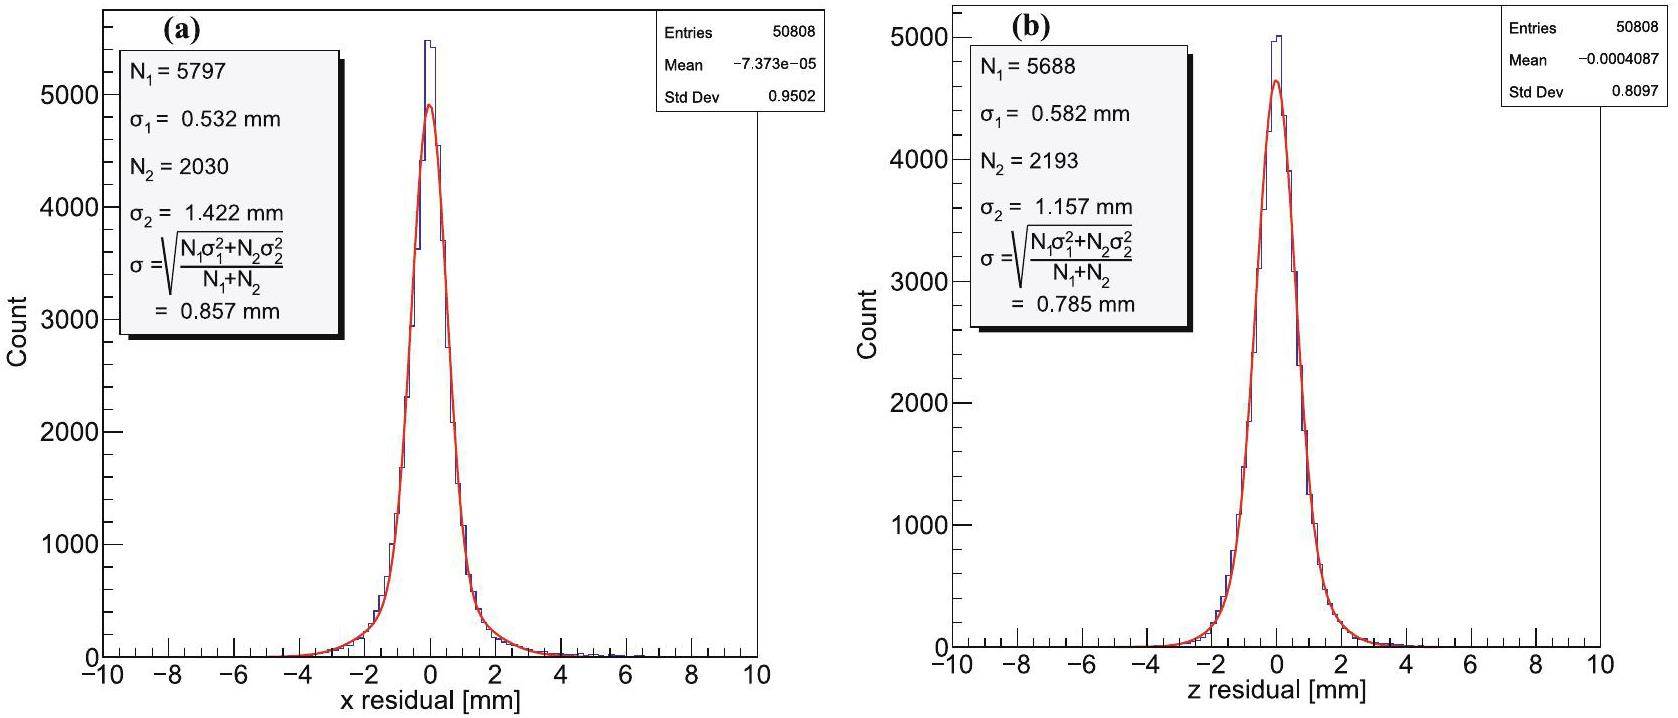
With the discrimination by dxy and dzy based on the Hough transform, stray hits are discarded. The residual distributions on the xy-plane and zy-plane were then extracted to observe the x and z-resolutions of the cosmic ray track, as shown in Fig. 11. The residual distribution did not follow a standard Gaussian function. Therefore, we fit the residual distribution with the sum of two Gaussian functions, both with means close to zero. The fitting function [54] is expressed as:
Beam test
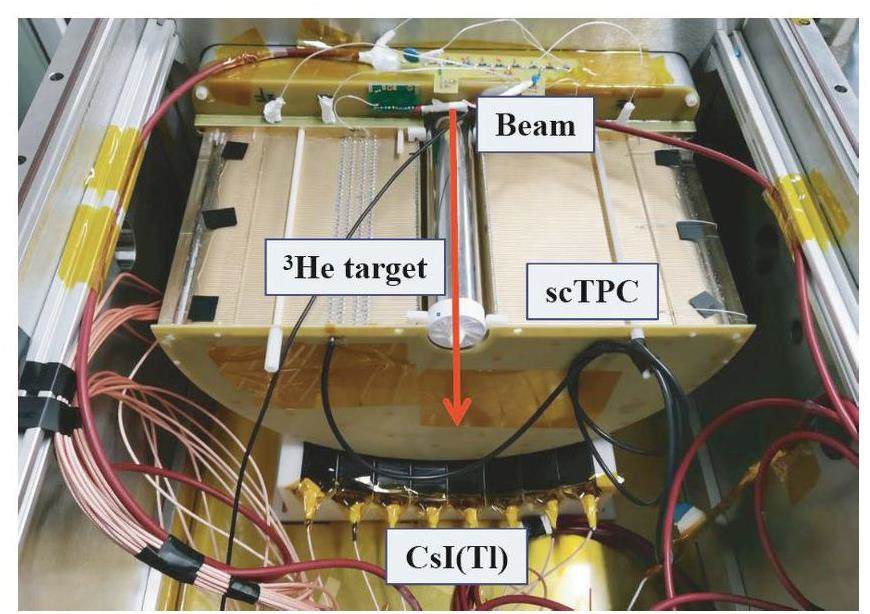
To validate the functionality of the scTPC in the presence of a heavy-ion beam background, a beam test was conducted at the HIRFL. The detector was fully assembled, as shown in Fig. 12. A nonpolarized 3He gas target, encapsulated in a sealed stainless-steel container with three atmospheres of 3He gas (providing an effective target thickness of approximately 2.2 × 10²¹ atoms/cm2), was positioned at the center of the scTPC. The cylindrical stainless-steel container measured 20 cm in length and 3.8 cm in diameter, with a sidewall thickness of 200 μm (i.e., the exit window for secondary particles was 200 μm thick). The two end faces of the container, each 2 mm thick, served as the incoming and outgoing windows for the beam. Given that the beam energy is high but the intensity is low, the energy loss in the beam windows is minimal compared to the total energy of the beam, rendering the heating power negligible. The target was placed on a 3D-printed holder to ensure that its center axis was aligned with the center of the beam. The heavy-ion beam did not pass through the TPC but instead passed through the 3He target. Large-angle scattering of secondary particles penetrated the sidewall of the stainless-steel container and entered the scTPC. The detector was housed in a stainless-steel chamber. The beam used was a 350 MeV/u Kr beam with an intensity of approximately 106 particles per second. The beam entered the chamber through a 25 μm thick window made of aluminized Mylar film with a 40 mm diameter. It then passed through a second 25 μm thick window of aluminized Mylar film, this time with a 55 mm diameter, before exiting the chamber. Eight CsI(Tl) crystals, each with a thickness of 2 cm and a length of 20 cm, were positioned in a curved array around the scTPC outside. The signals from the CsI(Tl) crystals were sequentially extracted, amplified, and discriminated using a preamplifier (Mesytec MPR-16) and a shaping/timing filter amplifier (Mesytec MSCF-16). After an OR operation, the signals from the eight crystals were converted into TTL signals to trigger the AGET. Consequently, the scTPC signal recorded by the AGET corresponds to the long track traversing the scTPC and the energy deposited in the CsI(Tl) crystals.
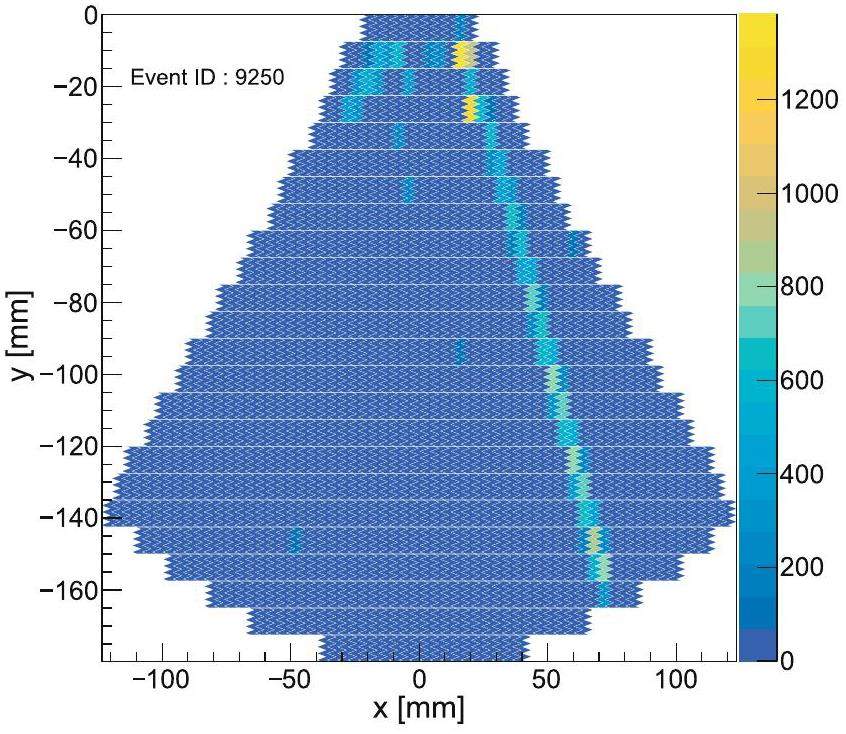
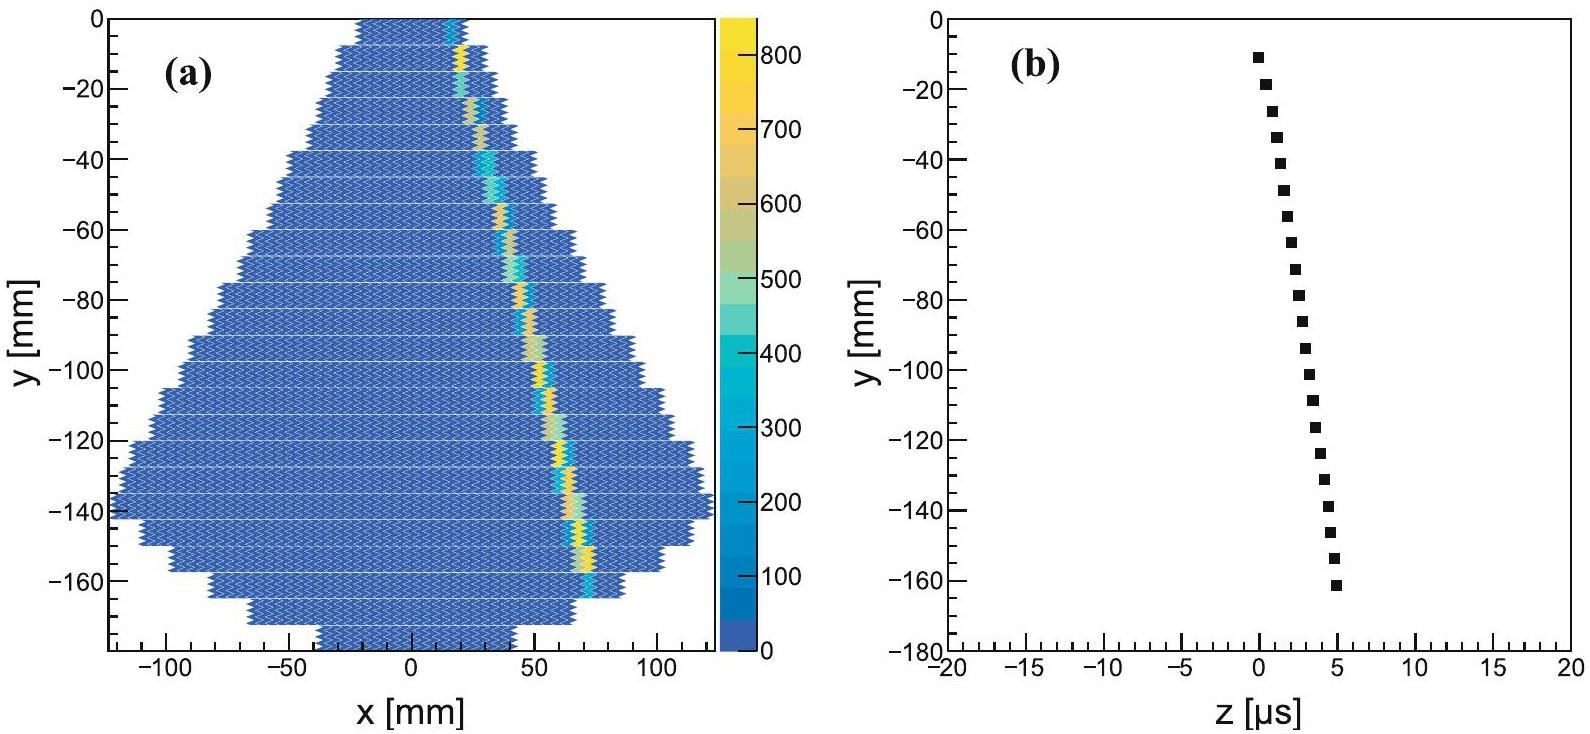
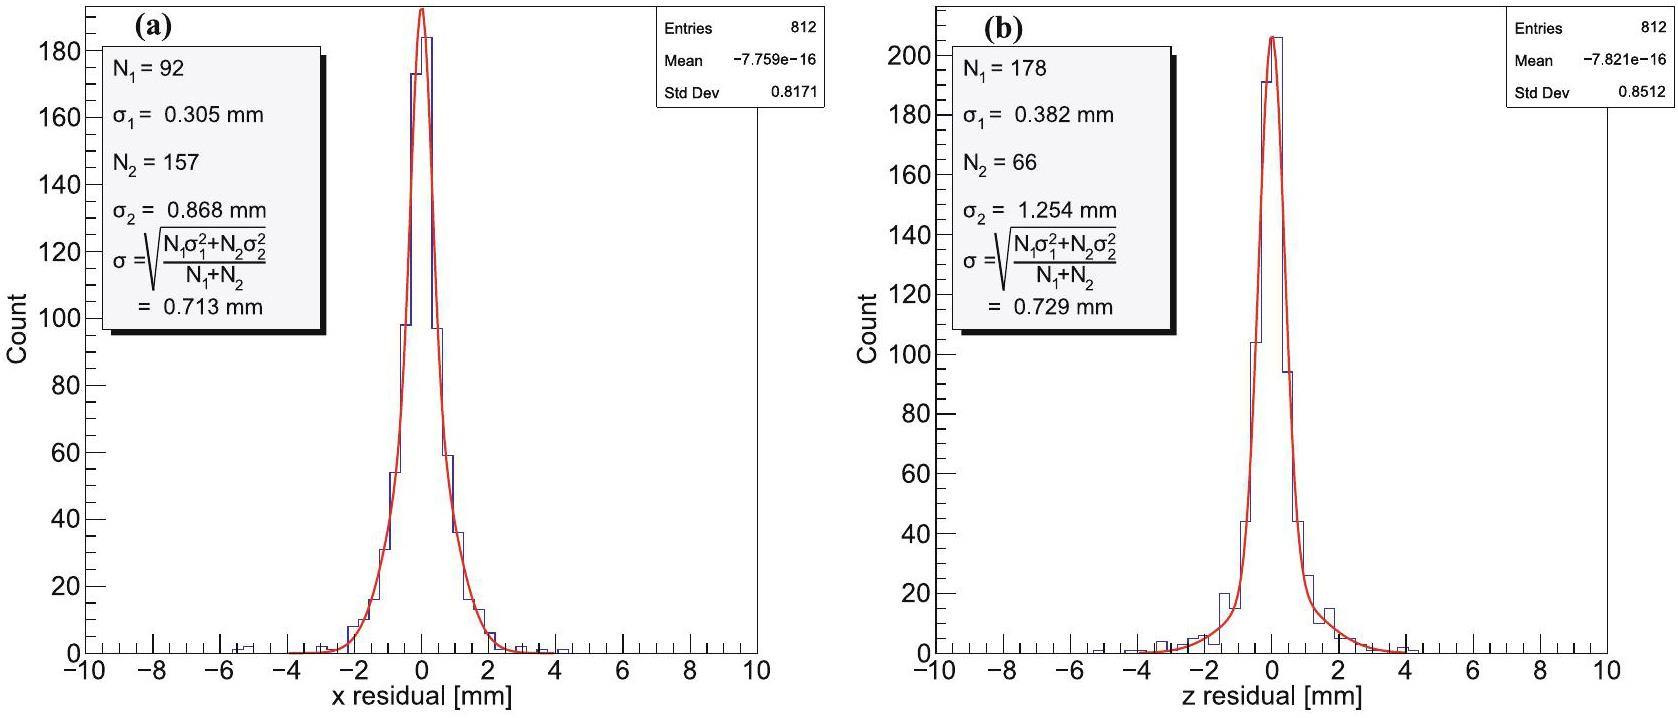
As shown in Fig. 13, the track is often accompanied by a number of background particles, primarily distributed in the upper part of the readout electrode (near the target). Therefore, track recognition is crucial for the data analysis of beam tests. Track recognition based on the Hough transform is used to reconstruct the particle track, as shown in Fig. 14, with dxy≤4.0 and dzy≤2.0, consistent with the cosmic ray track. The residual distribution of secondary particle tracks was fitted using a double-Gaussian function, as shown in Fig. 15, resulting in x- and z-resolutions of 0.71 mm and 0.73 mm, respectively, for the beam test. These results are consistent with the cosmic ray test outcomes. The angular resolution of the scattering angle, θ, can reach 0.2°. Good angular resolution is essential for establishing a precise relationship between the scattering angle and the differential cross section in the center-of-mass system, particularly for specific points in the cross section, such as local maxima or minima. The detailed shape of the angular distribution aids in better extrapolation of measurements to small-angle scattering regions and reduces extrapolation errors. Due to limitations such as the duration of the beam test, the triton could not be identified. However, the test successfully verified the operation of the detector. First, the scTPC operated normally without discharging under the high background environment caused by the heavy-ion beam and maintained sufficient performance. Second, the CsI(Tl) signal was used to trigger the AGET and effectively detect secondary particle tracks.
A Kr-beam experiment was performed to validate the performance of the detector. We were interested in C and O isotopes instead of Kr. Although small-angle scattering near 0° in the center-of-mass frame provides more detailed information on the transition dynamics and nuclear structure, detecting tritons is technically challenging because the kinetic energy of a triton approaches zero in the laboratory frame at this angle range. Consequently, nuclear reaction experiments were designed to measure the recoiled triton with a relatively large kinetic energy in inverse kinematics. Then, combined with the angular distribution of the reaction cross section calculated theoretically, the data for the small-angle range were extrapolated from the measured result to the greatest extent possible. According to the Geant4 simulation [21], the current detector system can measure triton with Et,lab > 20 MeV and
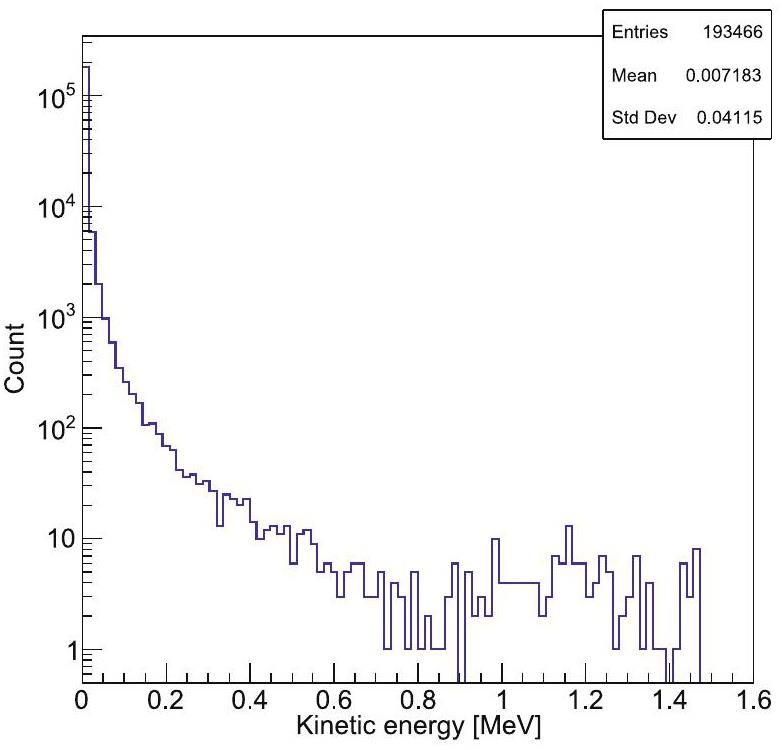
The background from δ electrons must be considered for control and veto in beam experiments. The maximum kinetic energy that can be transferred in a single collision is limited and depends on the kinetic energy of the incident particle. For an incident nucleus with a kinetic energy of 500 MeV/u, the calculated maximum kinetic energy of the δ electron is approximately 1.4 MeV. The results from Geant4 simulations (Fig. 16 and kinematic calculations are in good agreement. As the kinetic energy of the δ electron increases, its generation probability decreases. The vast majority of δ electrons will not enter the TPC, as they are blocked by the 3He target sidewall and the scTPC field cage structure. Those δ electrons that do enter the sensitive region of the detector can be rejected by the CsI(Tl) because they cannot trigger the CsI(Tl). In addition, δ electrons either do not enter the scintillators, or the energy they deposit in the scintillators is generally below the trigger threshold.
According to theoretical calculations (see the preprint [55]), for a 20O beam with an intensity of 106 particles per second, the yield rate of our charge exchange reaction (transition between isobaric analog states) is approximately 10 particles per hour in three atmospheres of 3He gas. To achieve the statistical precision required for the experiment (over 1000 counts), approximately 100 hours of beam time were needed to accumulate the data.
Summary
This study focuses on the performance of the scTPC. The energy resolution and gain non-uniformity of the THGEM were tested using a 55Fe X-ray source. The drift velocity of the electrons was measured using both a laser and cosmic ray muons. At a reduced electric field of 200 V/(cm·atm), the drift velocity was 3.95 cm/μs from the laser test and 3.91 cm/μs from the cosmic ray test. The position resolution of the long track was measured using cosmic rays and heavy-ion beams. For the cosmic ray tracks, the position resolution was 0.86 mm on the xy-plane and 0.79 mm on the zy-plane, resulting in an angular resolution better than 0.2°. In the heavy-ion beam test, the beam bombarded the 3He target, and secondary charged particles were measured with the scTPC. For the secondary particles, the position resolution was 0.71 mm on the xy-plane and 0.73 mm on the zy-plane, yielding an angular resolution better than 0.2°. The performance of the scTPC meets the requirements for measuring the product particles of the (3He,t) reaction and supports the next stage of the experiment.
Nuclear structure of the spin-isospin excited states in 13N studied via the (3He,t) and (3He,tp) reactions at 450 MeV
. Phys. Rev. C 69,Nuclear astrophysics research based on HI-13 tandem accelerator
. Nucl. Tech. 46(8), 080002-1 (2023). https://doi.org/10.11889/j.0253-3219.2023.hjs.46.080002High resolution studies of low lying GT strength using the (d,2He) reaction and its impact on electron-capture rates in stellar environments
. Nucl. Phys. A 719, C131-C134 (2003). https://doi.org/10.1016/S0375-9474(03)00982-5Extraction of weak transition strengths via the (3He,t) reaction at 420 MeV
. Phys. Rev. Lett. 99(20),Charge Exchange Spin-Dipole Excitations of 90Zr and the Neutron Skin Thickness
. Nucl. Phys. A 788, 273 (2007). https://doi.org/10.1016/j.nuclphysa.2007.01.013Gamow–Teller Strength Extraction from (3He,t) Reactions
. Nucl. Phys. A 916, 219 (2013). https://doi.org/10.1016/j.nuclphysa.2013.08.006Single-Charge Exchange Reactions and the Neutron Density at the Surface of the Nucleus
. Phys. Rev. C 96,Improved eikonal approach for charge exchange reactions at intermediate energies
. Chin. Phys. C 43,Eikonal method for charge-exchange reactions at intermediate energies
. Phys. Rev. C 102,Gamow-Teller transitions to 93Zr via the 93Nb(t,3He+γ) reaction at 115 MeV/u and its application to the stellar electron-capture rates
. Phys. Rev. C 101,New 59Fe Stellar Decay Rate with Implications for the 60Fe Radioactivity in Massive Stars
. Phys. Rev. Lett. 126,Simulations and analysis tools for charge exchange (d,2He) reactions in inverse kinematics with the AT-TPC
. Nucl. Instrum. Methods Phys. A 1051,β+ Gamow-Teller strengths from unstable 14O via the (d,2He) reaction in inverse kinematics
. Phys. Rev. Lett. 103,Constraining equation of state of nuclear matter by charge-changing cross section measurements of mirror nuclei
. Phys. Lett. B 833,New measurement of the elemental fragmentation cross sections of 218 MeV/u 28Si on a carbon target
. Phys. Rev. C 107,Two-neutron removal cross sections from 15,16C at around 240 MeV/u
. Phys. Rev. C 99,One-proton knockout from 16C at around 240 MeV/u
. Phys. Rev. C 100,Single-neutron removal from 14,15,16C near 240 MeV/u
. Phys. Rev. C 104,Experimental study of the 9Li breakup reaction on Pb target
. Nucl. Sci. Tech. 28, 177 (2017). https://doi.org/10.1007/s41365-017-0334-4Present status of HIRFL complex in Lanzhou
. J. Phys. Conf. Ser. 1401,Development of a semi-cylindrical time projection chamber prototype for (3He,t) charge exchange reaction experiment
. Eur. Phys. J. C 83, 1092 (2023). https://doi.org/10.1140/epjc/s10052-023-12170-xProperty Investigation of the Wedge-Shaped CsI(Tl) Crystals for a Charged-Particle Telescope
. Nucl. Instrum. Methods Phys. A 1013, (2021)Advances in nuclear detection and readout techniques
. Nucl. Sci. Tech. 34, 205 (2023). https://doi.org/10.1007/s41365-023-01359-0Fudan multi-purpose active target time projection chamber (fMeta-TPC) for photonuclear reaction experiments
. Nucl. Sci. Tech. 35, 200 (2024). https://doi.org/10.1007/s41365-024-01576-1NνDEx-100 conceptual design report
. Nucl. Sci. Tech. 35, 3 (2024). https://doi.org/10.1007/s41365-023-01360-7Performance of a small AT-TPC prototype
. Nucl. Sci. Tech. 29, 97 (2018). https://doi.org/10.1007/s41365-018-0437-6Performance of the CAT-TPC based on two-dimensional readout strips
. Nucl. Sci. Tech. 32, 85 (2021). https://doi.org/10.1007/s41365-021-00919-6Laser test of the prototype of CEE time projection chamber
. Nucl. Sci. Tech. 29, 41 (2018). https://doi.org/10.1007/s41365-018-0382-4Studies of an event-building algorithm of the readout system for the twin TPCs in HFRS
. Nucl. Sci. Tech. 35, 73 (2024). https://doi.org/10.1007/s41365-024-01434-0Performance study of the Multi-purpose Time Projection Chamber (MTPC) using a four-component alpha source
. Nucl. Instrum. Methods Phys. Res. A 1060,Optically polarized 3He
. Rev. Mod. Phys. 89,Intermediate energy charge-exchange reactions induced by polarized 3He
. Nucl. Instrum. Methods Phys. A 402, 354-360 (1998). https://doi.org/10.1016/s0168-9002(97)00862-0Density measurement through elastic electron scattering with a gaseous target at the Jefferson Lab
. Chin. Phys. C 36, 610 (2012). https://doi.org/10.1088/1674-1137/36/7/008A concise review on THGEM detectors
. Nucl. Instrum. Methods Phys. A 598, 107 (2009). https://doi.org/10.1016/j.nima.2008.08.062The THGEM: a thick robust gaseous electron multiplier for radiation detectors
. Nucl. Instrum. Methods Phys. A 623, 132 (2010). https://doi.org/10.1016/j.nima.2010.02.172Discharge studies and prevention in the gas electron multiplier (GEM)
. Nucl. Instrum. Methods Phys. Res. A 479, 294-308 (2002). https://doi.org/10.1016/S0168-9002(01)00931-7Design Studies for a TPC Readout Plane Using Zigzag Patterns With Multistage GEM Detectors
. IEEE Trans. Nucl. Sci. 65(7) 1416, (2018). https://doi.org/10.1109/TNS.2018.2846403GET: A generic electronics system for TPCs and nuclear physics instrumentation
. Nucl. Instrum. Methods Phys. Res. A 887, 81-93 (2018). https://doi.org/10.1016/j.nima.2018.01.020An optical fiber-based flexible readout system for micropattern gas detectors
. J. Instrum. 13,Production and Properties of a Charging-up “Free” THGEM with DLC Coating
. Nucl. Instrum. Methods Phys. Res. A 966,Study on Gain Stability of Thick Gas Electron Multiplier
. Nucl. Instrum. Methods Phys. Res. A 986,Prototype studies on the forward MWDC tracking array of the external target experiment at HIRFL-CSR
. Chinese Phys. C 38,Resolution studies of cosmic-ray tracks in a TPC with GEM readout
. Nucl. Instrum. Methods Phys. A 538, 372-383 (2005). https://doi.org/10.1016/j.nima.2004.08.132Simulation and reconstruction of particle trajectories in the CEPC drift chamber
. Nucl. Sci. Tech. 35, 128 (2024). https://doi.org/10.1007/s41365-024-01497-zDesign and construction of charged-particle telescope array for study of exotic nuclear clustering structure
. Nucl. Sci. Tech. 35, 134 (2024). https://doi.org/10.1007/s41365-024-01503-4FPGA-based position reconstruction method for neutron beam flux spatial distribution measurement in BNCT
. Nucl. Sci. Tech. 35, 56 (2024). https://doi.org/10.1007/s41365-024-01417-1Measurement of the high energy γ-rays from heavy ion reactions using Cerenkov detector
. Nucl. Sci. Tech. 35, 24 (2024). https://doi.org/10.1007/s41365-024-01368-7Simulation study of BESIII with stitched CMOS pixel detector using acts
. Nucl. Sci. Tech. 34, 203 (2023). https://doi.org/10.1007/s41365-023-01353-6Hi'CT: a pixel sensor-based device for ion tomography
. Nucl. Sci. Tech. 34, 111 (2023). https://doi.org/10.1007/s41365-023-01251-xUse of the hough transformation to detect lines and curves in pictures
. Commun. ACM 15(1), 11-15 (1972). https://doi.org/10.1145/361237.361242Performance of the CMS cathode strip chambers with cosmic rays
. J. Instrum. 5,Study of (3He,t) charge exchange reactions to isobaric analog states in inverse kinematics
. arXiv. https://doi.org/10.48550/arXiv.2307.10643The authors declare that they have no competing interests.

