Introduction
Neutron porosity logging is a conventional geophysical measurement method used to determine the formation porosity. The americium-beryllium (Am-Be) source is commonly used for conventional porosity measurements. However, they pose potential risks to safety, health, and the environment [1-4]. Researchers have studied substitution chemical sources with deuterium-deuterium (D-D) neutrons [5-7]. However, the neutron yield of D-D neutron sources is relatively low, which restricts their application [8, 9].
In 2005, the oilfield services company Schlumberger (now SLB) began using a deuterium-tritium (D-T) neutron source for compensated thermal neutron porosity logging [10]. Compared to the chemical source, the D-T neutron source has a higher neutron yield, higher neutron energy of 14 MeV, and a longer slowing-down length of the neutron; thus, D-T neutron logging can detect more thermal neutrons and has a higher detection accuracy.
Nevertheless, neutron slowing-down is facilitated by inelastic scattering owing to the higher energy of neutrons. Consequently, the D-T neutron recording exhibits reduced sensitivity to porosity compared to the chemical source [11, 12], as measured by the conventional neutron porosity interpretation model founded on the Am-Be source [13-15].
To overcome this problem,various density correction methods have been proposed to improve the porosity sensitivity of D–T neutron logging. The near and far thermal neutron counts were corrected using the density correction function, and the modified thermal neutron counting ratio was considered to be only associated with the hydrogen-containing index [16]. Further, the density correction methods were summarized to modify the thermal neutron counting ratio and studied by MC simulation [17]. The relationship of slowing-down length of neutrons between the formation density and hydrogen index was deduced and numerically simulated [18]. Based on data from the standard calibration experiment and actual logging [19, 20], it was verified that the density correction results were consistent with the isotopic neutron source.
In addition, the slowing-down length of the D-T neutron source can be converted into that of the Am-Be source. One method involves the relationship between the neutron slowing-down length, capturing of the cross-section, and density to predict the counting ratio [21]. The second involves the combination of the two-group diffusion theory with the formation density, reaction cross-section, and neutron slowing-down length [22].
In these studies, the slowing-down length is written as
The slowing-down of neutrons is the result of both elastic and inelastic scattering. At high-porosity, because of the higher hydrogen content, the free mean path of elastic scattering is short [23, 24] and
Theoretical analysis
Distribution of the thermal neutron
Based on the two-group diffusion theory, the distribution of the thermal neutron flux density for a fast neutron point source in an infinite uniform medium is expressed as [22]
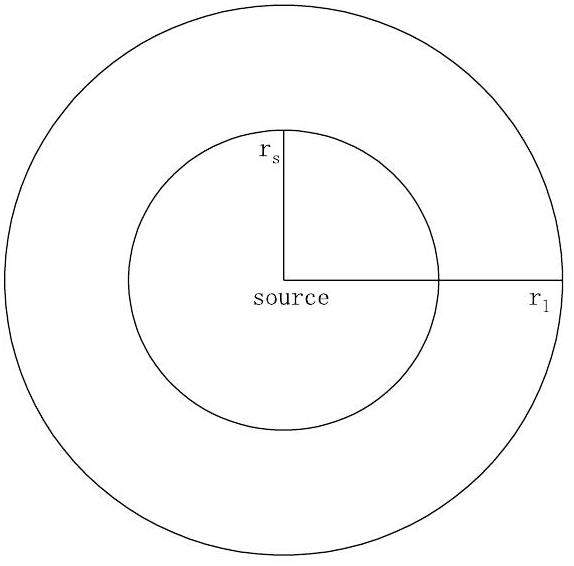
In conventional compensated porosity logging, the energy of the neutrons emitted from the Am-Be source is below 5 MeV, and the neutrons are primarily slowed down by elastic scattering with hydrogen in the formation. The counting ratio of the thermal neutrons reflects the porosity of the formation. However, the neutron produced by the D-T reaction has an energy of 14 MeV, and neutrons are slowed down by elastic and inelastic reactions with the elements of the formation. Therefore, the porosity of the formation cannot be directly determined by the counting ratio of thermal neutrons.
The slowing-down model of the fast neutron
In this subsection, a slowing-down model of the D-T neutron is established to investigate the relationship between the slowing-down length Lf and elastic scattering, particularly at low-porosity.
According to the diffusion equation [23], the slowing-down length Lf can be expressed as:
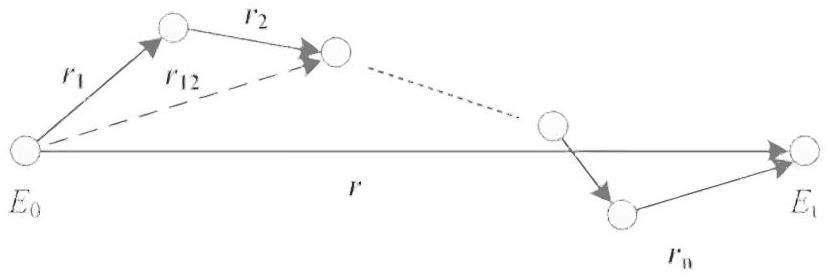
According to neutronics,
When a neuron slows, there are two types of scattering: elastic and inelastic. In elastic scattering, the neutron strikes the nucleus and the state of the nucleus remains in the ground state. The process of inelastic scattering is identical to that of elastic scattering except that the nucleus remains in an excited state. Neutrons are slowed by numerous elastic and inelastic scatterings. Therefore,
We assume that
Based on this assumption,
Slowing-down model of the fast neutron
To analyze the effects of elastic and inelastic scattering on the neutron slowing-down length, Table 1 presents the theoretical calculation results for the slowing-down length of D–T neutrons in limestone with different porosities (0% to 100%). Specifically, the threshold of inelastic scattering was set to 3.6 MeV for limestone [24], and the cross sections for inelastic and elastic scattering attained the one correspond to the neutron energies of 14 MeV and10 MeV.
| Porosity (%) | nel | nin | |||||
|---|---|---|---|---|---|---|---|
| 0 | 166.33 | 0.613 | 262.36 | 22.54 | 503.02 | 525.56 | 4.29 |
| 10 | 42.76 | 0.136 | 66.35 | 3.42 | 52.10 | 22.28 | 6.42 |
| 20 | 31.70 | 0.072 | 40.28 | 1.43 | 20.85 | 7.64 | 6.54 |
| 30 | 27.55 | 0.047 | 30.41 | 0.79 | 11.33 | 3.85 | 6.75 |
| 40 | 25.38 | 0.033 | 25.29 | 0.50 | 7.14 | 2.32 | 6.90 |
| 50 | 24.05 | 0.025 | 22.49 | 0.35 | 4.91 | 1.54 | 6.49 |
| 60 | 23.14 | 0.019 | 20.80 | 0.26 | 3.59 | 55.52 | 6.16 |
| 70 | 22.49 | 0.021 | 20.04 | 0.20 | 2.74 | 12.12 | 6.52 |
| 80 | 21.99 | 0.015 | 19.80 | 0.16 | 2.16 | 5.26 | 6.65 |
| 90 | 21.61 | 0.009 | 20.31 | 0.13 | 1.75 | 2.94 | 6.80 |
| 100 | 21.30 | 0.007 | 21.35 | 0.10 | 1.44 | 1.88 | 6.91 |
When the porosity of the limestone was 0%, there was no water in the limestone; the macroscopic cross section of inelastic scattering was 0.0279 cm-1, and the macroscopic cross section of elastic scattering was 0.3248 cm-1 [24]. Therefore, the free path of inelastic scattering was approximately 35 cm, whereas that of elastic scattering was approximately 3 cm. However, the nuclides in limestone are primarily C, H, and Ca. These nuclides have a weaker ability to slow down neutrons, thus resulting in more elastic collisions (about 165 times). This resulted in
When the slowing-down power of the formation is weak, neutrons are more likely to reduce their energy through inelastic scattering; therefore, inelastic scattering occurs more frequently. When the slowing-down power of the formation is enhanced, the neutrons can reduce the energy to below E1 through a few collisions. Therefore, the probability and amount of inelastic scattering decrease. However, the free path of elastic scattering is small, rendering the contribution of inelastic scattering to the slowing-down length more dominant. Table 1 also indicates the contribution of the elastic scattering of the D-T neutron in the high-energy region (14 MeV to E1). The variation of the slowing-down length of the elastic scattering in the high-energy region
When the porosity was 0%, the proportion of
In the existing D-T neutron porosity logging method, the elastic scattering of the high-energy part is directly ignored, and porosity measurement is directly associated with elastic scattering below the threshold energy. As shown in the table above, although the elastic scattering of high-energy neutrons has a minimal contribution to the slowing-down length during the D-T neutron slowing-down process, it can still cause an error of approximately 4% if ignored. Therefore, if D-T neutrons are used for porosity logging, it is necessary to establish a suitable porosity logging method suitable for the D-T neutron.
Density correction porosity algorithm
According to Eq. (3), the thermal neutron counting ratio Rt remains almost unchanged in the high-porosity region because of inelastic scattering [22]. Therefore, the porosity is less sensitive to the thermal neutron counting ratio for the D-T neutron source at high-porosity. To enhance the sensitivity of porosity, a density correction method based on Eq. (11) is introduced in this section. By combining Eqs. (9) and (10), the slowing-down length can be written as follows:
If the pore medium is pure water, the relationship between formation density and porosity can be described as follows:
The lethargy of the formation by an elastic collision ζ can be expressed as
Substituting Eqs. (11) and (14) into Eq. (3), the relationship between the porosity ϕ, density ρ and ratio Rt is obtained as follows:
Equation (16) shows that there exists a complex relationship between porosity, density, and thermal counting ratio. In general, the porosity cannot be simply written as the product of f(Rt) and g(ρ). Therefore, the product of f(Rt) and g(ρ) results in deviations in the D-T neutron porosity logging.
Simulation and analysis
Monte Carlo numerical simulation technology is widely used in nuclear logging [27-32]. It can effectively, accurately, and reliably simulate the propagation and interaction of particles in a formation, thereby predicting various nuclear logging parameters. This is of great significance for optimizing logging design, improving logging interpretation accuracy, and other aspects. To verify the validity of Eq. (16), a porosity logging instrument model and a standard well model with TopMC/SuperMC were constructed. Consequently, the application of neutron porosity is investigated in this section.
Monte Carlo simulation
To verify the performance of the proposed algorithm, TopMC/SuperMC was used to build the tool model and simulate D-T neutron porosity logging.
With reference to the NeoScope logging tool of Schlumberger, and considering the actual situation of the instrument, including the size of the instrument, detector size, and thickness of the shield layer, the instrument design is shown in Fig. 3. A neutron porosity logging instrument was developed using a D-T neutron source, two 3He neutron detectors, and two shields. The neutron yield of the D-T neutron source was set as isotopic, and the near and far source-to-detector spacings were 35 cm and 70 cm. To reduce the direct measurement interference from the neutron source, neutron shields were placed between the neutron source and the near detector, as well as between the near and far detectors, which were made of tungsten alloy. The borehole, with a diameter of 20 cm, was filled with fresh water and surrounded by limestone rocks of varying porosities with a diameter and height of 200 cm. The instrument was compressed against the borehole wall and the limestone density was 2.703 g/cm3.
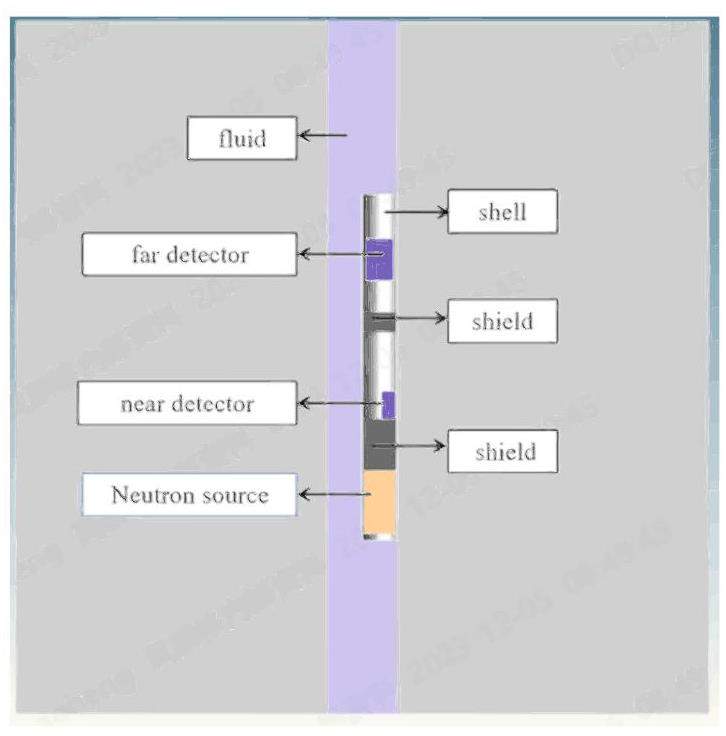
Based on the calculation model shown in Fig. 3, the thermal neutron counts were simulated for different porosities. By combining the simulated results with the least-squares method, the coefficients in Eq. (16) are determined as follows:
Verification of the algorithm
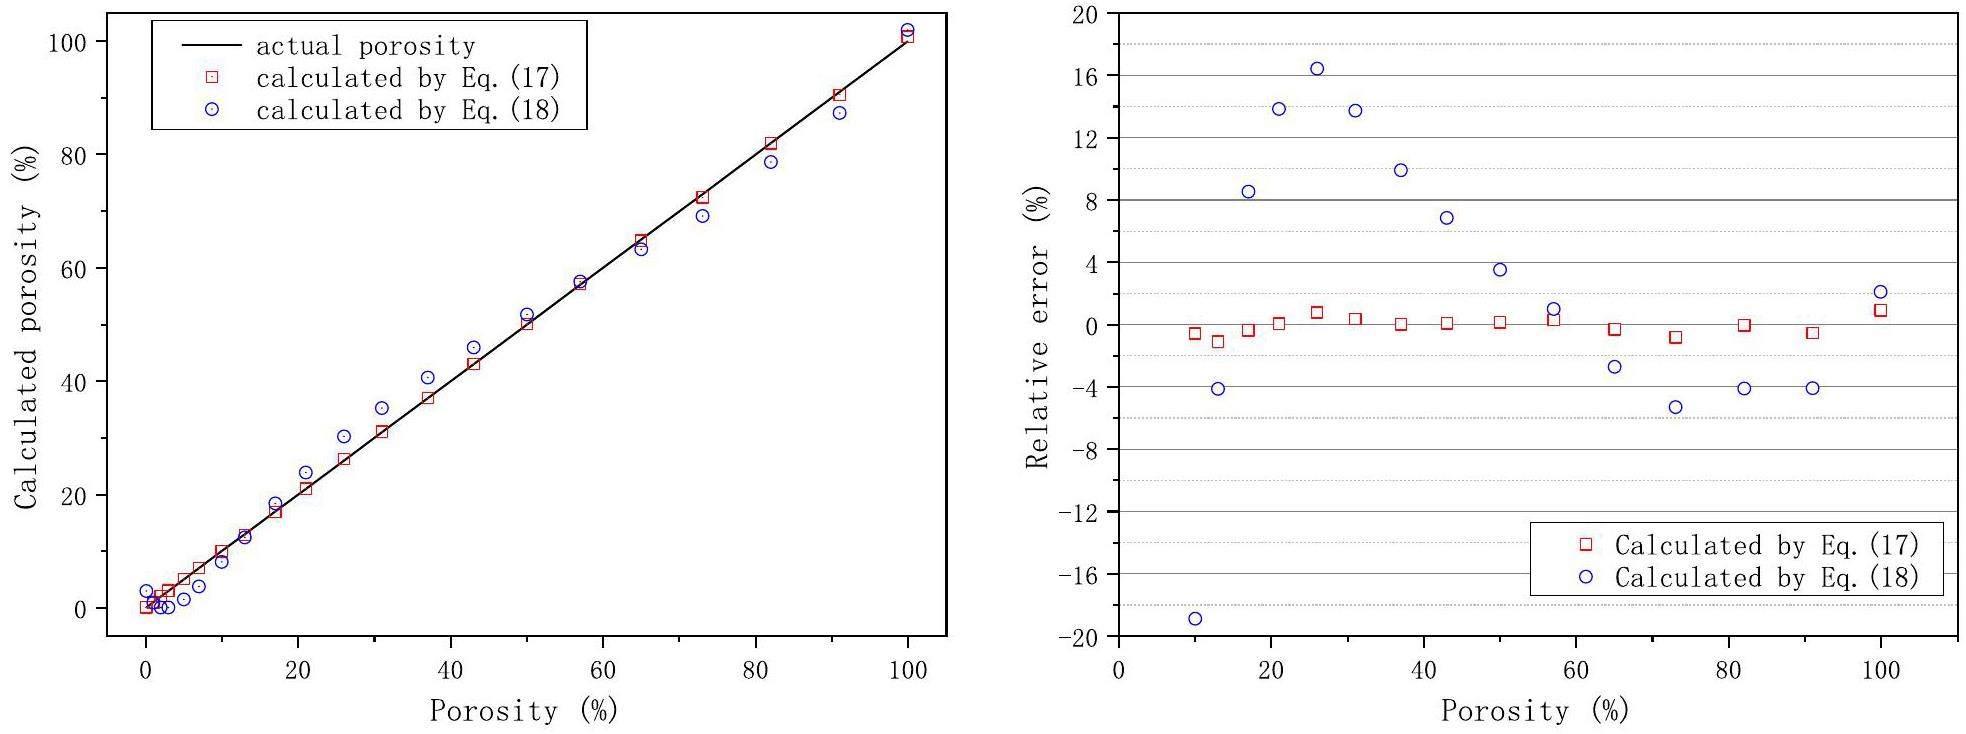
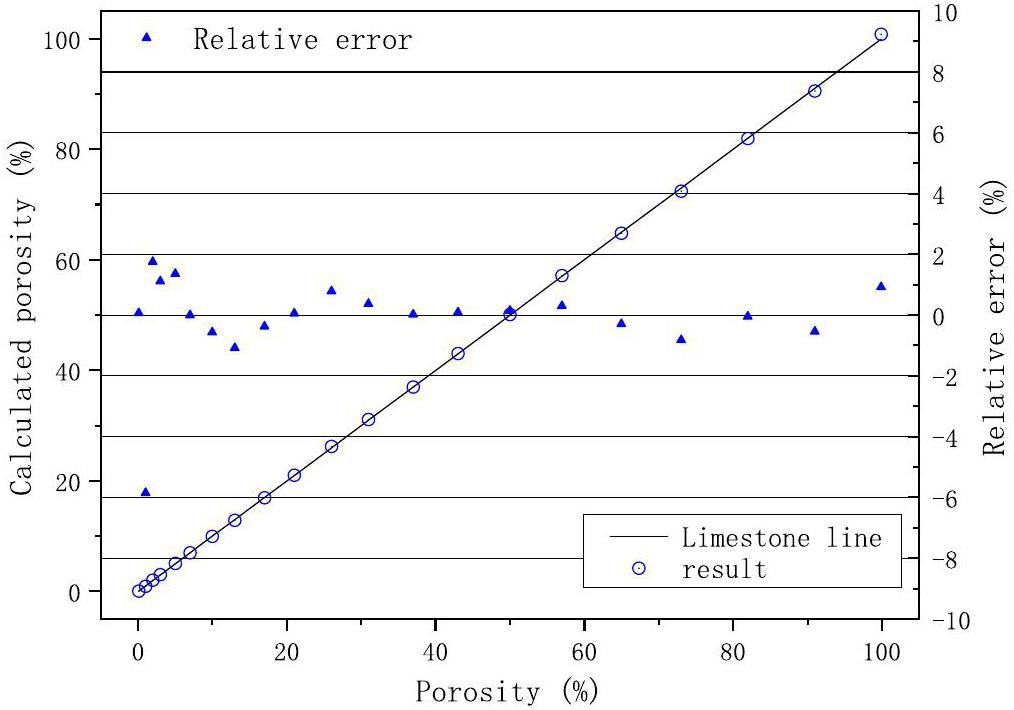
According to the algorithm of Eq. (17), the D-T neutron porosity logging was simulated with limestone porosity of 0.1%, 1%, 2%, 3%, 5%, 7%, 10%, 13%, 17%, 21%, 26%, 31%, 37%, 43%, 50%, 57%, 65%, 73%, 82%, 91%, and 99.9%. Figure 4 shows the performance of Eq. (17) for different porosity values, which verifies the accuracy of the equations. The calculated values almost always fell on the line 45°, and it is evident that the porosity values calculated using Eq. (17) were highly consistent with the true porosity values. In addition, Figure 4 shows the relative errors of the calculated porosity values, which indicate that the relative error between the calculated and real porosities was less than 2% when the porosity values exceeded 10%. Further, the absolute error of porosity was less than 0.1% when the porosity values were less than 10%.
If
| Actual Porosity (%) | Calculated porosity (%) | Absolute error of porosity (%) | ||
|---|---|---|---|---|
| By Eq. (17) | By Eq. (18) | By Eq. (17) | By Eq. (18) | |
| 0.1 | 0.1001 | 2.9772 | 0.0001 | 2.8772 |
| 1 | 0.9415 | 0.9240 | -0.0585 | -0.0760 |
| 2 | 2.0351 | 0.0657 | 0.0351 | -1.9343 |
| 3 | 3.0332 | 0.0503 | 0.0332 | -2.9497 |
| 5 | 5.0675 | 1.4789 | 0.0675 | -3.5211 |
| 7 | 6.9933 | 3.8063 | -0.0067 | -3.1937 |
Influence of density accuracy on porosity measurement
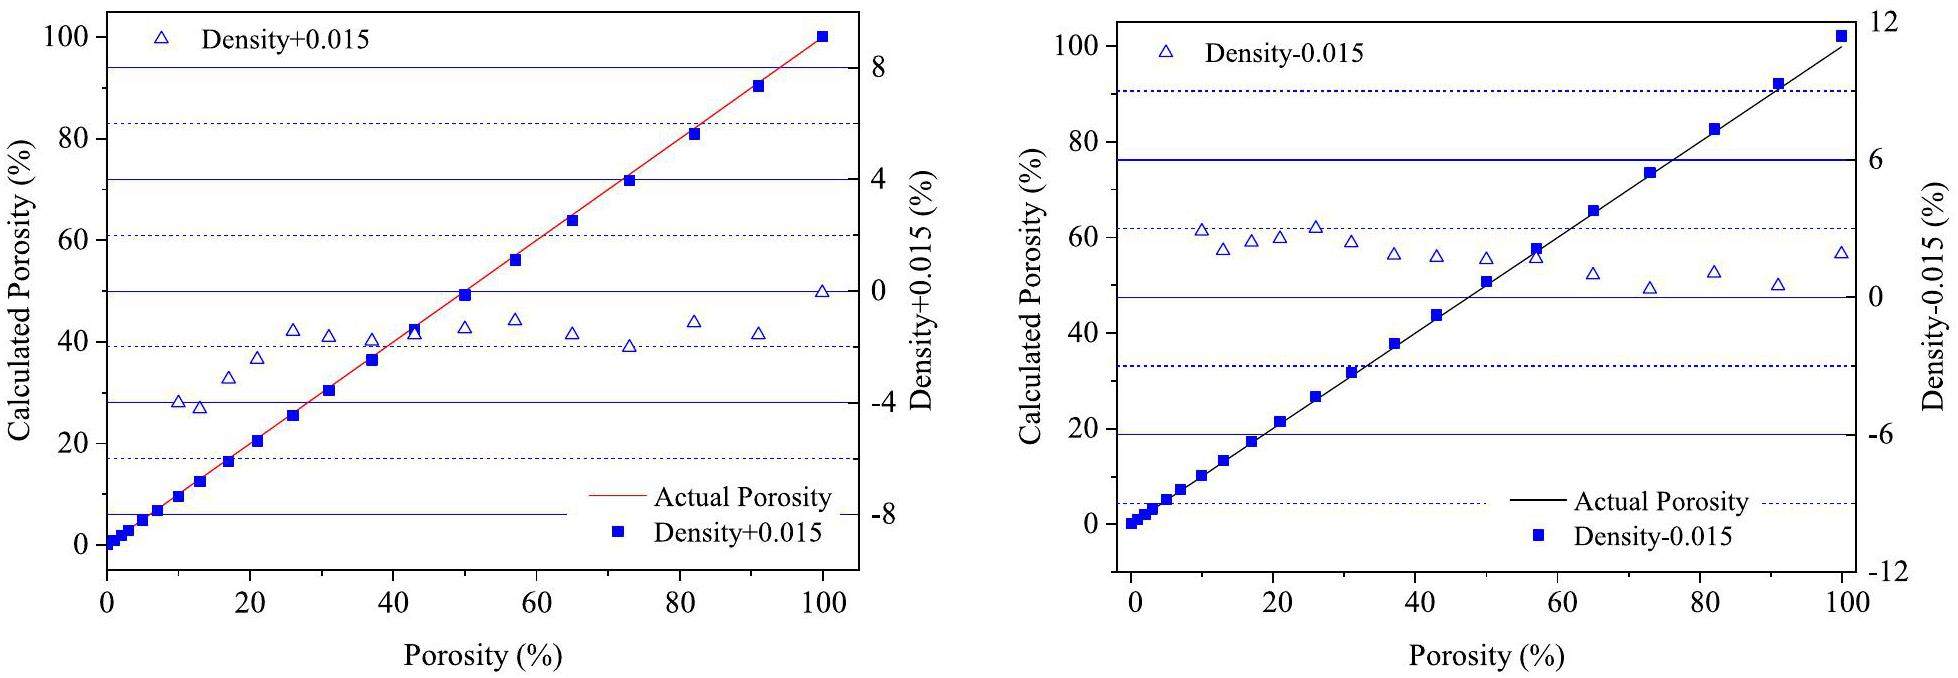
The relationship between density and porosity can be observed from Eqs. (12) and (16). As evident, as the density decreases, the porosity tends to increase. The introduction of density correction has resulted in problems in the accuracy of porosity measurements caused by density measurements. In conventional density measurements, the measurement error, Δρ, should generally be less than 0.015 g/cm3. To evaluate the effect of density precision on the neutron porosity measurement, the calculated results were obtained as shown in Fig. 6 and Table 3 for density errors of +0.015 g/cm3 and -0.015 g/cm3.
| Actual Porosity (%) | Actual density (g/cm3) | Absolute error of porosity (%) | |
|---|---|---|---|
| Density error +0.015 g/cm3 | Density error -0.015 g/cm3 | ||
| 0.1 | 2.7013 | 0.00006 | 0.00006 |
| 1 | 2.68597 | -0.10158 | -0.01522 |
| 2 | 2.66894 | -0.05899 | 0.12956 |
| 3 | 2.65191 | -0.10247 | 0.16961 |
| 5 | 2.61785 | -0.14223 | 0.27824 |
| 6 | 2.58379 | -0.27453 | 0.26220 |
As shown in Fig. 6 and Table 3, the absolute error between the calculated and actual porosities was less than 0.3% when the actual porosity was below 7%. Further, the relative error was less than 4% in areas where the actual porosity was above 7%. In particular, when the porosity exceeded 2%, the relative error was less than 30%. As the porosity increased, the relative error gradually decreased. Therefore, the measurement error of the density exerts a minimal effect on the porosity in conventional density measurements.
This method considers the nonlinear relationship between the detector count and porosity and density during the transport of D-T neutrons in the formation, indicating that the proposed algorithm can effectively improve the measurement accuracy of the porosity compared with the existing density correction algorithm. Further, it greatly eliminate the influence of density measurement error in the actual measurement process.
Conclusion
The fast neutron slowing-down length of the D-T source is affected by both elastic and inelastic scattering. A slowing-down model for fast neutrons was established to explain the process of neutron slowing-down. In this model, the contribution of elastic scattering to the slowdown of neutrons was considered to above the threshold of inelastic scattering. The model shows that the slowing-down length of the D-T neutrons comprised
Finally, a porosity logging model was created using TopMC/SuperMC, and the effectiveness of the established algorithm was verified through simulations. The results showed that the relative error between the calculated and actual porosities was less than 2% when the porosity values exceeded 10%. Whereas, the absolute error of the porosity was less than 0.1% when the porosity values were less than 10%. If
In addition, the effect of density precision on porosity measurement was evaluated. The calculated results showed that the absolute error was less than 0.3% when the actual porosity was below 7%. Further, the relative error was less than 4% in areas where the actual porosity was above 7%.
The algorithm, proposed through theoretical deduction based on the case of a fixed lithology and distance between the detector and neutron source, can improve the overall measurement accuracy of the density correction method. Regarding the use of D–T neutron sources for porosity measurements, this study provides certain reference values.
This study was primarily conducted using simulation instruments in a standard well. In the future, scaling and tests can be conducted based on actual instruments, and further analysis of the influencing factors of complex environments, particularly the influence of lithology and wellbore diameter, will be conducted.
Sourceless LWD porosity determination: A fit for purpose formation evaluation with significant HS&E benefits
. SPE Annual Technical Conference and Exhibition. Society of Petroleum Engineers, (2012). https://doi.org/10.2118/159522-MSRadiation sources in drilling tools: comprehensive risk analysis in the design, development and operation of LWD tools
. SPE International Conference on Health, Safety and Environment in Oil and GasExploration and Production,Radioactive sources in petroleum industry: applications, Concerns and Alternatives
. AsiaPacific Health, Safety, Security and Environment Conference, 4–6 (2009). https://doi.org/10.2118/123593-MSMonte Carlo simulation on compensated neutron porosity logging with D-D neutron porosity logging with D-D neutron generator
. Well Logg. Techno. 34(3), 227-232 (2010). https://doi.org/10.16489/j.issn.1004-1338.2010.03.004 (in Chinese)Monte Carlo simulation of the neutron porosity logging using D-D neutron generator
. J. Lanzhou Univ. (Nat. Sci.) 48(03), 123-127 (2012). https://doi.org/10.13885/j.issn.0455-2059.2012.03.009 (in Chinese)Neutron generator as alternatives to Am-Be source in well logging: an assessment of fundamentals
. Petrophysics 60(1), 136-170 (2019). https://doi.org/10.30632/PJV60N1-2019a10A new integrated LWD platform brings next-generation formation evaluation services
. In: SPWLA 46th Annual Logging Symposium. Society of Petrophysicists and Well-Log Analysts,The design of “multiple energies from one source” in D-T neutron tube
. Nucl. Sci. Tech. 27(05), 127-132 (2016). https://doi.org/10.1007/s41365-016-0119-1An Assessment of Fundamentals of Neutron Porosity Interpretation: Americium-Beryllium Source Versus Neutron Generator-Based Alternatives
. SPWLA 58th Annual Logging Symposium. (Monte Carlo simulation on compensated neutron porosity logging in LWD with D-T pulsed neutron generator
. J. Isot. 23, 15-21 (2010).https://doi.org/10.7538/tws.2010.23.01.0015 (in Chinese)Analysis of factors affecting the sensitivity of neutron porosity logging
. Nucl. Tech. 41, 53-58 (2018). https://doi.org/10.11889/j.0253-3219.2018.hjs.41.020502. (in Chinese)A new porosity evaluation parameter based on neutron porosity logging
. Appl. Radiat. Isot. 190,A method to improve the sensitivity of neutron porosity measurement based on D-T source
. Nat. Gas Sci. Eng. 33, 879-884 (2016). https://doi.org/10.1016/j.jngse.2016.06.028Formation density affects and corrections in pulsed neutron porosity logging
. Nucl. Tech. 41, 80406 (2018).https://doi.org/10.11889/j.0253-3219.2018.hjs.41.080406 (in Chinese)Data correction and experimental study of neutron porosity logging using D-T source
. Nucl. Tech. 43, 90-94 (2020).https://doi.org/10.11889/j.0253-3219.2020.hjs.43.040502 (in Chinese)Study on density correction of pulsed neutron porosity logging
. Well Logging Technol. 45, 552-556 (2021).https://doi.org/10.16489/j.issn.1004-1338.2021.06.002 (in Chinese)Thermal neutron porosity using pulsed neutron measurements
. In: SPWLA 49th Annual Logging Symposium. Society of Petrophysicists and Well-Log Analysts,Corrections of fast neutron inelastic scattering effects on D-T neutron porosity logging
. Appl. Radiat. Isot. 190,ENDF/B-VII.1 Nuclear Data for Science and Technology: Cross Sections, Covariances, Fission Product Yields and Decay Data
. Nuclear Data Sheets 112(12), 2887-2996 (2011).Multifunctional neutronics calculation methodology and program for nuclear design and radiation safety evaluation
. Fusion Sci. Technol. 74, 321-329 (2018). https://doi.org/10.1080/15361055.2018.1475162SNUPAR-a nuclear parameter code for nuclear geophysics applications
. Nucl. Sci. IEEE Trans. 36, 1215-1219 (1989). https://doi.org/10.1109/23.34634On Benchmark Verification of MCNP Modeling in Compensated Neutron Logging
. Well Logging Technol. 28, 471-477 (2004). https://doi.org/10.16489/j.issn.1004-1338.2004.06.001. (in Chinese)Numerical simulation of controllable source neutron porosity logging based on CLYC detector
. Nucl. Tech. 44, 74-79. (2021). https://doi.org/10.11889/j.0253-3219.2021.hjs.44.040501 (in Chinese)Monte Carlo Study on Shielding of D-T Neutron Porosity Logging-While-Drilling Tool
. Nuclear Electronics & Detection Technology 33, 1123-1126 (2013). https://doi.org/10.3969/j.issn.0258-0934.2013.09.020 (in Chinese)Design and testing of a neutron porosity probe using MCNP code
. J. Radioanal. Nucl. Chem. 260(2), 335-337 (2004). https://doi.org/10.1023/b:jrnc.0000027106.91120.1aBenchmark neutron porosity log calculations: a comparison of MCNP and the specific purpose code McDNL
. Nucl. Sci. IEEE Trans. 36(1), 1223-1226 (1989). https://doi.org/10.1109/23.34636Improved formation density measurement using controllable D-D neutron source and its lithological correction for porosity prediction
. Nucl. Sci. Tech. 33(01), 26-36 (2022).https://doi.org/10.1007/s41365-022-00988-1The authors declare that they have no competing interests.


