Introduction
For most neutrino or low-background detectors, particularly those near the ground [1-8], a muon veto system is necessary to tag muon-induced particles moving to the main detector [9-13]. Cosmic-ray (CR) muons can induce neutrons to produce gamma rays that mimic coincidence signals. Therefore, the efficient identification of muons to remove associated events is essential in such experiments, which is the primary goal of a muon veto detector [10, 14-17]. Plastic scintillation (PS) has been adopted as the basic unit of anti-coincidence detectors in many experiments [18] owing to its advantages of easy machining, flexible structure design, stable performance, and good adaptability [19-30].
Taishan Antineutrino Observatory (TAO) [2, 31-34], scheduled to begin operation in spring 2025, will independently measure the antineutrino energy spectrum of the reactor with an unprecedented energy resolution for the Jiangmen Underground Neutrino Observatory (JUNO) [2, 35-38]. TAO will provide a unique reference for other experiments and nuclear databases [39]. A top veto tracker (TVT) was designed to serve as part of the muon veto system; the PS module is the key element of the TVT. A detailed description of this TVT is provided in [40], where most aspects of the system design and optimization process are covered. In short, it is a design with an optimized wavelength shifting fiber (WLS-fiber) arrangement (uniformly bent in the PS) that can improve light yield and muon detection efficiency.
This paper describes this unique design and corresponding performance. The PS module assembly and production are introduced in Sect. 2. In Sect. 3, the testing system and measurement results of one module are presented from three main perspectives: light yield along the length of the PS module measured using CR muons, effective attenuation length, and coupling effect between WLS-fibers and silicon photomultipliers (SiPMs). In Sect. 4, details of the module performance are discussed. In Sect. 5, the detection efficiency of the module is analyzed under various threshold conditions. Finally, a summary is presented in Sect. 6.
Module production
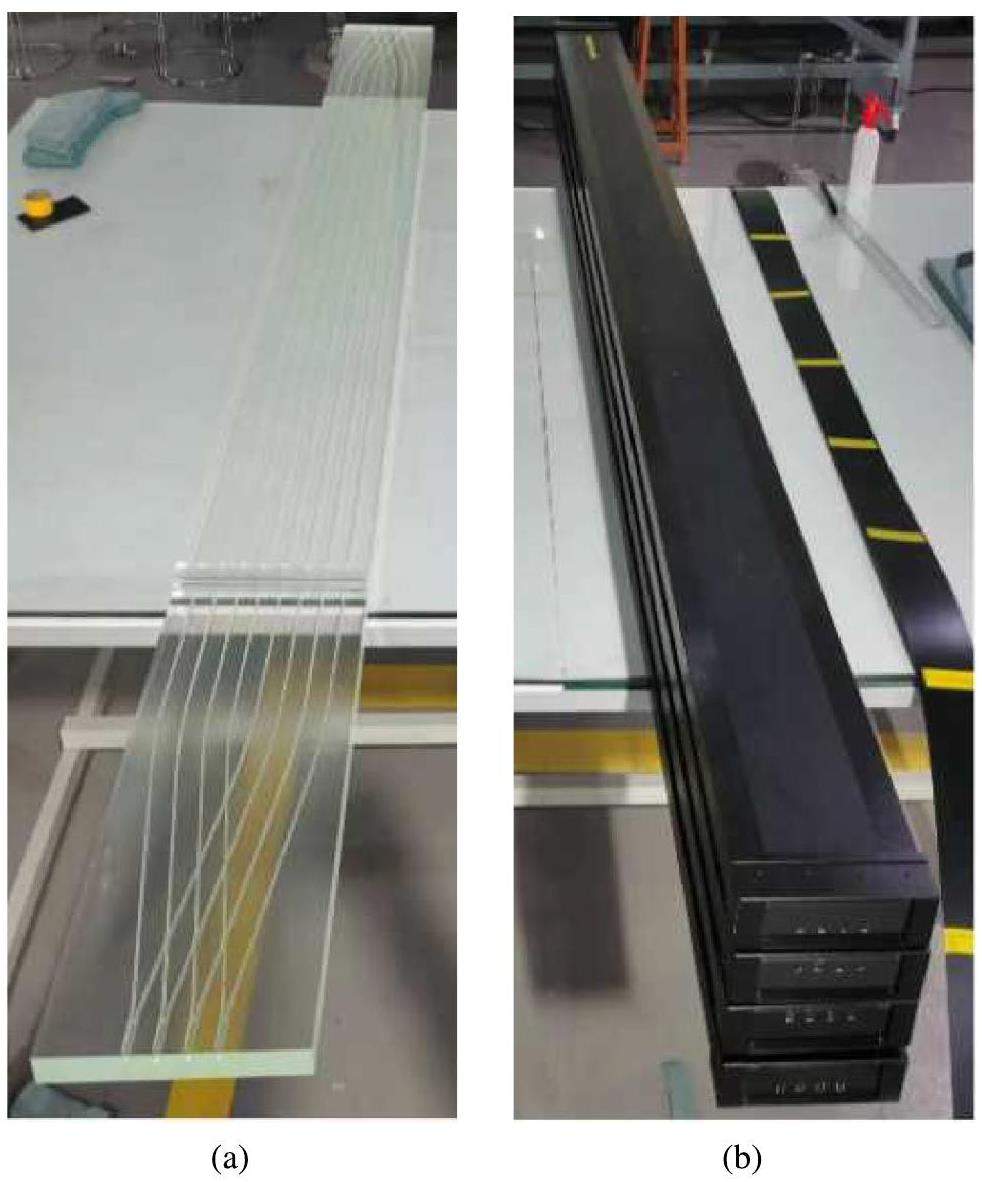
The TVT is composed of 108 PS modules with dimensions of 2000 mm (Length)× 200 mm (Width)× 20 mm (Thickness) (2000-mm PS) and 52 PS modules with dimensions of 1500 mm× 200 mm× 20 mm (1500-mm PS). The simulation optimization, prototype testing, and design of the PS strips for JUNO-TAO were reported in Ref. [40-42]. They are illustrated in Fig. 1. Both 2000-mm and 1500-mm PS modules with eight 1.5 mm WLS-fibers along their width direction (approximately 22.5 mm spacing between neighboring fibers) were laid and glued into the grooves on one surface of the PS modules. The eight fibers were merged into four groups at each end and coupled to SiPMs.

Both the 2000-mm and 1500-mm modules were fabricated by Beijing Hoton Nuclear Technology Co., Ltd.. The PS modules were made using an extruded plastic scintillator (SP101) polymerized with liquid polystyrene containing P-triphenyl and POPOP. The WLS-fiber BCF92 [43, 44] with a diameter of 1.5 mm with a flat end surface was used. The two fibers were focused into a single group that can be coupled to the optical sensors. To ensure a precise arrangement of WLS-fibers in the design, two methods were used: slotting and drilling. First, a slot was made in the middle of the plastic scintillator (4 mm deep), and holes were accurately drilled at both ends of the PS. The grooves were then polished and cleaned. Finally, the WLS-fibers were placed at the bottom of the slot and secured, after which the slot was filled with optical silicone grease (SL600).
Figure 2a shows the physical image of a 2000-mm PS module with inserted 1.5 mm WLS-fibers. All surfaces were polished. Each fiber can be clearly seen in the arrangement of the PS. The PS is first wrapped with 0.08 mm aluminum foil, which serves as a reflective film, then with another 0.8 mm PVC layer, which provides insulation and protection, and finally packaged with a black adhesive tape layer that blocks light. Figure 2b shows the image of a finished 2000-mm PS module.
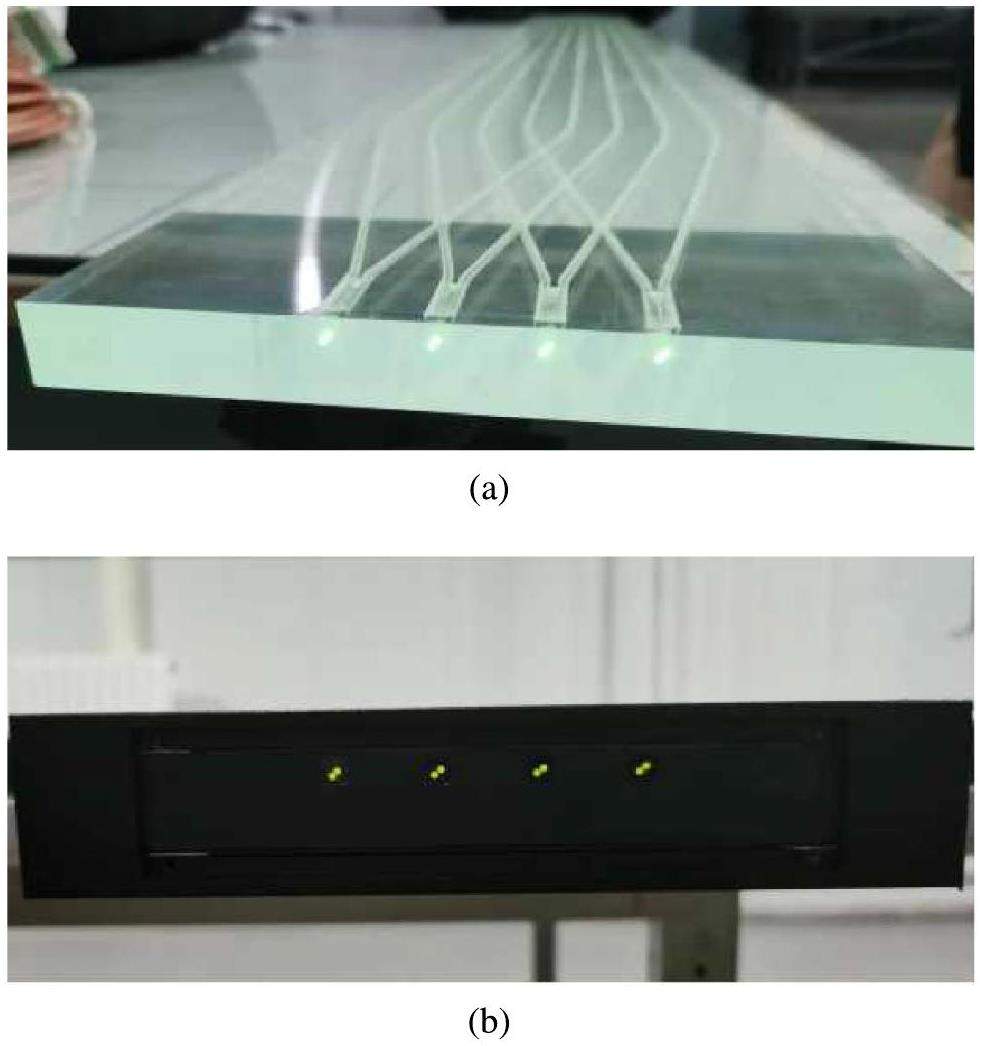
As shown in Fig. 3a, the brightness of the optical fiber and PS can still be distinguished even without shading treatment. SiPM windows with dimensions 4 mm × 4 mm were cut on the backend of the covered PS. Fig. 3b shows the image of one end of the PS module. Eight bright spots in four groups can be clearly seen in the 4 mm× 4 mm optical windows; they are the positions of the WLS-fibers.
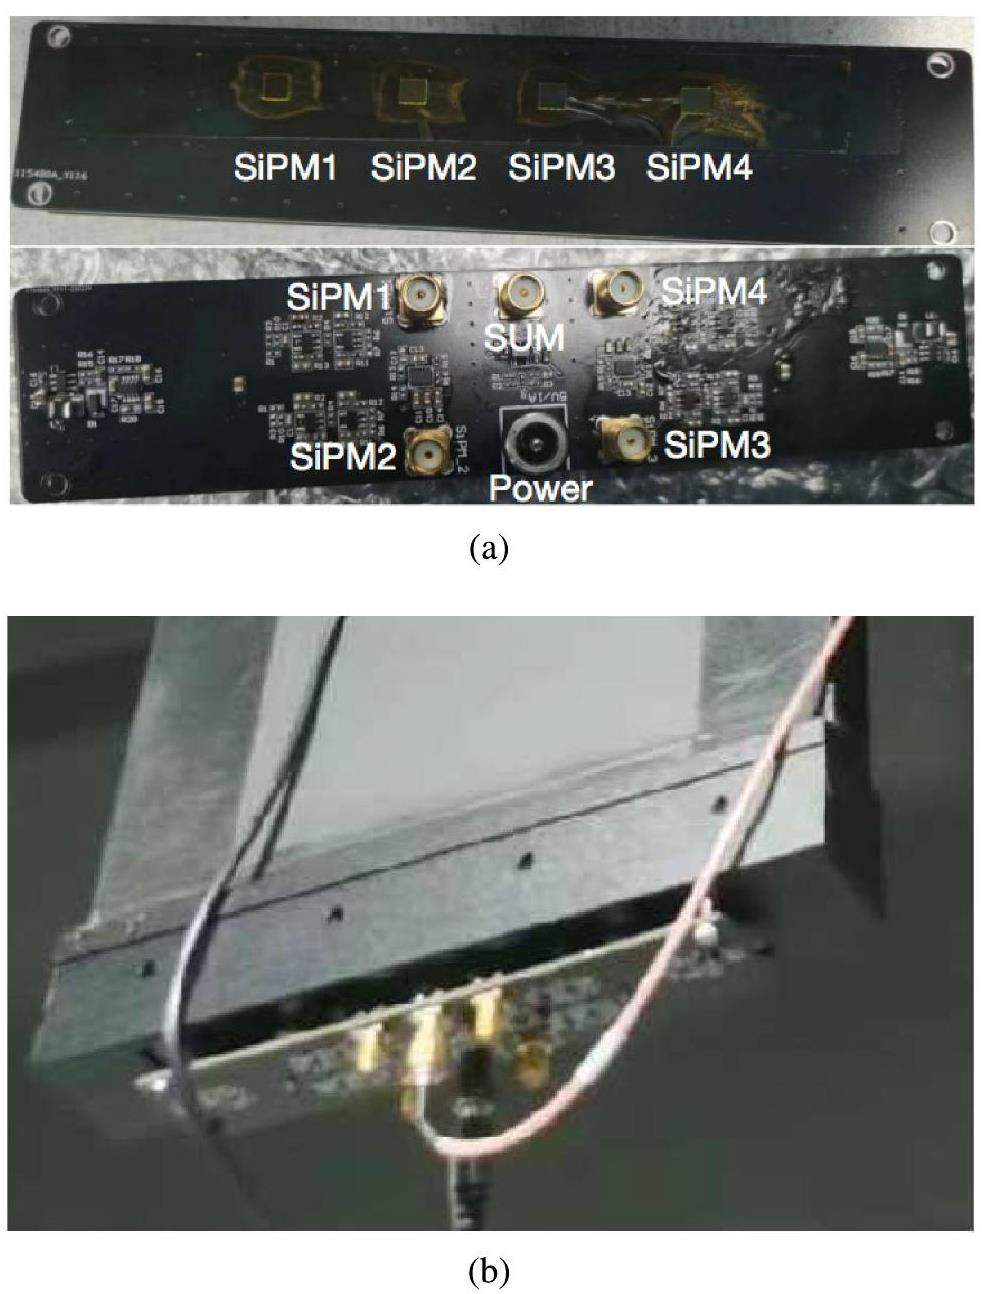
Four SiPMs of the J-series MicroJ-40035-TSV with an integrated readout were used as photon sensors at each end of the PS module [45-48]. Figure 4a shows the layout of four SiPMs on a PCB and the circuit of the output signal channels. These SiPMs (SiPM1, SiPM2, SiPM3, and SiPM4) are coupled to the optical windows. The designed PCB can read out each individual SiPM signal and also sum the signals from all four SiPMs. According to previous simulation results reported in Ref. [40], the differences among the four SiPMs on one end are very small. The design for reading out each SiPM signal enables precise measurement and verification of the differences among the four SiPM signals. The design of the four SiPM summing channels aims to reduce the number of readout channels, with the final PCB design featuring only a single summing channel output. Presently, this type of PCB is primarily designed for module quality inspection and performance testing. The current version of the PCB was fabricated by Dualrainbow Technology Co., Ltd. [49]. Figure 4b shows a picture of the backend of a PS module during mass testing, once the PCB was mounted. The aluminum fixtures were used to mount the PCB onto the PS. After installing the fixtures, they were jointly packaged and coated with black epoxy for light-tight treatment. Coaxial cables with SMA connectors were employed for the output signal line.
Testing system and measurements
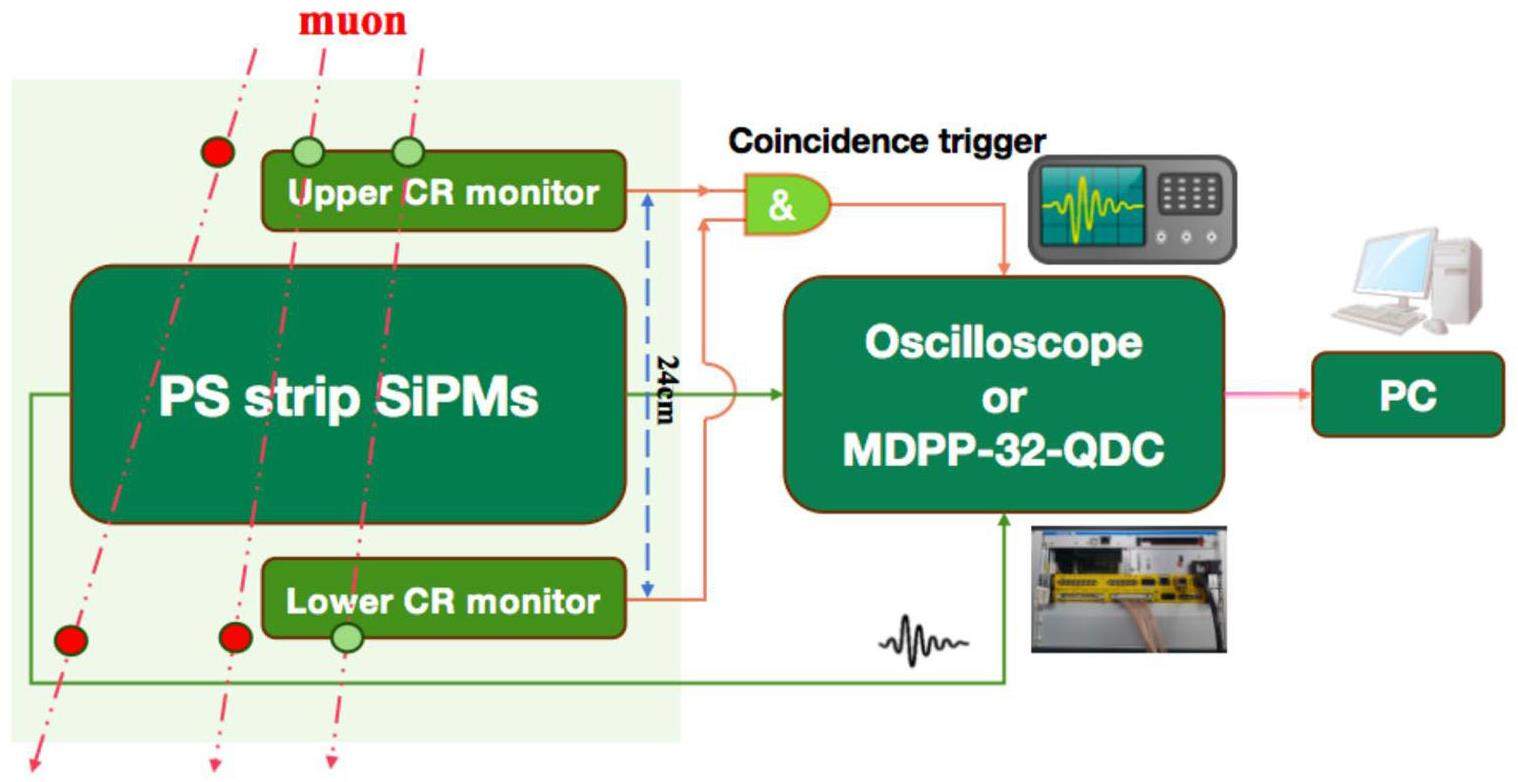
Figure 5 presents a flowchart illustrating the data flow employed to measure the performance of each PS strip at nine locations using muons. The CR muon monitor system consists of two plastic scintillators (EJ200 [50]) with dimensions of 6×6×18 cm3 and a two-inch photo multiplier tube (PMTs) [51, 52] (XP3232). The coincidence of the two monitors is used as a trigger to identify a muon passing through the 2000-mm PS module and to characterize the performance of the strip. The vertical distance between the two monitors is 24 cm to tag muons passing through the 2000-mm PS strip. In Fig. 5, the two CR monitors are placed at the center of the PS module. A high-resolution oscilloscope (lecroy-HDO4104A) was used to acquire four signal channels: two from the CR monitors and two from the summation channel or single channels of the SiPMs attached to the two ends of the PS strip. In addition, another fast, high-resolution time and amplitude digitizer (MDPP-32-QDC) with reduced dead time was used in parallel for comparison. Internally, it functions as a 32-channel adjustable low-noise amplifier with a variable differentiation stage, followed by bandpass filters and 80
In the test conducted, we warmed the PMTs of the CR monitors and set their operating voltages to -1020 V. According to a pre-test and calibration, the threshold for both PMTs of the CR monitors was set to -14 mV for muon identification.
Figure 6a shows the distribution of the amplitude of the signal from two adjacent SiPMs on the same PCB at one end of the PS. The blue and red dots represent experimental data for SiPM1 and SiPM2, respectively. Except for a few data points that do not overlap, the two spectra mostly overlap in other areas, and the spectrum is fitted by a joint function of exponential and Landau distributions for gamma rays and muons. For SiPM1, the most probable value (MPV) of the signal amplitude for muons is 119.5 mV. For SiPM2, the MPV of the signal amplitude for muons is 122.1 mV. The difference between SiPM1 and SiPM2 is less than 3 mV, which is consistent with a previously reported simulation [40], where the signals from different WLS-fibers were relatively equal at the 5% level. This also indicates that the proposed layout of WLS-fibers is effective and relatively uniform.
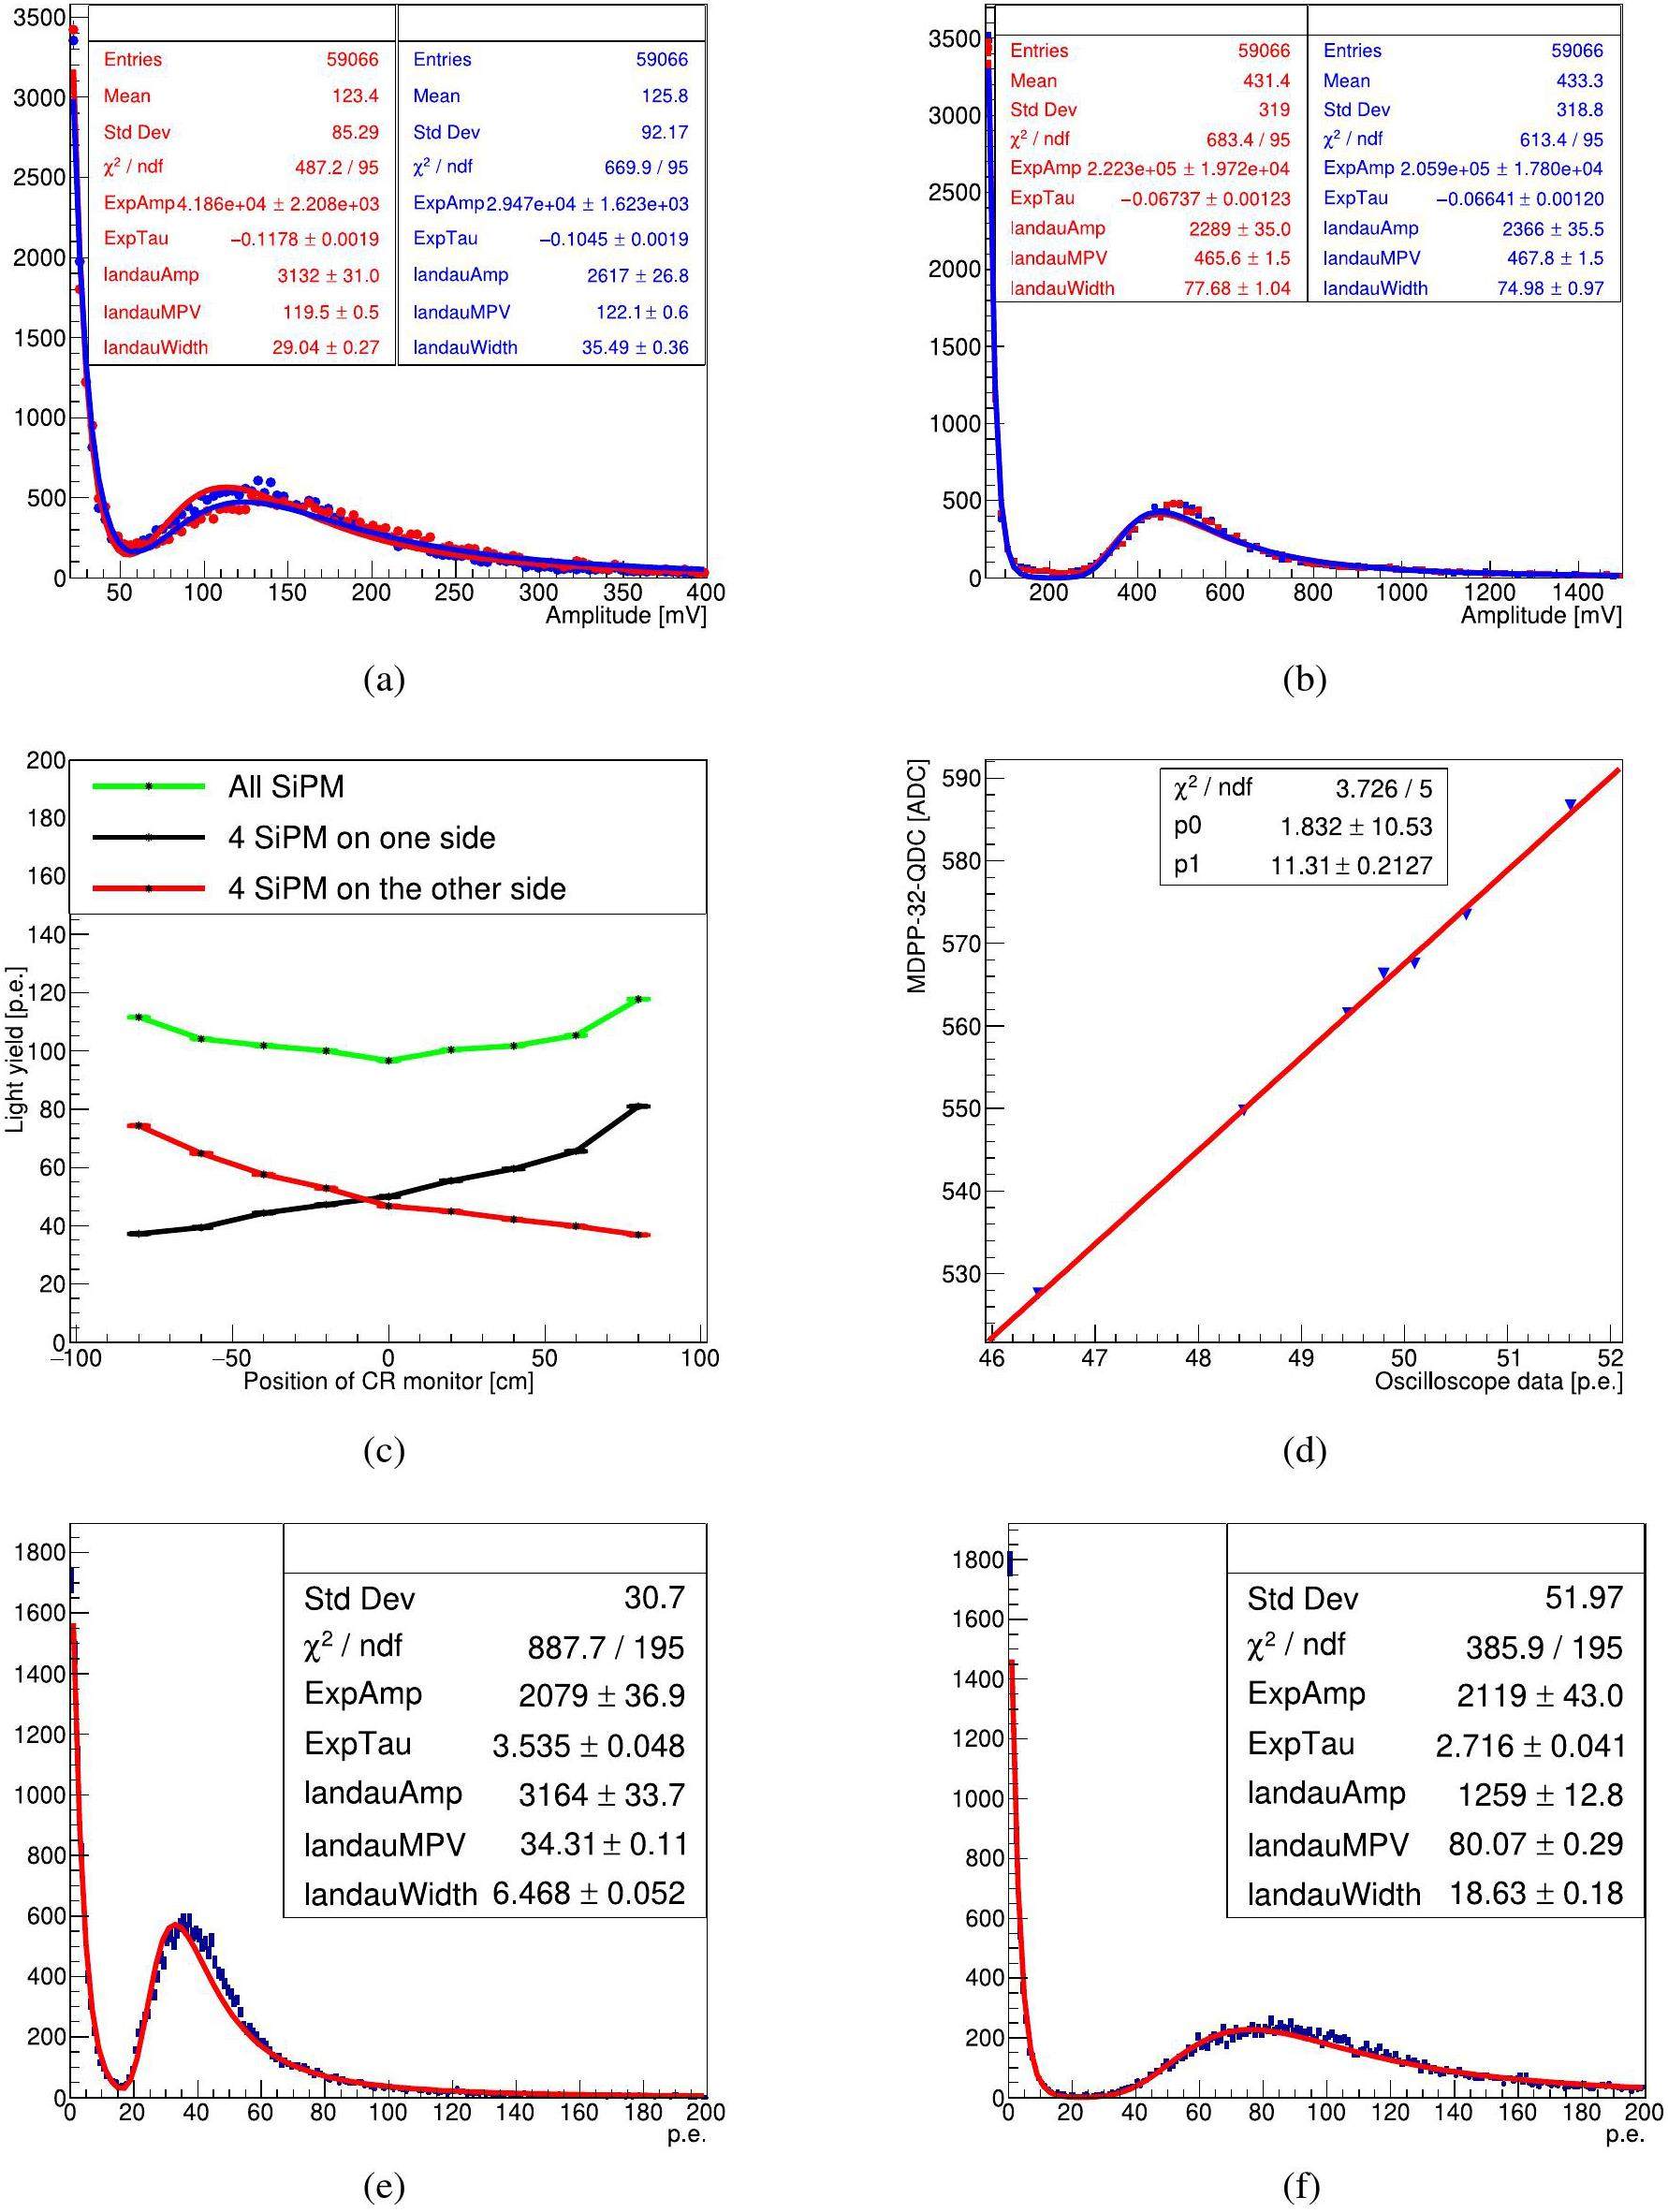
Figure 6b shows the distribution of the amplitude of the signal from the summation channel at both ends of the same PS when the CR monitors are located at its center. The blue and red dots represent experimental data from one end and the opposed end, respectively. It is clear that these two spectra mostly overlap. At one end, the MPV of the fitted Landau distribution is 465.6 mV, whereas at the other end, the MPV of the fitted Landau distribution is 467.8 mV, which is approximately four times that of an individual SiPM channel, as shown in Fig. 6a.
To characterize the signal strength when the muon passes through the PS strips, the MPV fitted by the Landau distribution can be used to estimate the light yield of the strip after conversion into p.e. units, which was measured and calculated at nine different locations along the longitudinal direction of the PS module. Figure 6c shows measurements; the x-axis represents the position of the CR monitor in the longitudinal direction of the PS strip; the error bar in the x-axis represents the 6 cm size width of the CR monitor. The y-axis represents the measured light yield in p.e. units, which was calculated by scaling the relationship between the MPV and signal amplitude of a single photoelectron with a pre-calibrated factor (10 mV per p.e. unit, claimed efficiency of 38% under a bias voltage of 28 V(overvoltage of 3.5 V), and crosstalk ratio of 11.6%). The black, red, and green lines represent the light yields of the four SiPM summation channels at one end, other end, and sum of both ends, respectively. When the CR monitor was located within the range of -80 to 80 cm from the PS strip, the minimum light yield was still higher than 35 p.e. for a single end, and the maximum light yield reached almost 80 p.e. at a single end.
For further validation, we also compared the results from the two data acquisition systems (oscilloscope and MDPP-32-QDC). By placing the CR monitors at the center of the PS strip, we measured seven PS strips using both systems, and the MPV of each PS strip was fitted. In Fig. 6d, the x-axis represents the MPV from the oscilloscope (in p.e.), whereas the y-axis is the MPV from MDPP-32-QDC (in ADC). The seven blue inverted-triangle points represent the MPVs of the seven PS strips fitted by a linear function. The red line represents the fitted results. It is approximately 11.3, ADC/p.e., representing the average ADC count value corresponding to each photoelectron. Additionally, we sampled and measured the outermost position by placing the CR monitor near -97 cm from the center of the PS strip. Figure 6e shows the signal spectrum of one end of the PS that is far away from the CR monitor. The MPV of the fitted Landau distribution was 34.31 p.e. Fig. 6f shows the signal spectrum of the other end of the PS close to the CR monitor. The MPV of the fitted Landau distribution was 80.07 p.e. Similarly, by comparing Figs. 6e and f, it can be concluded that the larger the MPV is, the greater the Landau width becomes. The width of the far-end fitting was reduced by approximately a factor of three compared to the near-end fitting width.
As shown by the green line in Fig. 6c, the summed signal strength is lowest, approximately 95 p.e., when the CR monitors were positioned at the center of the PS strip. As the CR monitors were moved closer to the ends of the strip, the total light yield increased. When the CR monitors were positioned beyond -80 cm or 80 cm from the center of the PS strip, the summed signal intensity reached approximately 115, p.e. To characterize the light attenuation generated by muons in the PS module, we can use the expression
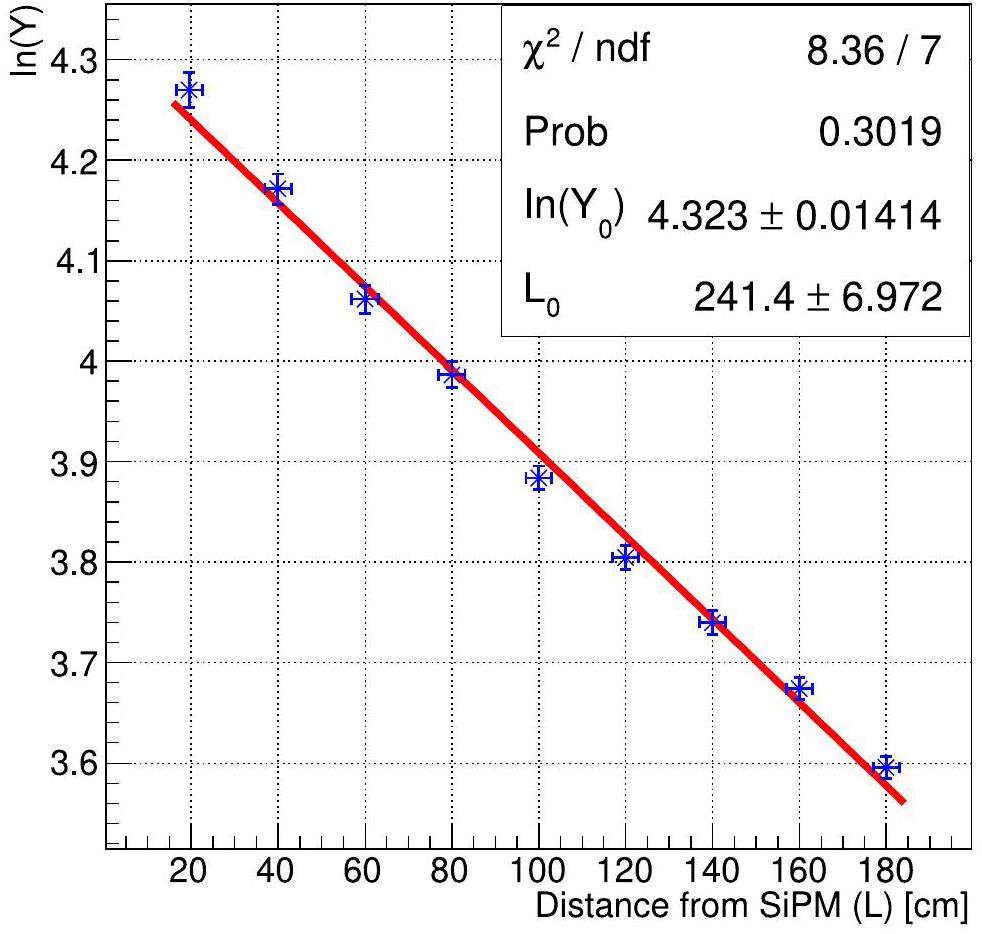
In Fig. 7, by fitting the logarithm of the light yield against the distance from the SiPM [53-55], we determined an effective attenuation length of 241 ± 6.97 cm, which meets our design requirement (greater than 200 cm). According to simulations and experiments, the intrinsic attenuation length of PS is approximately 2 m at a photon wavelength of 410 nm, while the intrinsic attenuation length of WLS-fibers is approximately 3.8 m at the same wavelength. The fact that the effective attenuation length exceeds the intrinsic attenuation length of the PS suggests that the optimized fiber insertion arrangement is effective. It is worth noting that the diameter of the WLS-fibers is notably small (1.5 mm) compared to that of the PS, accounting for less than 5% of the total volume. As a result, most photons are still attenuated within the PS. Therefore, the effective attenuation length is primarily influenced by the intrinsic attenuation length of the PS.
Module performance
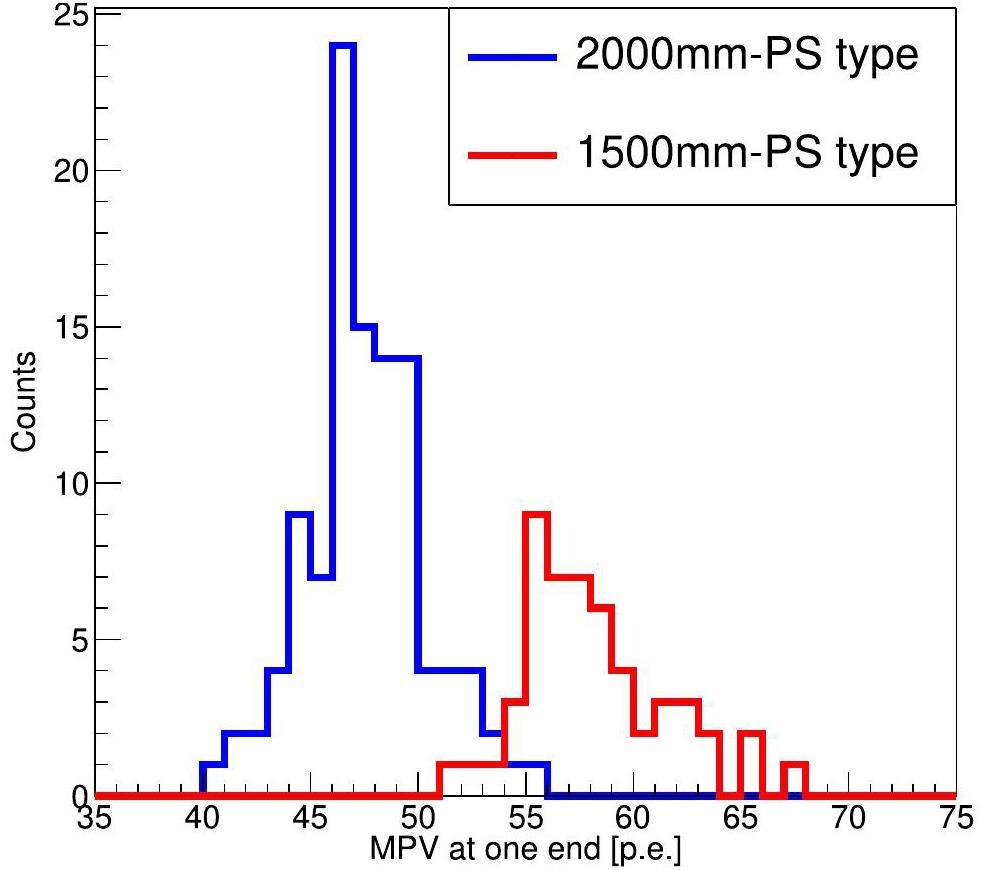
Four batches of acceptance and performance tests were conducted following production. Figure 8 shows the MPV of the single end for all the PS strips when the CR monitors wre located at the center of the PS module. It can be seen in Fig. 8 that the lowest light yield from the single end of the 108 strips of 2000-mm PS modules (blue line) is approximately 40.8 p.e. The mode was measured to be 46 p.e. Note also from the red line for the 52 strips of 1500-mm PS modules that the lowest light yield of the single end is approximately 51.5 p.e. and the mode is concentrated at 55 p.e..
In addition, we used EJ-550 [56] silicone optical grease for coupling between SiPMs and WLS-fibers rather than coupling with air only during the test. Subsequent measurements were conducted to demonstrate that the coupling between SiPMs and WLS-fibers by optical grease can increase the measured light yield by at least 5 p.e. at one end (approximately 12.5% in light yield for 2000-mm PS modules). This indicates that the light yield of the proposed officially operated PS module is even higher.
Detection efficiency
Muons passing through the two CR monitors simultaneously may have passed through the PS module, according to the established setup. Furthermore, the sample purity of the muon candidates in the CR monitors can be tuned by adjusting the threshold of the CR monitor. Figure 9 shows a 2-D plot of the signal amplitude of two CR monitors when they were placed at the center of the PS module. Note that there are several clusters, such as the clusters around 300 ADC and 3100 ADC. It is known that the cluster around 300 ADC is mainly caused by the threshold effect and environmental background, whereas the cluster around 3100 ADC is mostly caused by our target CR muon. The shaded areas represent the energy spectra for all the values in Fig. 10. The events in the upper-right region of Fig. 9, above 2940 (x) and 2940 (y) ADC of the CR monitors, are considered pure muon events. These events are represented by Nreg.
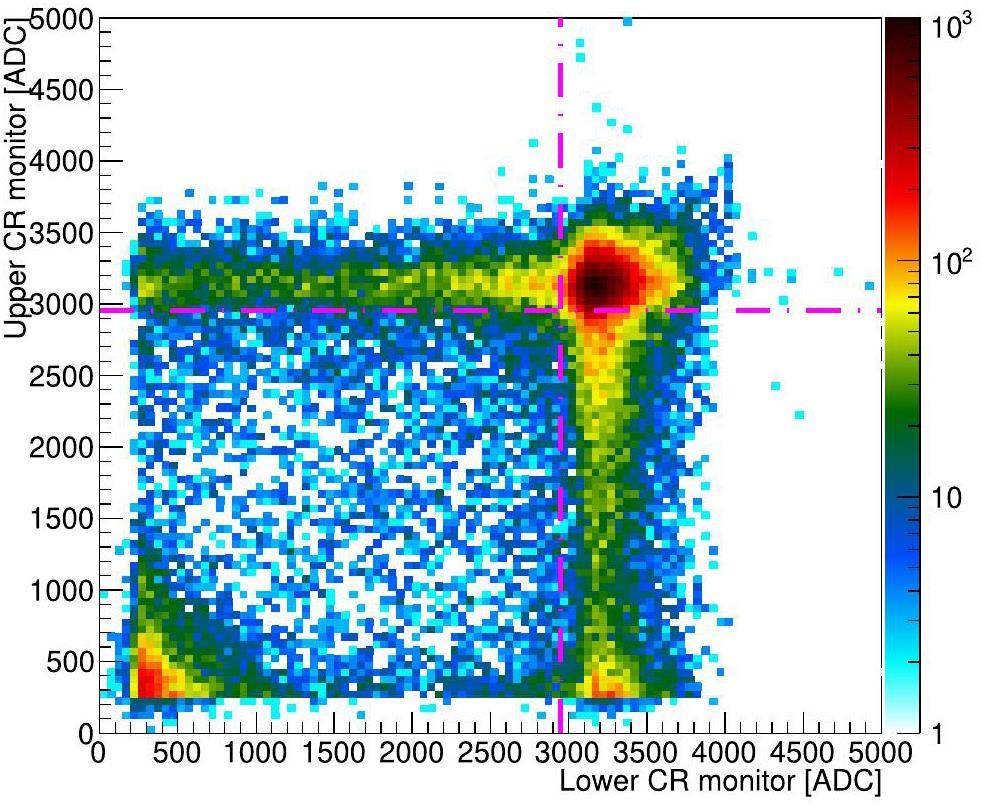

With further muon selection of the two CR monitors (above 2940 (x) and 2940 (y) ADC of the CR monitors), we can obtain the signal strength of the SiPM output mostly from the muons from both ends of the PS strip. The blue plot in Fig. 10a shows the charge spectrum of the summation channel for the four SiPMs at one end of the 1500-mm PS module. The blue plot in Fig. 10b is the summation channel of the other end. Figure 10c shows the total sum in p.e. for both ends from all eight SiPMs.
We evaluated three different thresholds (15, 20, and 25 p.e.) for one end and the other end of the PS module (represented by different colors in Figs. 10a and b, respectively) to select detected muon events. Here, N[one]det and N[other]det represent the number of detected muons by one end and the other end, respectively. Additionally, we assessed the coincidence efficiency of different thresholds applied to both ends of the PS module, as well as the efficiency of combined thresholds considering the suppression of background events. An "AND" logic was applied to the two ends of the PS module for coincidence checking, requiring both ends to exceed the threshold simultaneously within a 100 ns time window. The number of such events is represented by N[oneANDother]det. Three thresholds (30, 40, and 50 p.e.) for the sum of both ends were evaluated (represented by the three different colors in Fig. 10c. The number of these events is denoted as N[module]det. Using this strategy, we calculated the efficiency for different thresholds and configurations using the following four equations:
Table 1 shows the results of calculated detection efficiency for different thresholds on SiPM signals and configurations. Based on the overall perspective presented in Table 1, it can be concluded that as the threshold of the SiPM signal increases, the detection efficiency gradually decreases, as expected. It can also be concluded that ϵoneANDother decreases the fastest as the threshold increases. Figure 11 shows the energy spectrum under “AND” logic mode. Note that in this mode, there is a significant decrease in the coincidence background.
| Threshold[p.e.] | 15 p.e. | 20 p.e. | 25 p.e. |
|---|---|---|---|
| ϵone(%) | 99.72±0.03 | 99.69±0.03 | 99.53±0.03 |
| ϵother(%) | 99.70±0.03 | 99.62±0.03 | 99.46±0.03 |
| ϵoneANDother(%) | 99.63±0.03 | 99.48±0.03 | 99.01±0.04 |
| Threshold[p.e.] | 30 p.e. | 40 p.e. | 50 p.e. |
| ϵmodule(%) | 99.70±0.03 | 99.69±0.03 | 99.62±0.03 |
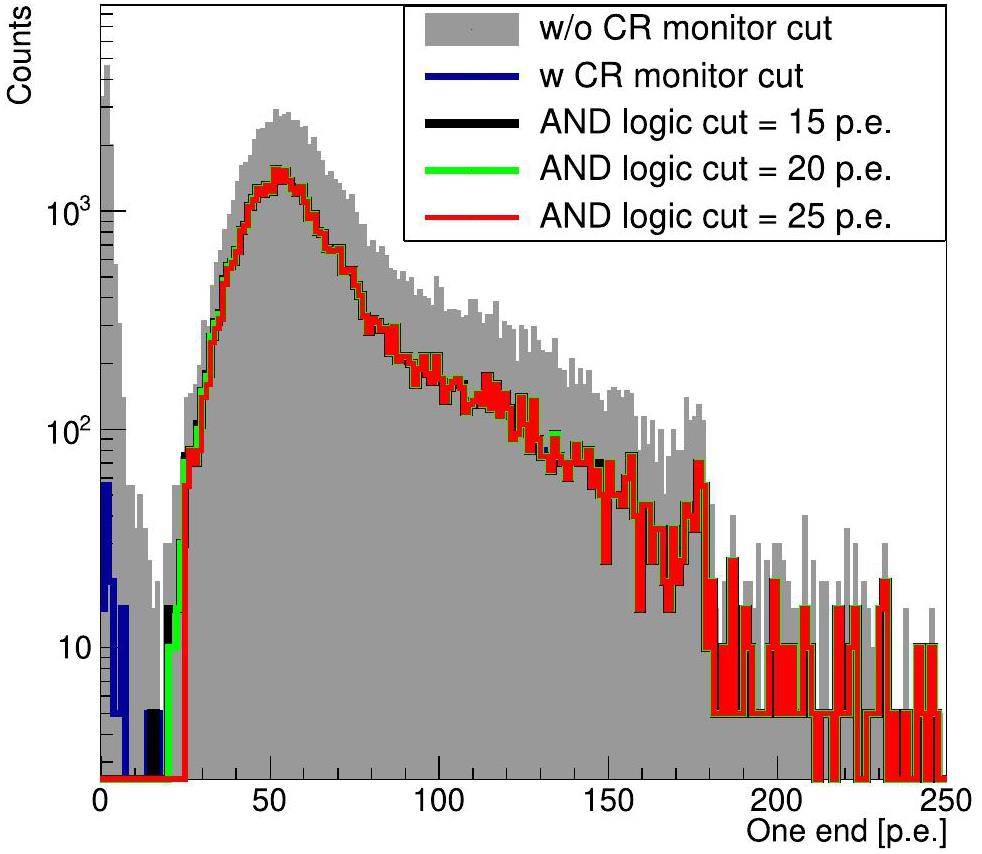
Table 2 shows the rate vs. threshold for the sum of both ends of the PS module as well as the coincidence of the two ends when the PS module was located in a ground-level laboratory without a CR monitor. From Table 2, it can also be observed that under this “AND” logic mode, background events that coincidentally match are significantly reduced. Additionally, the data show that the rate (63 Hz) corresponding to a threshold of 20 p.e. closely approximates the muon rate (64 Hz) at sea level.
| Threshold [p.e.] | 30 p.e. | 40 p.e. | 50 p.e. |
|---|---|---|---|
| Ratemodule (Hz) | 93±9.7 | 83±9.1 | 70±8.3 |
| Threshold [p.e.] | 15 p.e. | 20 p.e. | 25 p.e. |
| RateoneANDother (Hz) | 73±8.5 | 63±7.9 | 48± 6.9 |
The CR monitors were placed at other positions of the PS modules to assess their efficiency. When the CR monitors were turned off at the center of the PS module, the signal strengths obtained at the two ends of the PS module were different. Figure 12 shows a 2-D plot for the two ends of the PS module when the muons hit around 60 cm away from the center of the PS module. Noise or environmental background can be clearly identified from the muon signal. However, the signal at one end was significantly larger than that at the other, which could generate a difference in the efficiency of the two ends at the same threshold on SiPM signals. The muon signal exhibits elliptical characteristics on the 2-D plot owing to the asymmetric distance of the CR monitor from the center of the PS strip. Combining Figs. 6e and f, as well as the 2-D graph in Fig. 12, it can be concluded that the smaller the MPV of the Landau distribution is, the smaller the width of its Landau distribution becomes. When the threshold is excessively high, even when approaching the MPV of one end, ϵoneANDother is determined by the far end (i.e., the end with the smallest signal). According to the measurement results of the CR monitor at the outermost edge of the PS strip, when the threshold was 15 or 20 p.e., ϵoneANDother remained unaffected, being approximately equivalent to the efficiency at the center. When the threshold was greater than 22 p.e., ϵoneANDother at the edge was approximately 0.3% lower than that at the center. In combination with the data shown in Table 2, this demonstrates that the system exhibits excellent tolerance to the threshold for achieving muon tagging efficiency. Considering the potential efficiency and background under different thresholds, we ultimately decided to use ϵmodule and ϵoneANDother to characterize the overall detection efficiency of the PS module.
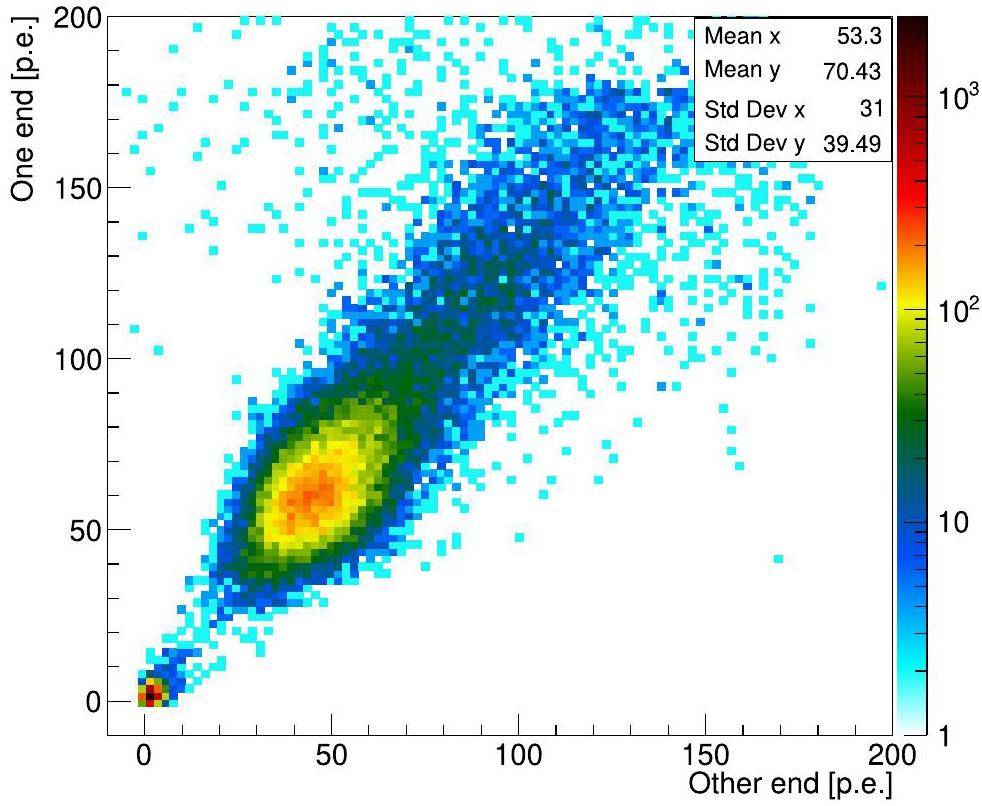
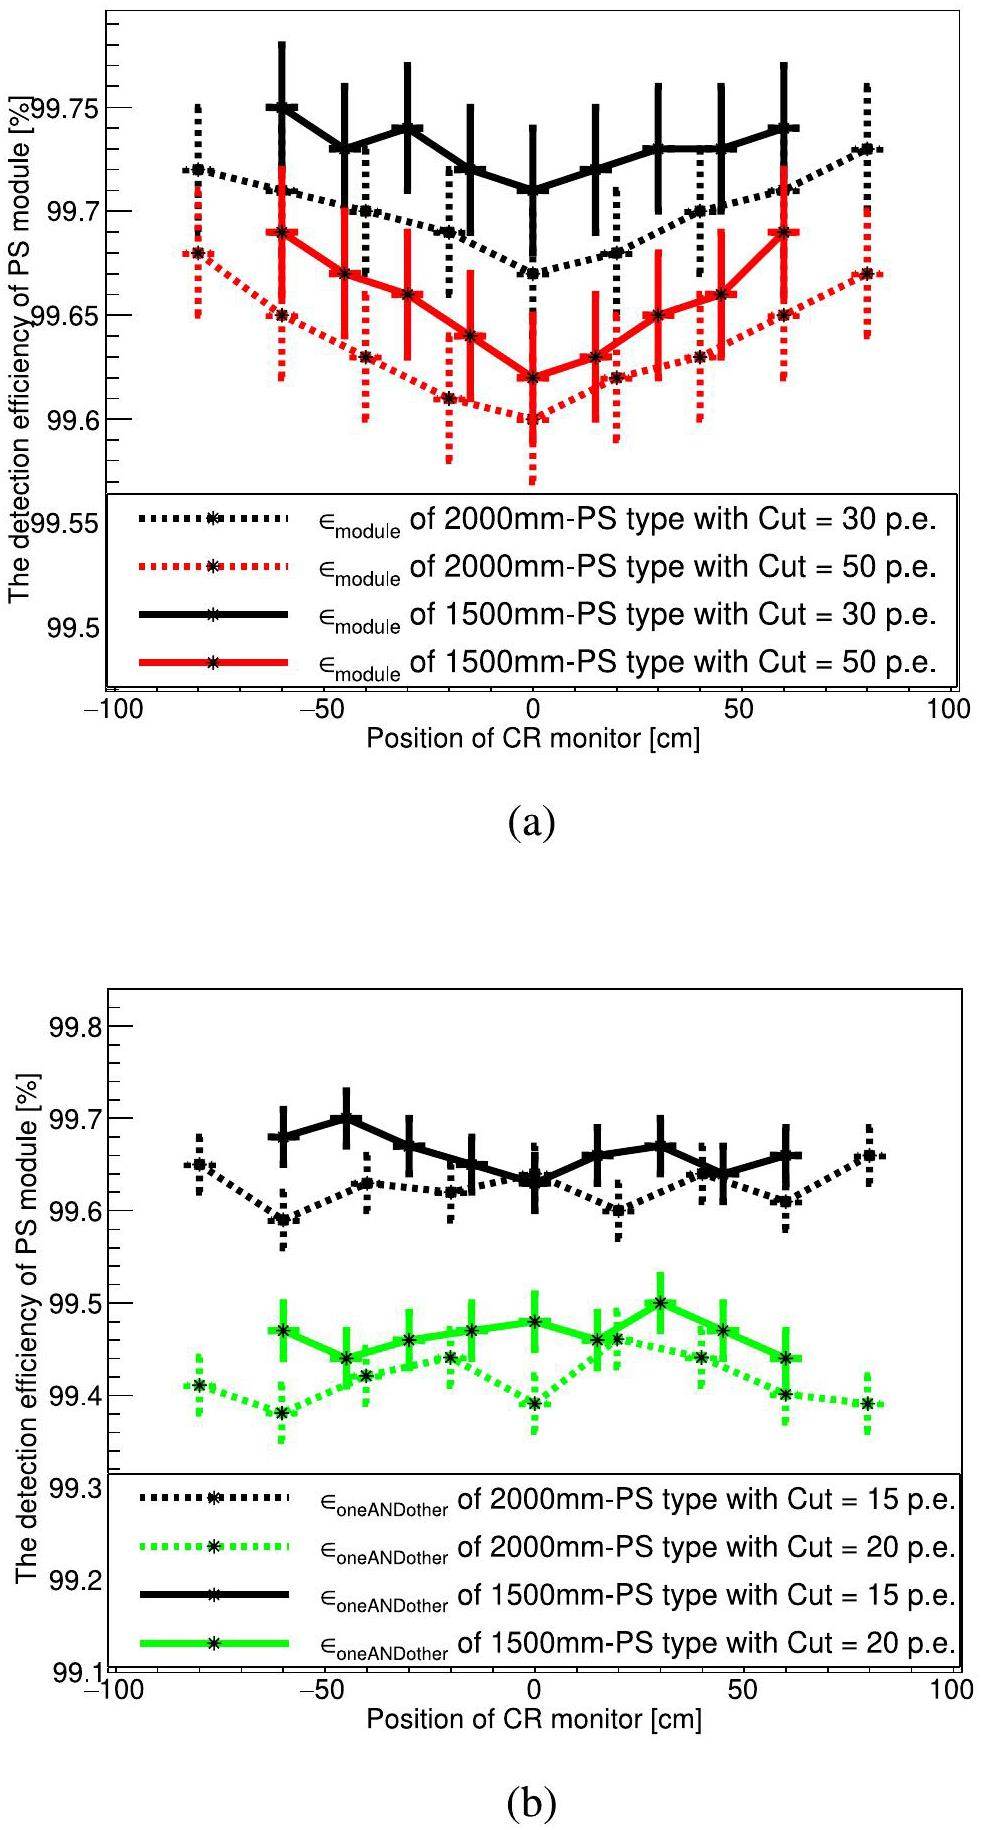
Figure 13a shows the relationship between detection efficiency of the sum of the two ends and muon position (i.e., position of the CR monitors). The position measurements were performed by moving the monitors along the length in 20 cm steps for the 2000-mm PS module (represented by dotted lines in the figure) or in 15 cm steps for the 1500 mm PS module (represented by solid lines in the figure). The error bar on the x-axis represents the 6 cm width of the CR monitor, whereas the y-coordinate represents the detection efficiency of the PS module when the threshold of the sum of the two ends was set to 30 or 50 p.e.; the error bar on the y-axis represents the efficiency error. As the threshold increases, the detection efficiency corresponding to all positions of the PS module decreases. For the 1500-mm PS module, when the threshold was set to 30 p.e., the detection efficiency of each point was higher than 99.7%. For the 2000-mm PS module, when the threshold was set to 50 p.e., the detection efficiency of each point was higher than 99.6%. Overall, the detection efficiency of the 1500-mm PS module was higher than that of the 2000-mm PS module. Fig. 13b shows the relationship between detection efficiency of "AND" logic of the two ends and muon position. In this mode, the efficiency of the 1500-mm PS module is slightly better than that of 2000-mm PS module. For all PS modules, when the threshold was set to 20 p.e., the detection efficiency at each point exceeded 99.3%. The efficiency remained nearly constant along the entire module, with variations at the 0.1% level.
Conclusions
In this paper, we provide a detailed introduction to the unique design and performance of the module, which offers significant value for the design process of PS detectors with WLS-fibers. Additionally, we propose a batch quality inspection process and establish a set of standards for evaluating the performance of PS modules, providing valuable experience and references for quality inspection in other related experiments. A specific summary is as follows. The further the muon strikes towards the two ends of the PS strip, the higher the total light yield, though with greater asymmetry. When the muon hits the center of the PS strip (the region with the minimum effective light yield along the strip, where air coupling occurs between the SiPM and PS), the most probable signal strength output from one end of a 2000-mm PS module is at least greater than 40.8 p.e. For a 1500-mm PS module, this value is at least greater than 51.5 p.e. All modules meet the JUNO-TAO requirement that the light yield to a muon should exceed 40 p.e. Using optical grease to couple the SiPM and WLS fiber increases the effective light yield by 12.5%.
Muon detection efficiency was evaluated at different thresholds on the output from a single end, the sum, or the coincidence of both ends of the module. We defined three types of detection efficiency to comprehensively assess the performance of the plastic scintillator. Overall, the 1500-mm PS module has a higher detection efficiency than the 2000-mm PS module. In "AND" mode, when the threshold was set at 20 photoelectrons, the detection efficiency exceeded 99.3%, and at 15 photoelectrons, it surpassed 99.6%, with clear differentiation between background and muon signals. These features and advantages ensure that the proposed PS performs exceptionally well in experiments, providing a reliable detection solution for other applications.
Neutron-induced background in the CONUS experiment
. Eur. Phys. J. C 79, 08 (2019) https://doi.org/10.1140/epjc/s10052-019-7160-2TAO conceptual design report: A precision measurement of the reactor antineutrino spectrum with sub-percent energy resolution. physics.ins-det
. arXiv:2005.08745s(2020). https://doi.org/10.48550/arXiv.2005.08745Performance of the SiPMs operated at low temperature for the JUNO - TAO detector
. J. Phys. Conf. Ser. 2374(1)(2022), p.A liquid scintillator for a neutrino detector working at -50 degree
. Nucl. Instrum. Meth. A. 1009 (2021), p.Reconstruction of a muon bundle in the JUNO central detector
. Nucl. Sci. Tech. 33 59 (2022). https://doi.org/10.1007/s41365-022-01049-3Exploring coherent elastic neutrino-nucleus scattering using reactor electron antineutrinos in the NEON experiment
. Eur. Phys. J. C. 83, 226 (2023) https://doi.org/10.1140/epjc/s10052-023-11352-xLow Energy Neutrino Physics with sub-keV Ge-Detectors at Kuo-Sheng Neutrino Laboratory
. J. Phys. Conf. Ser. 888, 01 (2017) https://doi.org/10.1088/1742-6596/888/1/012124Exploring CE ν NS with NUCLEUS at the Chooz nuclear power plant
. Eur. Phys. J. C. 79, 1018 (2019). https://doi.org/10.1140/epjc/s10052-019-7454-4Development of an Organic Plastic Scintillator-based Muon Veto Operating at Sub-Kelvin Temperatures for the NUCLEUS Experiment
. J Low Temp Phys. 209, 346-354 (2022) https://doi.org/10.1007/s10909-022-02842-5The JUNO experiment Top Tracker
. Nucl. Instrum. Meth. A. 1057,Detector optimization to reduce the cosmogenic neutron backgrounds in the TAO experiment
. JINST. 17, 09 (2022). https://doi.org/10.1088/1748-0221/17/09/P09024A feasibility study of extruded plastic scintillator embedding WLS fiber for AMoRE-II muon veto
. Nucl. Instrum. Meth.A. 1039,Gamma-, neutron-, and muon-induced environmental background simulations for 100Mo-based bolometric double-beta decay experiment at Jinping Underground Laboratory
. Nucl. Sci. Tech. 34, 135 (2023). https://doi.org/10.1007/s41365-023-01299-9Track reconstruction for the Top Tracker of the JUNO Neutrino experiment
. phdthesis. tel-04103506, 2022STRAE030.Performance of the wavelength-shifting fiber upgrade for the Mu2e cosmic-ray veto detector
. JINST. 18, 05 (2023). https://doi.org/10.1088/1748-0221/18/05/T05004The OPERA experiment target tracker
. Nucl. Instrum. Meth. A. 577, 523-539 (2007). https://doi.org/10.1016/j.nima.2007.04.147Simulation study on performance optimization of a prototype scintillation detector for the GRANDProto35 experiment
. Nucl. Sci. Tech. 32 51 (2021). https://doi.org/10.1007/s41365-021-00882-2Testing and analysis of the plastic scintillator units for LHAASO-ED
. Radiat Detect Technol Methods. 5, 513-519 (2021). https://doi.org/10.1007/s41605-021-00274-5High Efficiency Plastic Scintillator Detector with Wavelength Shifting Fiber Readout for the GLAST Large Area Telescope
. Nucl. Instrum. Meth. A. 583, 372-381 (2007). https://doi.org/10.1016/j.nima.2007.09.040The AGILE anticoincidence detector
. Nucl. Instrum. Meth. A. 556, 228-236 (2006). https://doi.org/10.1016/j.nima.2005.10.016Discrimination of neutrons and gamma-rays in plastic scintillator based on pulse coupled neural network
. Nucl. Sci. Tech. 32, 82 (2021). https://doi.org/10.1007/s41365-021-00915-wAdaptability of neutron-gamma discrimination and filtering methods based on plastic scintillation
. Nucl. Sci. Tech. 32, 28 (2021). https://doi.org/10.1007/s41365-021-00865-3Design and development of a plastic scintillator based whole body β/γ contamination monitoring system
. Nucl. Sci. Tech. 32, 47 (2021). https://doi.org/10.1007/s41365-021-00883-1Position-sensitive plastic scintillator detector with WLS-fiber readout
. Nucl. Sci. Tech 29, 117 (2018). https://doi.org/10.1007/s41365-018-0449-2Imaging internal density structure of the Laoheishan volcanic cone with cosmic ray muon radiography
. Nucl. Sci. Tech 33, 88 (2022). https://doi.org/10.1007/s41365-022-01072-4A new method for position-sensitive measurement of beta surface contamination
. Nucl. Sci. Tech 28, 23 (2017). https://doi.org/10.1007/s41365-016-0176-5Novel Organotin-Loaded Plastic Scintillators Toward Gamma Spectroscopy Applications
, in IEEE Transactions on Nuclear Science. 69 (9), 2089-2094, (2022). https://doi.org/10.1109/TNS.2022.3193399Studies of detector cells for a hadronic calorimeter based on plastic scintillators
. Radiat Detect Technol Methods. 2, 22 (2018). https://doi.org/10.1007/s41605-018-0051-5A preliminary simulation study of influence of backsplash on the plastic scintillator detector design in HERD experiment
. Radiat Detect Technol Methods. 5, 332-338 (2021). https://doi.org/10.1007/s41605-021-00245-wNeutron/gamma discrimination performance test for self-developed plastic scintillation detectors[J]
. NUCLEAR TECHNIQUES. 46(03):JUNO-TAO design, prototype and its impact for JUNO physics
. PoS EPS-HEP2023 (2024). p. 192.https://doi.org/10.22323/1.449.0192Design and Implementation of TAO DAQ System
. https://arxiv.org/pdf/2409.05522TAO—The Taishan Antineutrino Observatory
. Instruments. 6(4) (2022), p. 50. https://doi.org/10.3390/instruments6040050Overview of the JUNO-TAO detector
. Nucl. Instrum. Meth. A. 1048 (2023), p.JUNO Conceptual Design Report
. physics.ins-det. arXiv:1508.07166 (2015). https://doi.org/10.48550/arXiv.1508.07166Neutrino Physics with JUNO
. J. Phys. G. 43, 3 (2016).https://doi.org/10.1088/0954-3899/43/3/030401JUNO physics and detector
. Prog. Part. Nucl. Phys. 123,Sub-percent precision measurement of neutrino oscillation parameters with JUNO Chin
. Phys. C 46(12) (2022), p.Mapping reactor neutrino spectra from TAO to JUNO
. Phys. Rev. D 102,Design optimization of plastic scintillators with wavelength-shifting fibers and silicon photomultiplier readouts in the top veto tracker of the JUNO-TAO experiment
. Nucl. Sci. Tech. 34, 7 (2023). https://doi.org/10.1007/s41365-023-01263-7Study in the optical performance of plastic scintillator with WLS fiber
. JINST. 18, 04 (2023). https://doi.org/10.1088/1748-0221/18/04/T04002Performance of compact plastic scintillator strips with wavelength shifting fibers using a photomultiplier tube or silicon photomultiplier readout
. Nucl. Sci. Tech. 34, 2 (2023). https://doi.org/10.1007/s41365-023-01175-6Temperature characterization of scintillation detectors using solid-state photomultipliers for radiation monitoring applications
. Nucl. Instrum. Meth. A. 620, 351-358 (2010). https://doi.org/10.1016/j.nima.2010.03.141Detailed Studies of Light Transport in Optical Components of Particle Detectors
.Characterization of VUV4 SiPM for liquid argon detector
. JINST. 16,Study of Silicon Photomultiplier Performance at Different Temperatures
. Nucl. Instrum. Meth. A 997 (2021) p.Characterization of two SiPM arrays from Hamamatsu and Onsemi for liquid argon detector.Nucl
. Instrum. Meth. A. 1053,Amplifier circuit for a silicon-photomultiplier-coupled plastic scintillator detector
. Nuclear Techniques (in Chinese) 47,Performance of a scintillation detector array operated with LHAASO-KM2A electronics
. Exp. Astron. 45, 363-377 (2018). https://doi.org/10.1007/s10686-018-9588-zA new large area MCP-PMT for high energy detection
. Sci. Rep. 13, 20436 (2023). https://doi.org/10.1038/s41598-023-47818-xA new design of large area MCP-PMT for the next generation neutrino experiment
. Nucl. Instrum. Meth. A. 695(11) 113-117(2012). https://doi.org/10.1016/j.nima.2011.12.085MuGrid: A scintillator detector towards cosmic muon absorption imaging
. Nucl. Instrum. Meth. A. 1042,Precise measurement of attenuation length of the JUNO liquid scintillator
. Radiat. Detect. Technol. Methods. 4, 312-318 (2020). https://doi.org/10.1007/s41605-020-00185-xAttenuation length measurements of a liquid scintillator with LabVIEW and reliability evaluation of the device
. Chinese Phys. C 37Performance of a plastic scintillation fiber dosimeter based on different photoelectric devices
. Nucl. Sci. Tech. 32, 120 (2021). https://doi.org/10.1007/s41365-021-00965-0The authors declare that they have no competing interests.

