Introduction
Currently, more than 80% of energy [1] is produced from non-renewable resources, such as gas, coal, and oil. Energy shortages and environmental pollution are two major problems in social development. Increasing attention has been given to nuclear fusion energy because of its advantages such as cleanliness and abundant raw materials. Nuclear fusion power reactors can potentially produce large amounts of clean energy [2], which can solve the energy shortage problem faced by humans. However, harnessing fusion energy is difficult [3]. The behavior of materials inside the reactor determines the success or failure of nuclear technology [4]. Reduced-activation ferritic/martensitic (RAFM) steels are promising structural materials for fusion-power-reactor blanket modules because of their high creep resistance, high fatigue resistance, good weldability, high strength, high toughness, low activation, high swelling resistance, and high neutron irradiation embrittlement resistance [5-9]. Considering the design and function of test blanket modules (TBMs) of a clear fusion energy reactor, structural steels will function at 300–550 ℃ for a long time [10-12]. Therefore, when a nuclear fusion energy reactor begins operation, the structural steels will operate at a range of temperatures (25–650 ℃). The anisotropy of polycrystalline materials can create inhomogeneities at the grain scale (mesoscale), even under the same deformation conditions [13]. Thus, exploring the deformation behavior at different temperatures of RAFM steels at the grain scale (mesoscale) is very important for engineering mechanical design.
The crystal-plasticity finite element method (CPFEM) can reflect the microstructure of polycrystalline materials by combining the finite element and crystal plasticity theories [14, 15]. It can consider various deformation mechanisms at the grain scale (mesoscale), such as deformation twinning, dislocation slip, and phase transition [16-18]. Moreover, it can explore the plastic deformation mechanisms of polycrystalline materials at the microstructural level. Recently, the relationships between the non-uniform evolution of microstructures and macroscopic homogenization mechanical properties have been widely explored using the CPFEM [19-23]. Tasan et al. [24] explored strain localization and damage by combining the CPFEM and deformation experiments on dual-phase steel. Zhao et al. [22] investigated the evolution of face-centered-cubic polycrystalline plastic anisotropy during biaxial loading using the CPFEM. Abdolvand et al. [21] developed a crystal-plasticity finite element code to explore the deformation behavior of hexagonal close packed materials. Modeling is a very important task when using the CPFEM for simulation. To the best of our knowledge, every material has a critical window, that is, a minimum statistical representative window (MSRW), that can be used as the lowest limit of a representative volume element (RVE) [25, 26]. At the MSRW, a material exhibits macroscopic homogeneity during deformation experiments. Thus, the “average” properties of a material can be studied only if a sufficiently large model is built. Thus, the relationship between the microstructure (at the mesoscale) and mechanical properties (at the macroscale) can be explored. However, determining the MSRW is a difficult task [27-29]. Koohbor et al. [28] used an experimental method to determine the RVE size in woven composites, observing that if the average local strain of the selected window is the same as the global strain, the size of the selected window is identified as the MSRW, that is, the RVE size. Using numerical experiments and statistical analyses, Mirkhalaf et al. [29] developed a method for determining the RVE size in heterogeneous amorphous materials. Although methods for determining the RVE size have been proposed in the above-mentioned studies, they are difficult to use in practice. Fortunately, Tang et al. [30] proposed a universal law for plastic deformation, that is, the lognormal strain distribution during plastic deformation. Macroscopic homogeneity during deformation experiments in the sample window of interest can be quantitatively measured using lognormal distribution statistics. The larger the coefficients of determination, the better the macroscopic homogeneity during deformation. Thus, the strain distribution in the deformation process of a material should be studied to establish the finite element model using the CPFEM. The macroscopic homogeneity on the sample window scale has been discussed by Zhi et al. [31], Chen et al. [32], Dhekne et al. [33], and Peng et al. [34] using strain distribution during deformation. Although the strain distribution during deformation has been studied both through experiments and simulations, the temperature has been limited to room temperature (R.T.), and the effect of temperature on the strain distribution during deformation has not been studied so far. Moreover, no study has been conducted on the strain distribution of RAFM steel, either through experiments or simulations. Thus, the effect of temperature on the strain distribution of RAFM steel during deformation should be explored to establish a finite element model using the CPFEM in future research.
In this study, uniaxial tensile tests combined with digital image correlation (DIC) were used to explore the effect of the test temperature on the strain (eyy) distribution of CLF-1 steel during deformation. The evolution of the strain statistics and strain localization with increasing temperature were analyzed in detail. These results provide a significant reference for the mechanical engineering design of fusion energy reactors.
Material and method
Material
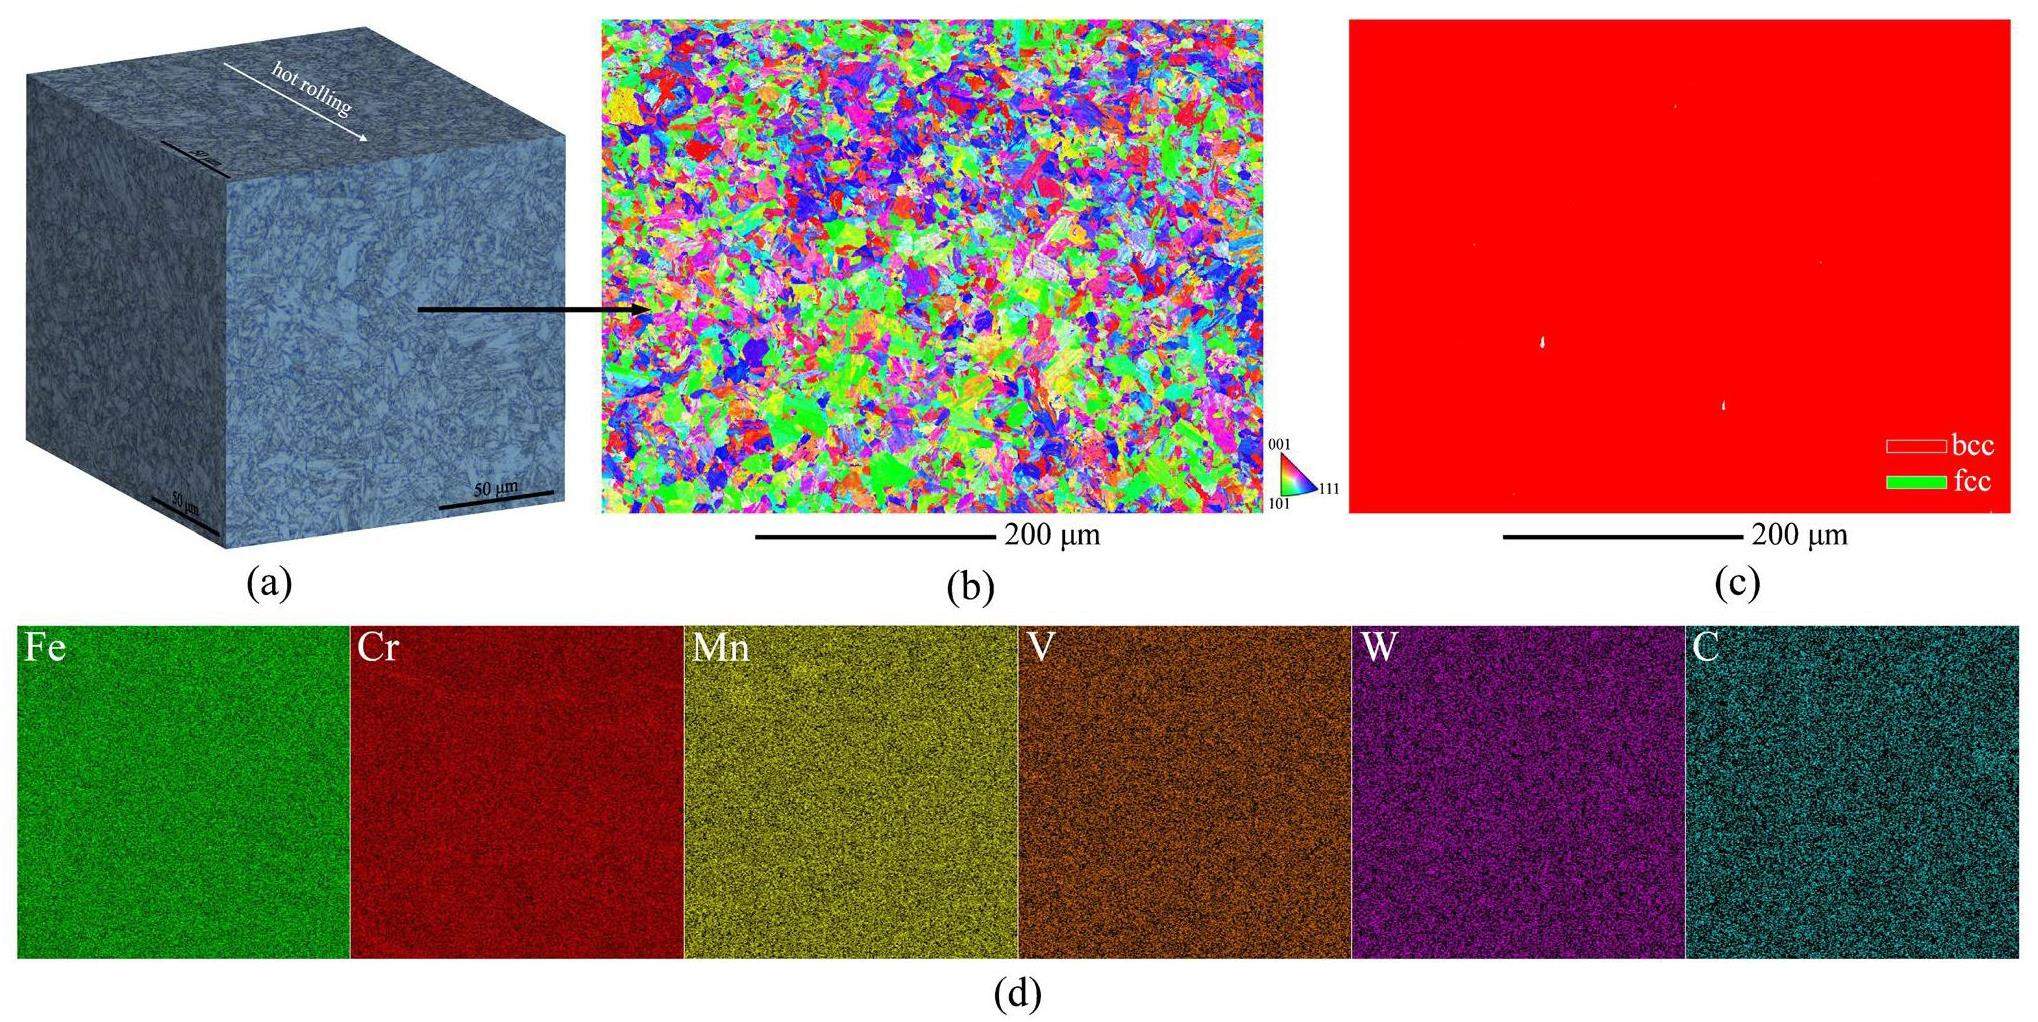
The CLF-1 steel used in this study was produced using a vacuum induction method. The studied steel was manufactured from a 5-t ingot. The measured chemical composition of the steel was 8.49 Cr-1.50 W-0.22 V-0.09 Ta-0.50 Mn-0.13 C-Fe in wt%. Finally, the steel was supplied as plates that were hot-rolled to a thickness of 30 mm. The as-received (AR) steel was heat-treated via normalization and tempering (NT). The normalization process was performed at 980 ℃ for 3.6 ks, and the cooling method was water cooling; subsequently, the tempering process was performed at 740 ℃ for 7.2 ks, the cooling method was air cooling. The microstructure revealed equiaxed grains, and the prior austenite grain size was approximately 14 μm (Fig. 1(a, b)). The studied steel had an all martensitic structure, as depicted in Fig. 1(a–c). The elemental distributions are presented in Fig. 1(d).
Uniaxial tensile test
Typically, tensile tests of irradiated specimens use small tensile specimens. For further comparison with the tensile test data of irradiated specimens, miniature flat tensile specimens, which were consistent with “small tensile materials” in the SINQ Target Irradiation Program (STIP) [35-39], were fabricated from plate as shown in Fig. 2. The specimens had a geometry of 5.0 mm gauge length, 0.40 mm thickness, and 1.00 mm width. Before the tensile tests, the dimensions of each specimen were measured precisely.

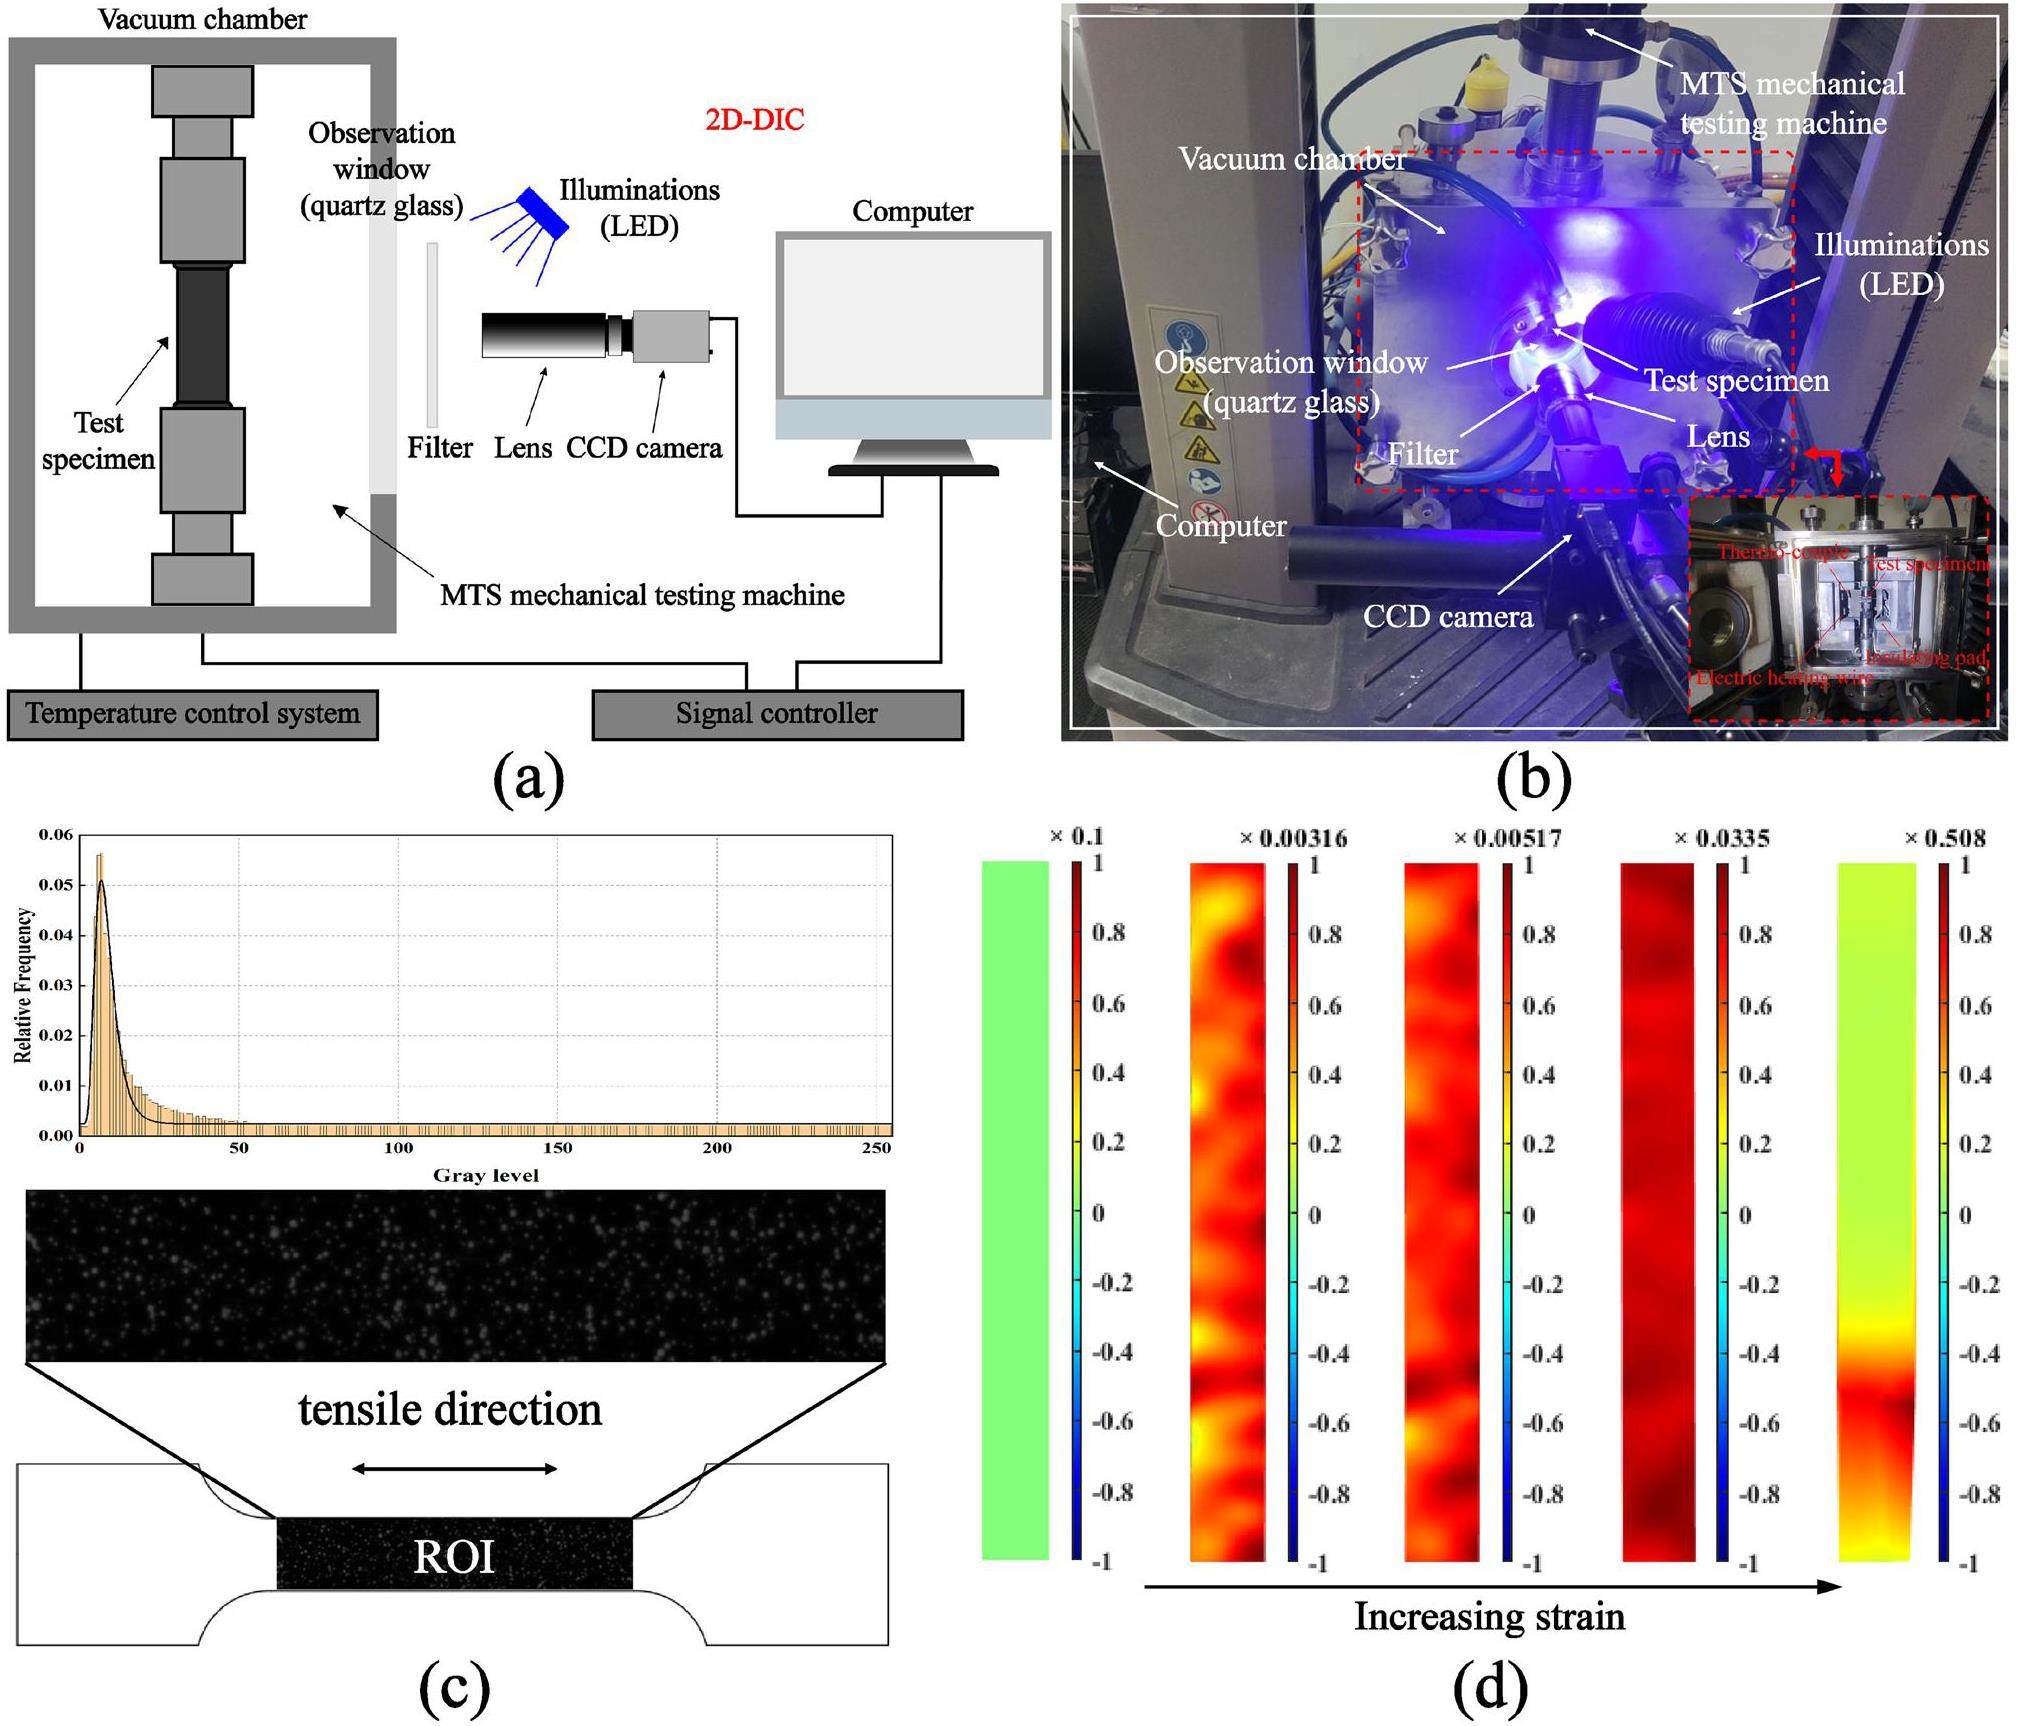
Uniaxial tensile tests were performed on an MTS mechanical testing machine with a capacity of 10-kN force, which was equipped with a video extensometer. The experiments were conducted in a vacuum, the strain rate was set to 1×10⁻³ s-1, and the test temperature range was 25–650 ℃. Before the tensile test, the specimens were maintained at a set temperature for 3.6 ks. The accuracy of the force measurements was within ±0.1%. DIC [40, 41] was used to measure the full-field displacement (or full-field strain). The DIC system, as depicted in Fig. 3(a, b), consisted of one LED light and one FLIR camera with a resolution of 0.006 mm/pixel equipped with a lens (Schneider-KREUZNACH). The speckles shown in Fig. 3(c) were formed using spray painting [42]. The image-acquisition rate was 1 Hz. A schematic of the full-field strain in the form of a contour plot during tensile testing is shown in Fig. 3(d). The strain (eyy) discussed in this paper was along the tensile direction. Experiments were performed twice at each temperature to ensure reproducibility.
Strain error evaluation
The specimen surface under zero-strain conditions was photographed twice to evaluate the errors. Ideally, displacement should be null under zero-strain conditions. However, inevitable micro-movements of the experimental components would result in micro-displacement during an actual experiment. The micro-strain generated by this micro-displacement is considered an error. This error consists of systematic and random errors. "Accuracy" reflects systematic errors, whereas "precision" reflects random errors [43]. The mean absolute error (MAER) and standard deviation of error (SDER) are computed using Eqs. (1) and (2) [44] to represent systematic and random errors, respectively.
Results and discussion
Tensile property
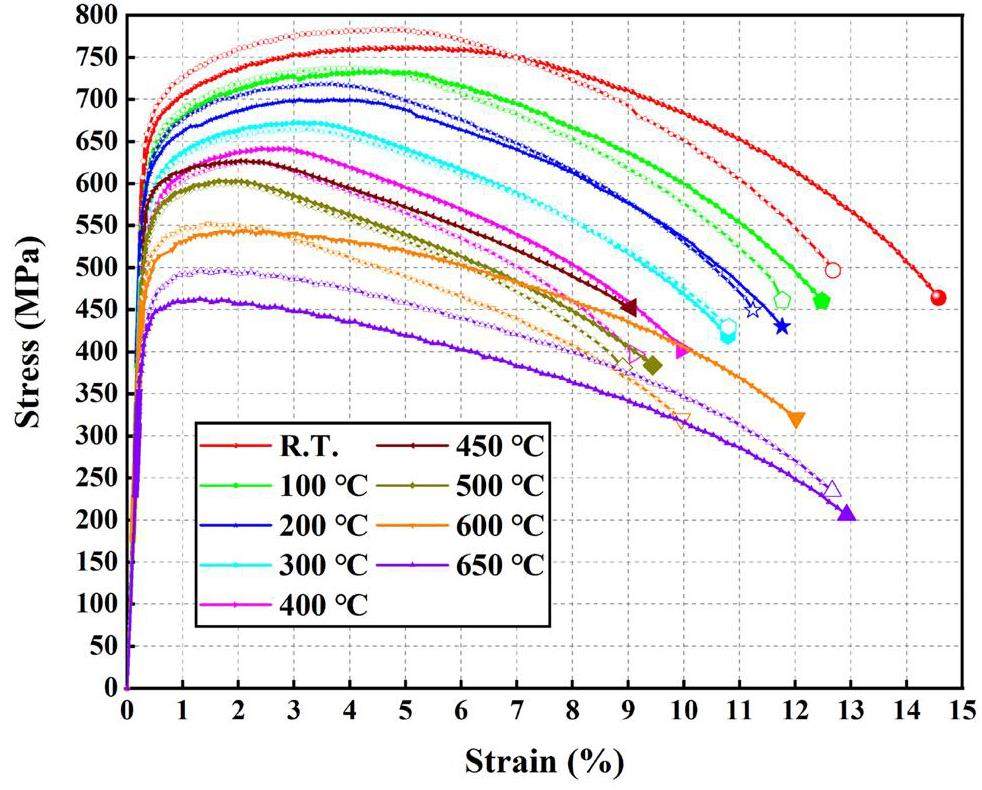
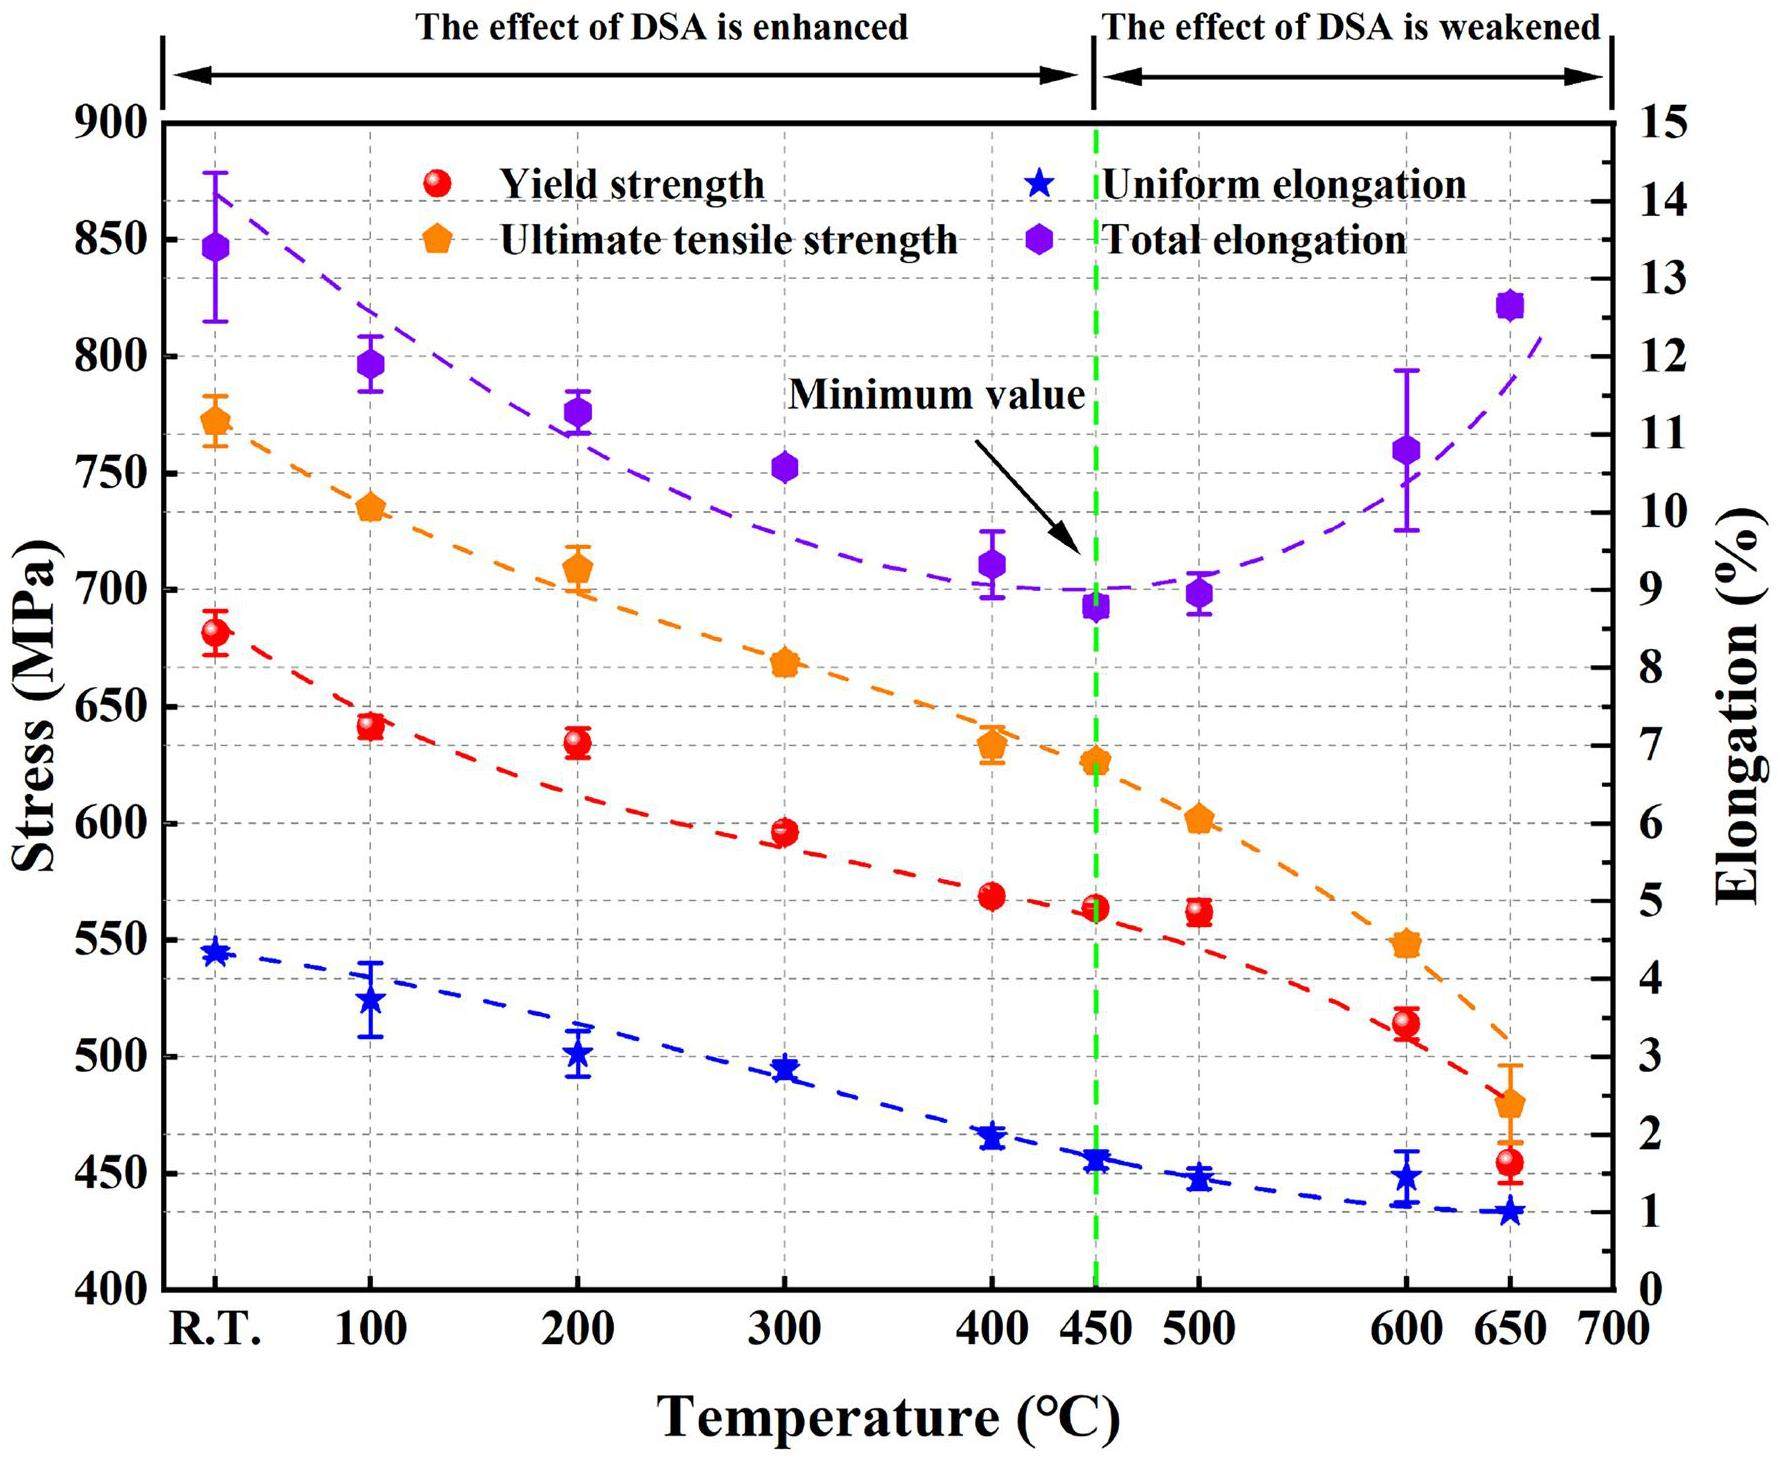
The engineering stress–strain curves in the uniaxial tensile tests are shown in Fig. 4. The documentation revealed a narrow scattering in the repeated uniaxial tensile tests. The ultimate tensile strength (UTS), 0.2% yield strength (YS), uniform elongation (UE), and total elongation (TE) of the studied steel at 25–650 ℃ are shown in Fig. 5. As the test temperature increased, the UTS, YS, and UE decreased, whereas the trend of the TE was different. The TE curve reached its lowest level when the temperature was approximately 450 ℃. This trend was consistent with other previous findings [46-48]. Notably, the YS and UTS changed with increasing temperature and had plateaus, whereas the TE changed with increasing temperature to a minimum value. This phenomenon was attributed to dynamic strain aging (DSA) [49-51]. DSA, which can be attributed to the interaction between mobile dislocations and diffusing solute atoms [50, 52], depends on the temperature and strain rate during uniaxial tensile tests, which control the diffusion of solute atoms and mobile dislocations, respectively. At 200–450 ℃, the reduction in the YS and UTS with increasing test temperature was retarded, namely, the above-mentioned plateaus, which could be attributed to DSA-induced hardening. The reason for the existence of the minimum TE was DSA-induced embrittlement.
Strain distribution evolution during deformation
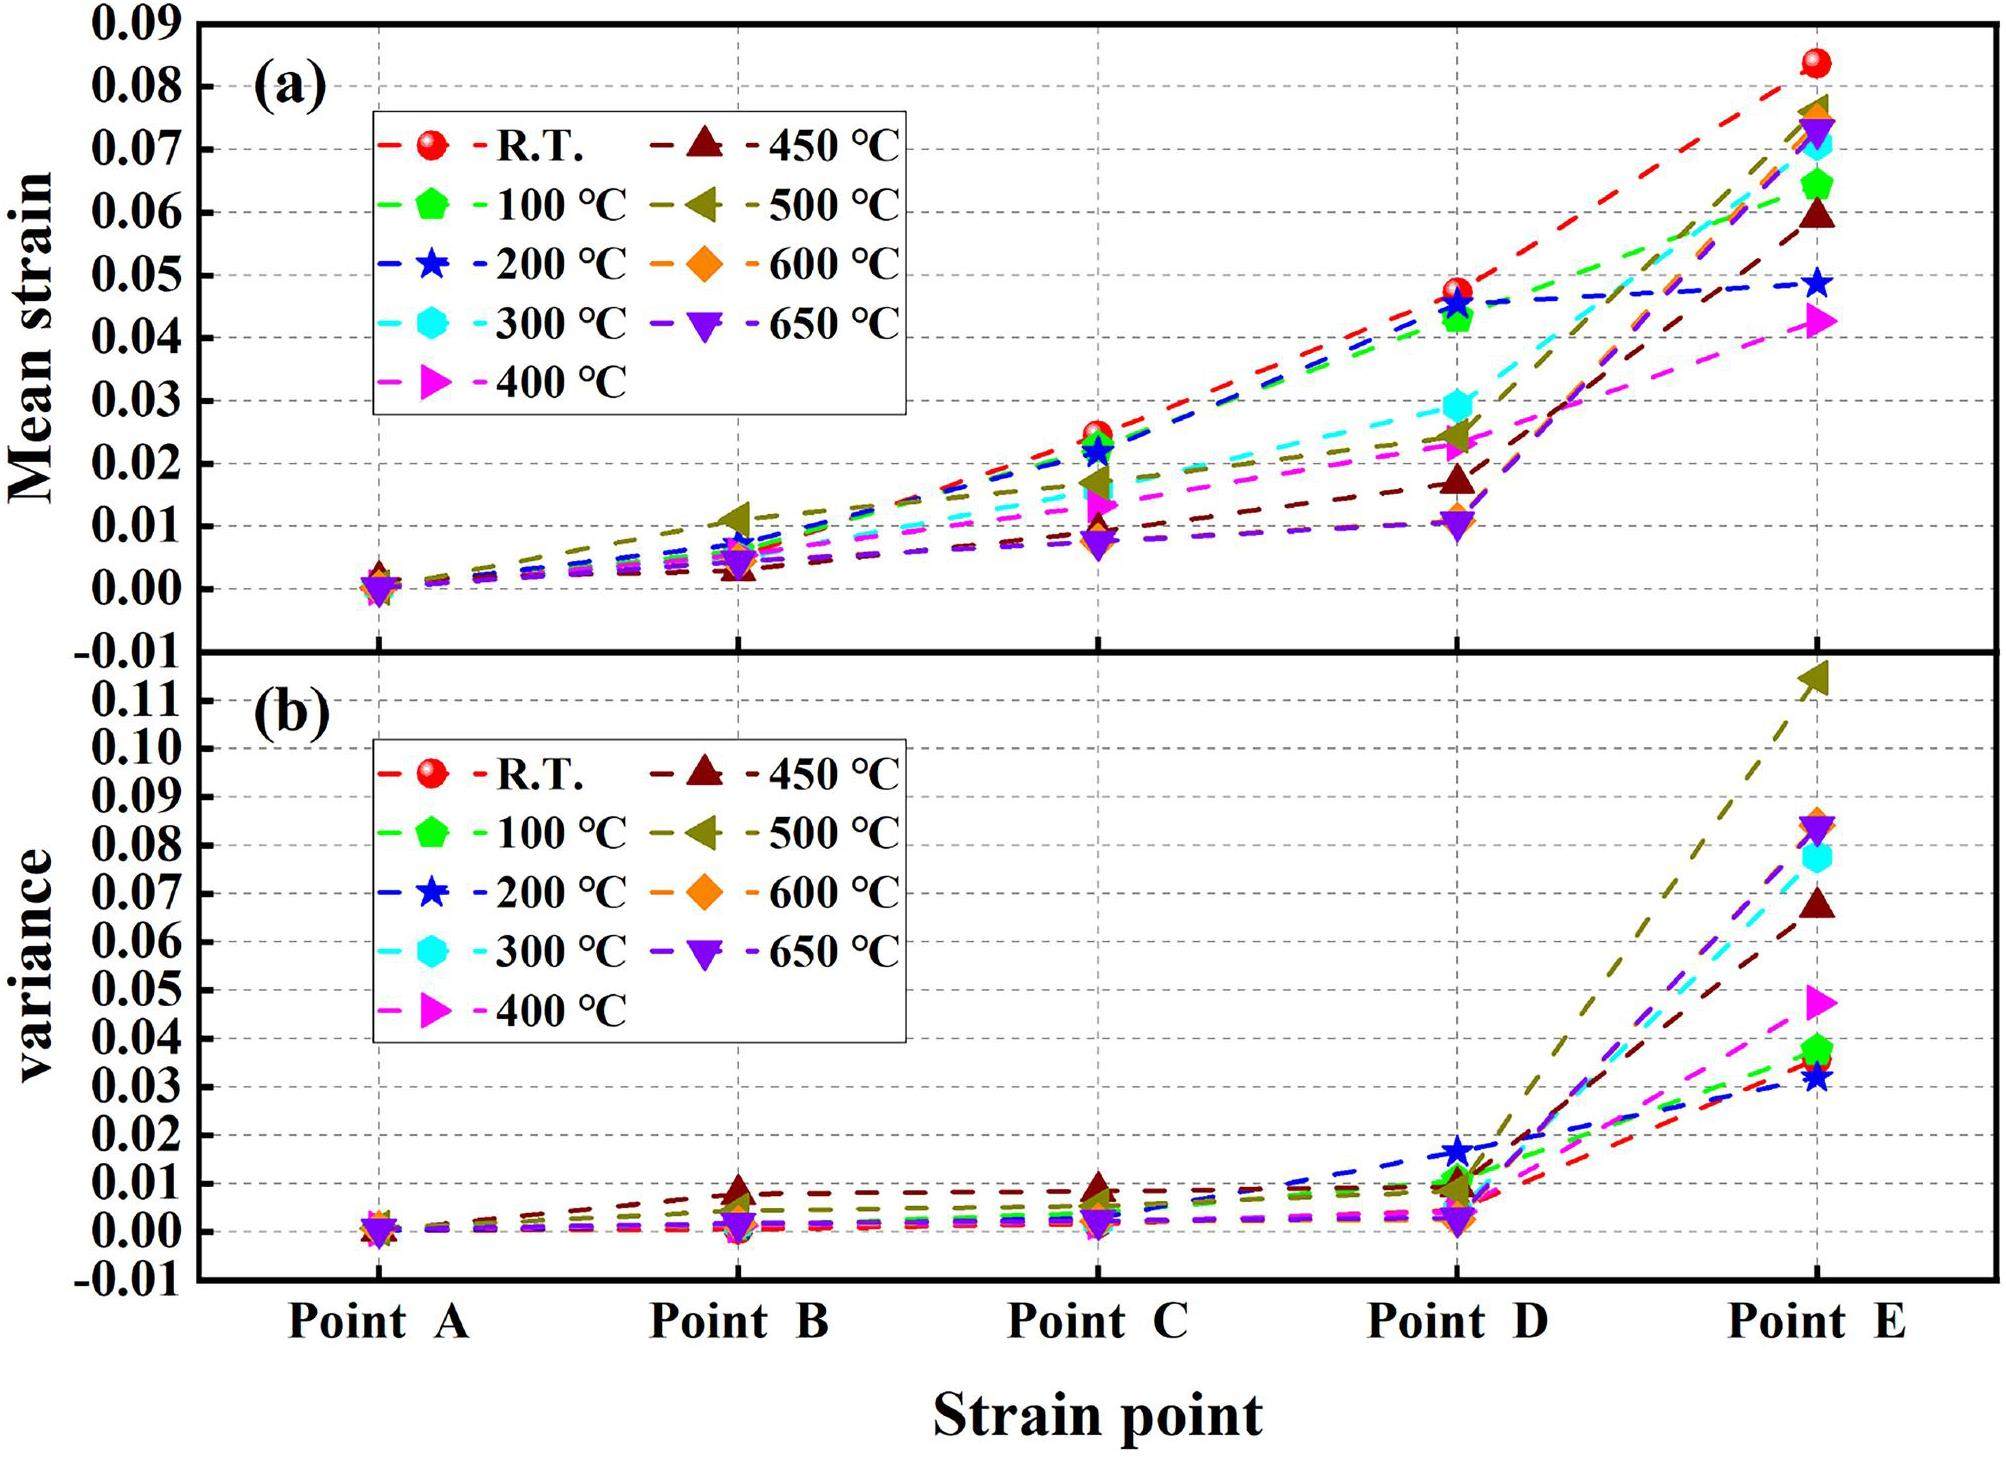
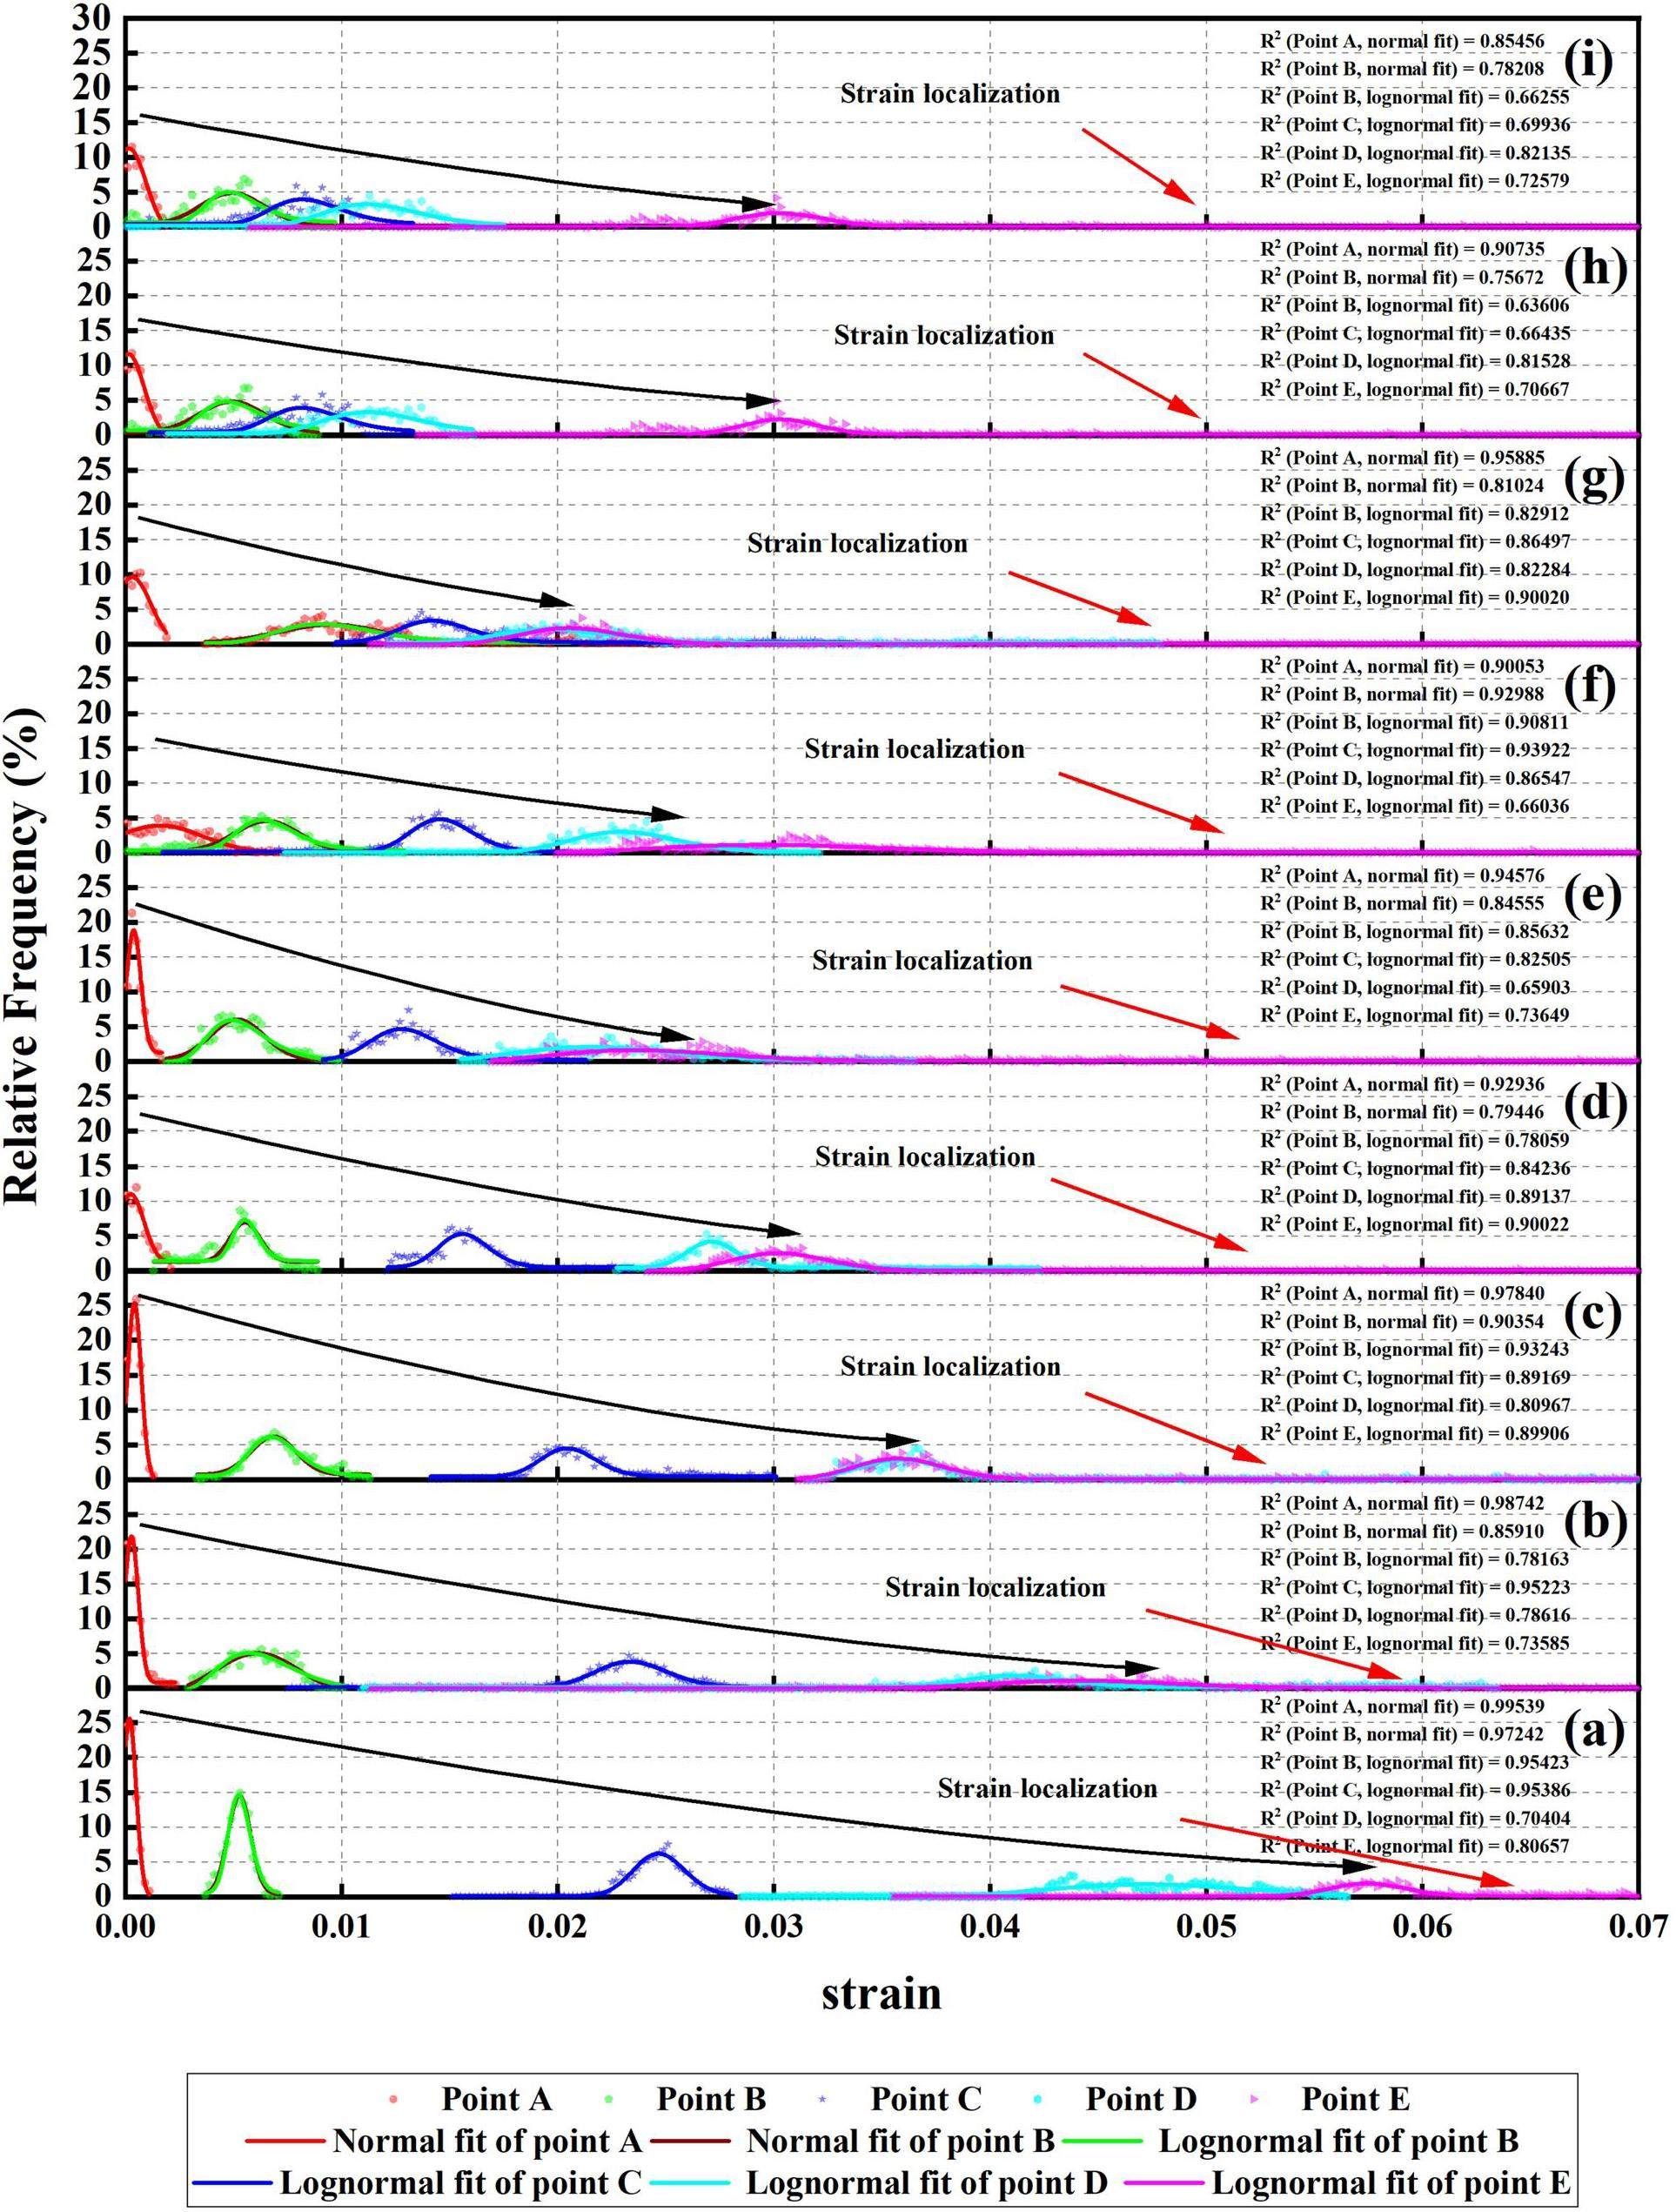
A schematic of the engineering stress–strain curve is shown in Fig. 6. The curve was divided into three regions: the elastic-dominant region (region 1), elastic–plastic transition region (region 2), and plastic-dominant region (region 3). The statistics of the normalized strain (eyy) distribution at points A, B, C, D, and E are shown in Fig. 7. Points A, B, C, D, and E were before the elastic limit, near the YS, between the YS and UTS, and after the UTS, respectively. The normalized methods were the strain at each point divided by the maximum strain, and the count at each strain interval divided by the total count. The mean strain (eyy) values and variances at the different strain points are shown in Figs. 6 and 7 at different test temperatures are presented in Fig. 8. The mean strain (eyy) gradually increased as the tensile tests progressed, as shown in Fig. 8(a), which was consistent with common sense. The variance also increased gradually as the tensile tests progressed, particularly after reaching the UTS, as depicted in Fig. 8(b), which indicated that the strain localization was enhanced as the tensile test progressed. Additionally, the strain localization was also reflected in the strain distribution statistics, which are elaborated on in the next section.
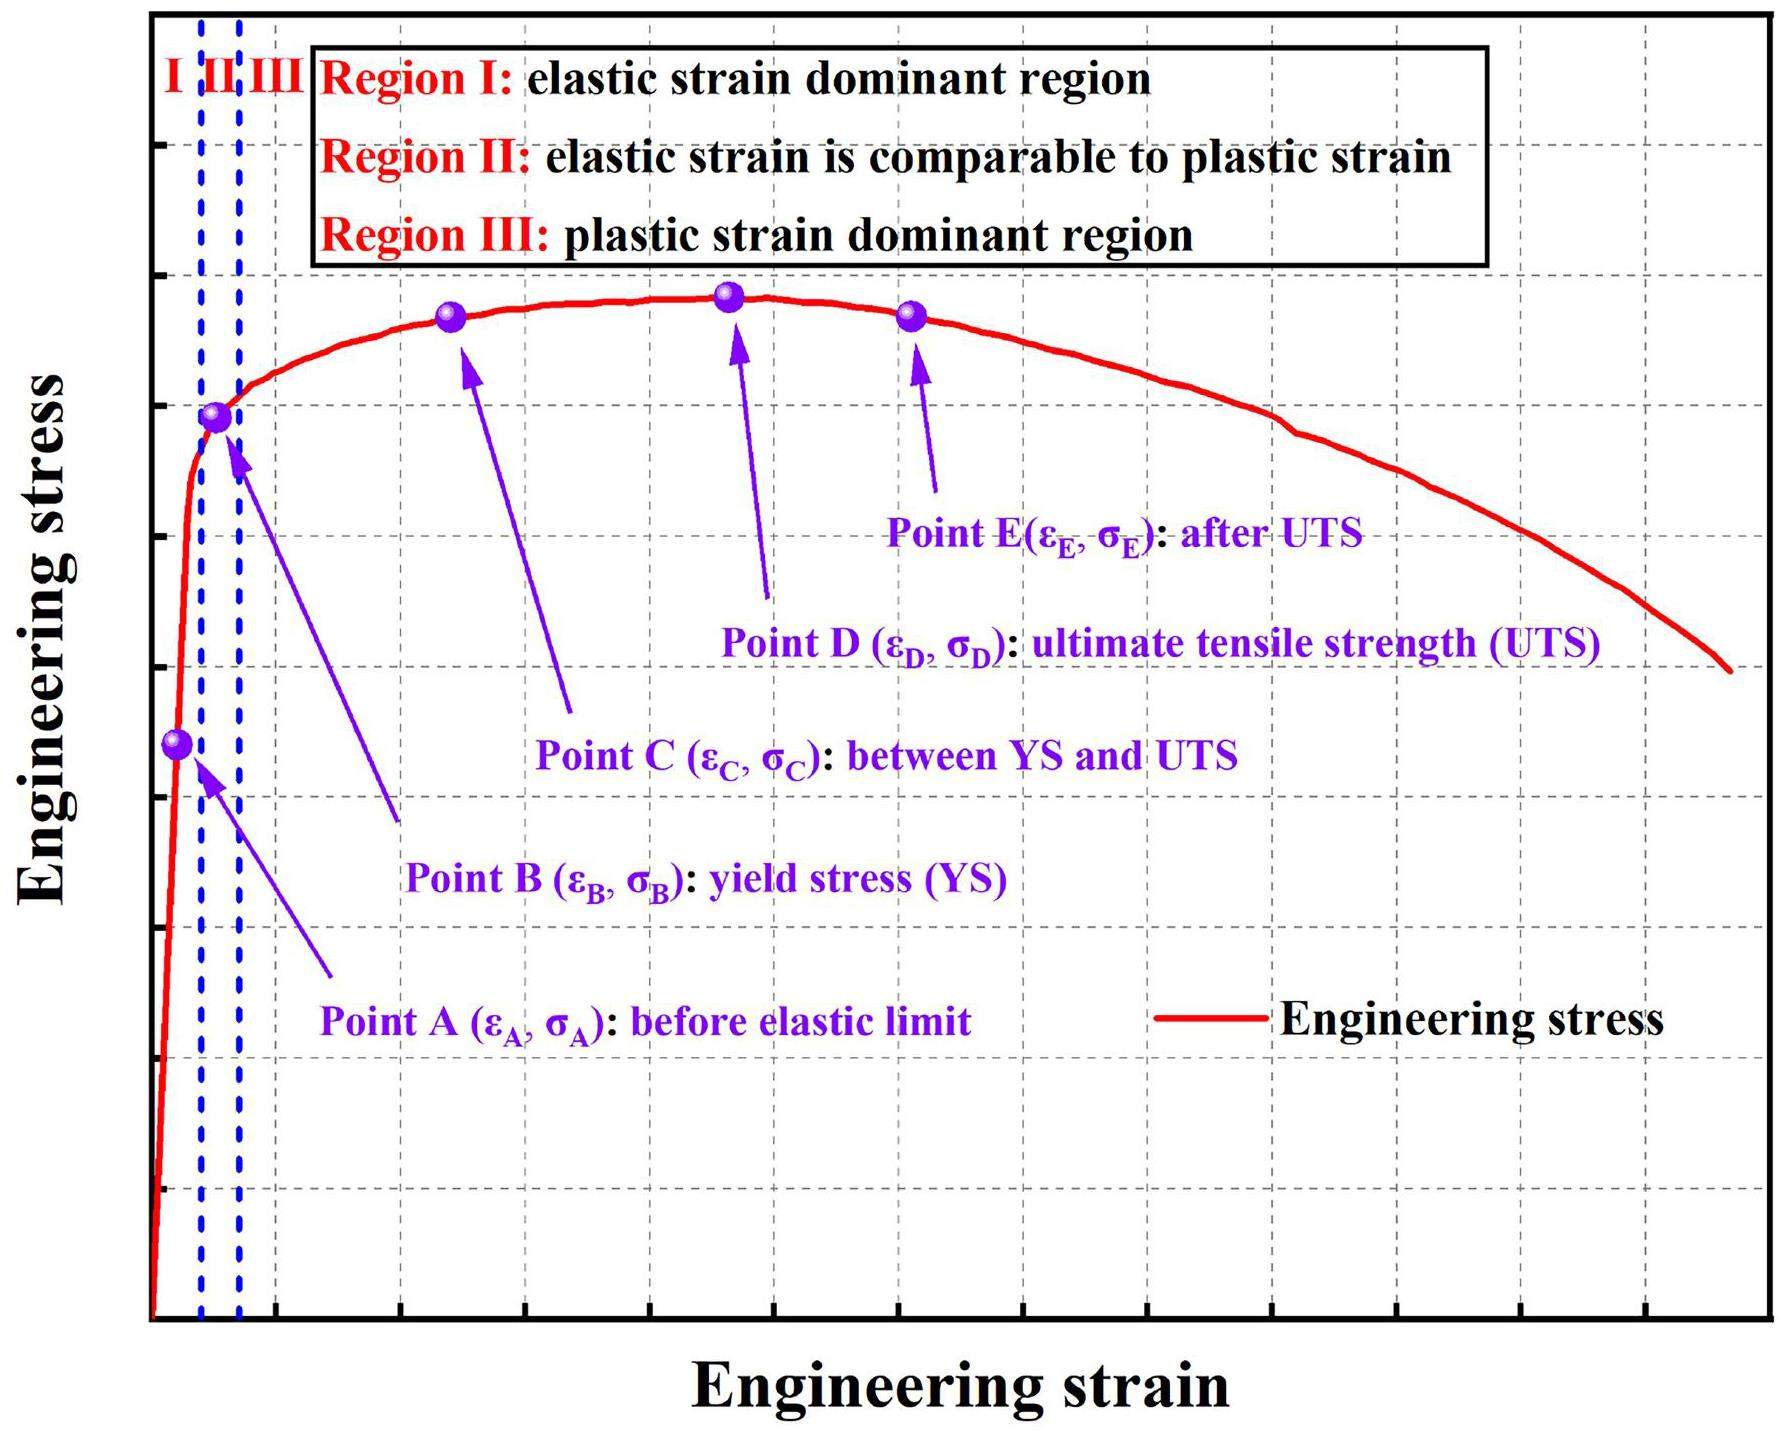
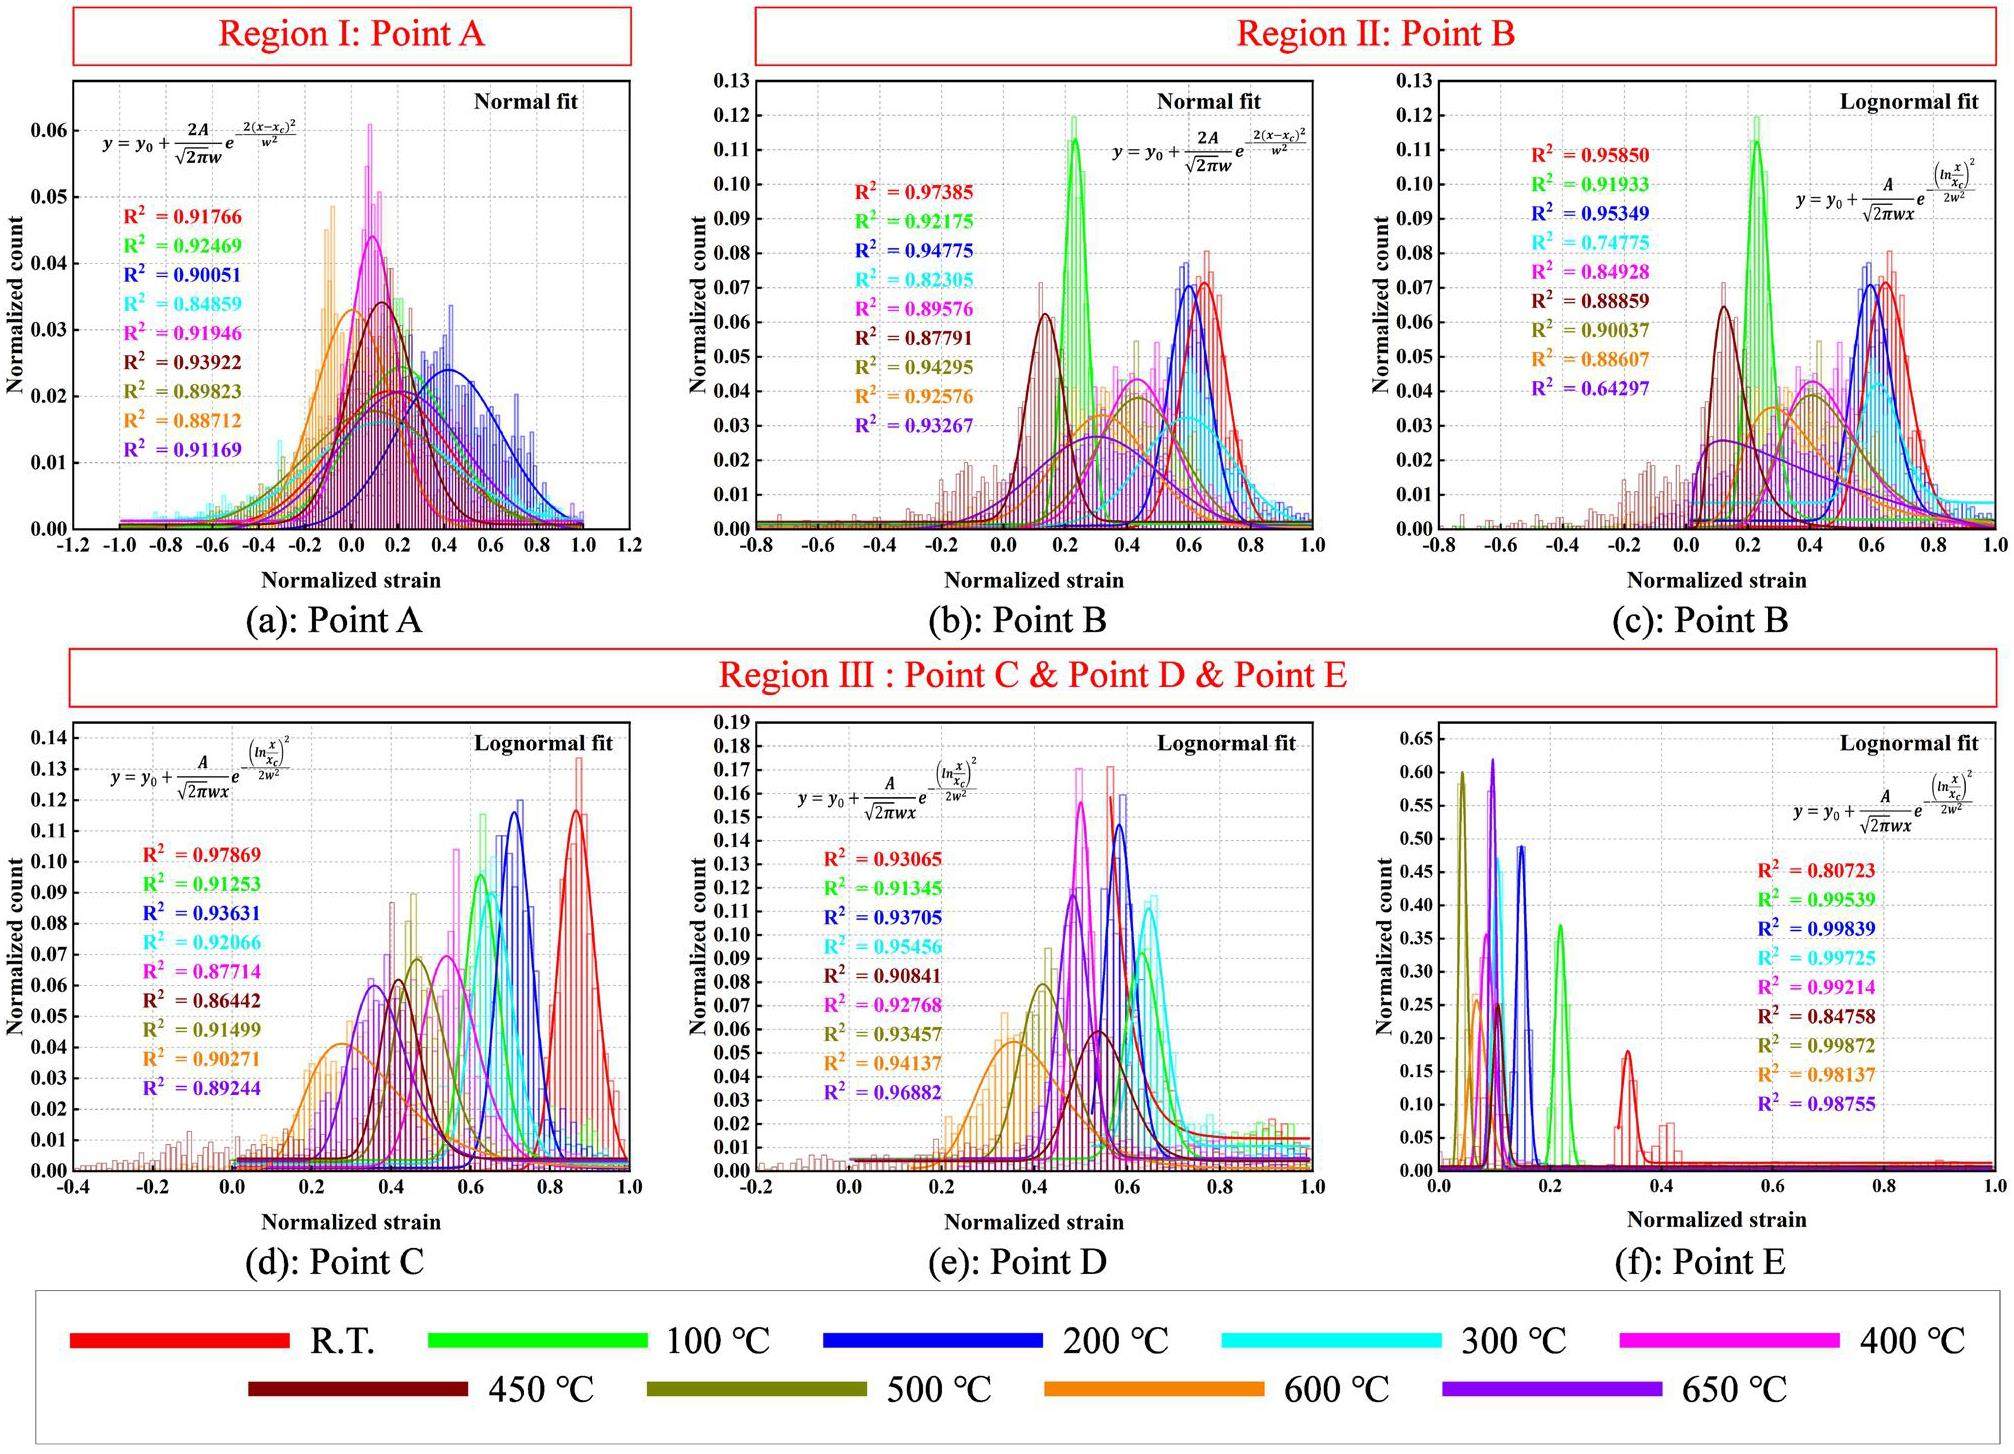
It is widely known that the total strain (ϵtotal) consists of elastic strain (ϵelastic) and plastic strain (ϵplastic), ϵtotal= ϵelastic + ϵplastic. In this study, the total strain (ϵtotal) was incorporated into the elastic strain (ϵelastic) and plastic strain (ϵplastic). We observed that the strain distribution followed a normal distribution in region 1, when the strain distribution followed a lognormal distribution in region 3. However, the strain distribution conformed to both the normal and lognormal distributions in region 2. The normal distribution and lognormal distribution are represented by Eqs. (3) and (4), respectively.
These findings held true for all the test temperatures in this study. To the best of our knowledge, this is the first study to report the statistics of the strain distribution during deformation at different temperatures. At point A, as shown in Fig. 6, the deformation could be considered purely elastic. Thus, the elastic strain obeyed a normal distribution [53] as shown in Fig. 7. At point B, which was in the elastic–plastic transition region, the numerical value of the plastic strain was comparable to the numerical value of the elastic strain. The strain distribution could be fitted using both normal and lognormal distributions owing to the strong interaction between the elastic strain and the occurrence of plastic strain, as depicted in Fig. 7(b,c). Here, the strain accumulation process changed from following additive to following multiplicative. At point C, the numerical value of the elastic strain could not be compared with the numerical value of the plastic strain, that is, the plastic strain dominated; therefore, the strain distribution obeyed a lognormal distribution, as depicted in Fig. 7(d). This was also why previous studies [30, 54] reported that the total strain conforms to a lognormal distribution during deformation. Additionally, the long “tail” in Fig. 7(d–f) corresponds to strong strain localization, which could be used to predict damage initiation [55, 56]. At points D and E, the strain distribution obeyed a lognormal distribution because the plastic strain dominated, as depicted in Fig. 7(e, f).
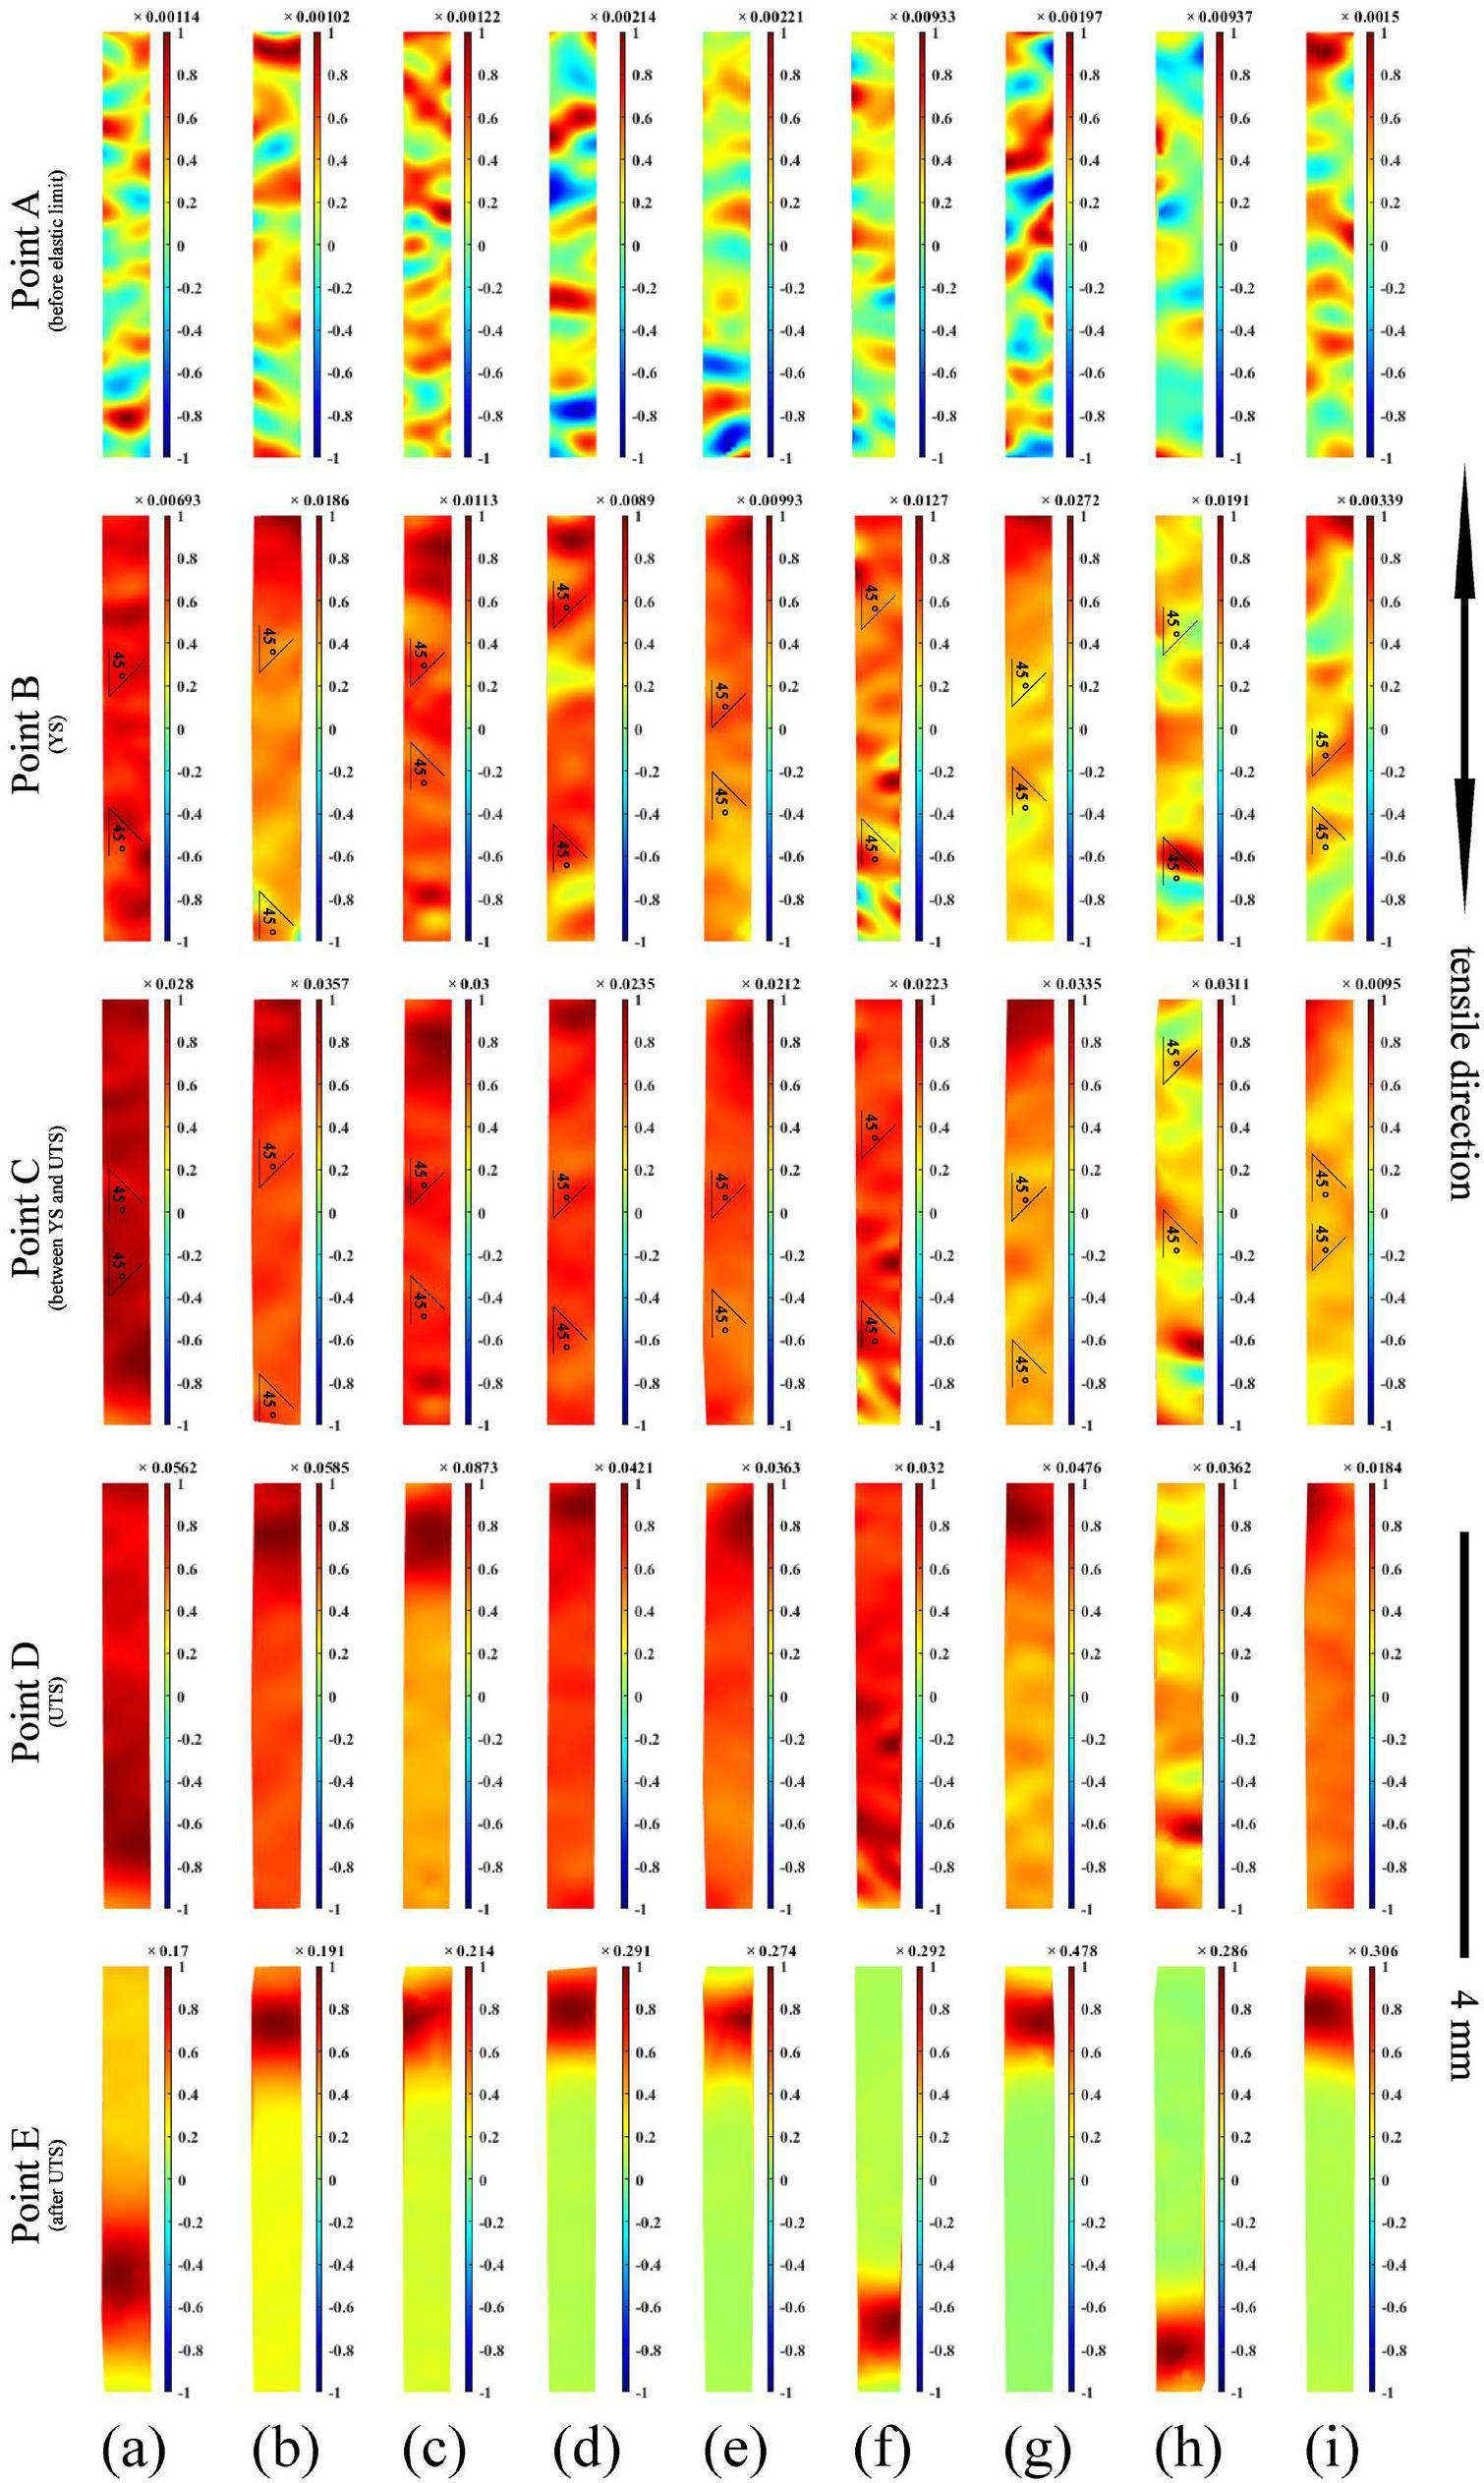
Strain (eyy) maps at points A, B, C, D, and E are shown in Fig. 9. Strain (eyy) maps were cropped to eliminate the edge effect produced during the calculation. Typically, an uneven strain distribution occurs primarily during plastic deformation. However, a significantly uneven strain distribution appeared in the elastic stage (Point A), as shown in Fig. 9. This phenomenon can be attributed to the difference in the soft- and hard-phase deformations of the studied steel, as reported by Li et al. [57]. Significant strain concentration was observed, and strain-concentrated regions were approximately oriented at ±45° along the tensile direction at point B and point C, as shown in Fig. 9. This may be because shear stress had the maximum value at ±45° along the tensile direction. It was consistent with the results reported by Lindfeldt et al. [58], Gong et.al. [59], Wu et al. [60], and Tanaka et al. [54]. However, the strain-concentrated regions were not strictly at ±45 along the tensile direction. The reason for this phenomenon may be the effects of the microstructure, such as the grain boundaries [61-65] and grain orientation [66, 67], which require further exploration. The alternating distributions of the high- and low-strain-concentrated regions in Fig. 9 were caused by the coordinated deformation of the microstructure during the initial stage of plastic deformation. Meanwhile, the strain in each region increased steadily, and the strain-concentrated regions did not expand significantly during uniform plastic deformation compared with those during elastic deformation. This can be attributed to strain-concentrated regions driving the entire uniform plastic deformation of the other regions. Necking occurred in the local strain-concentrated regions during non-uniform plastic deformation at points D and E. The strain was concentrated in the necking region, and the strain in the remaining parts gradually reduced until deformation stopped.
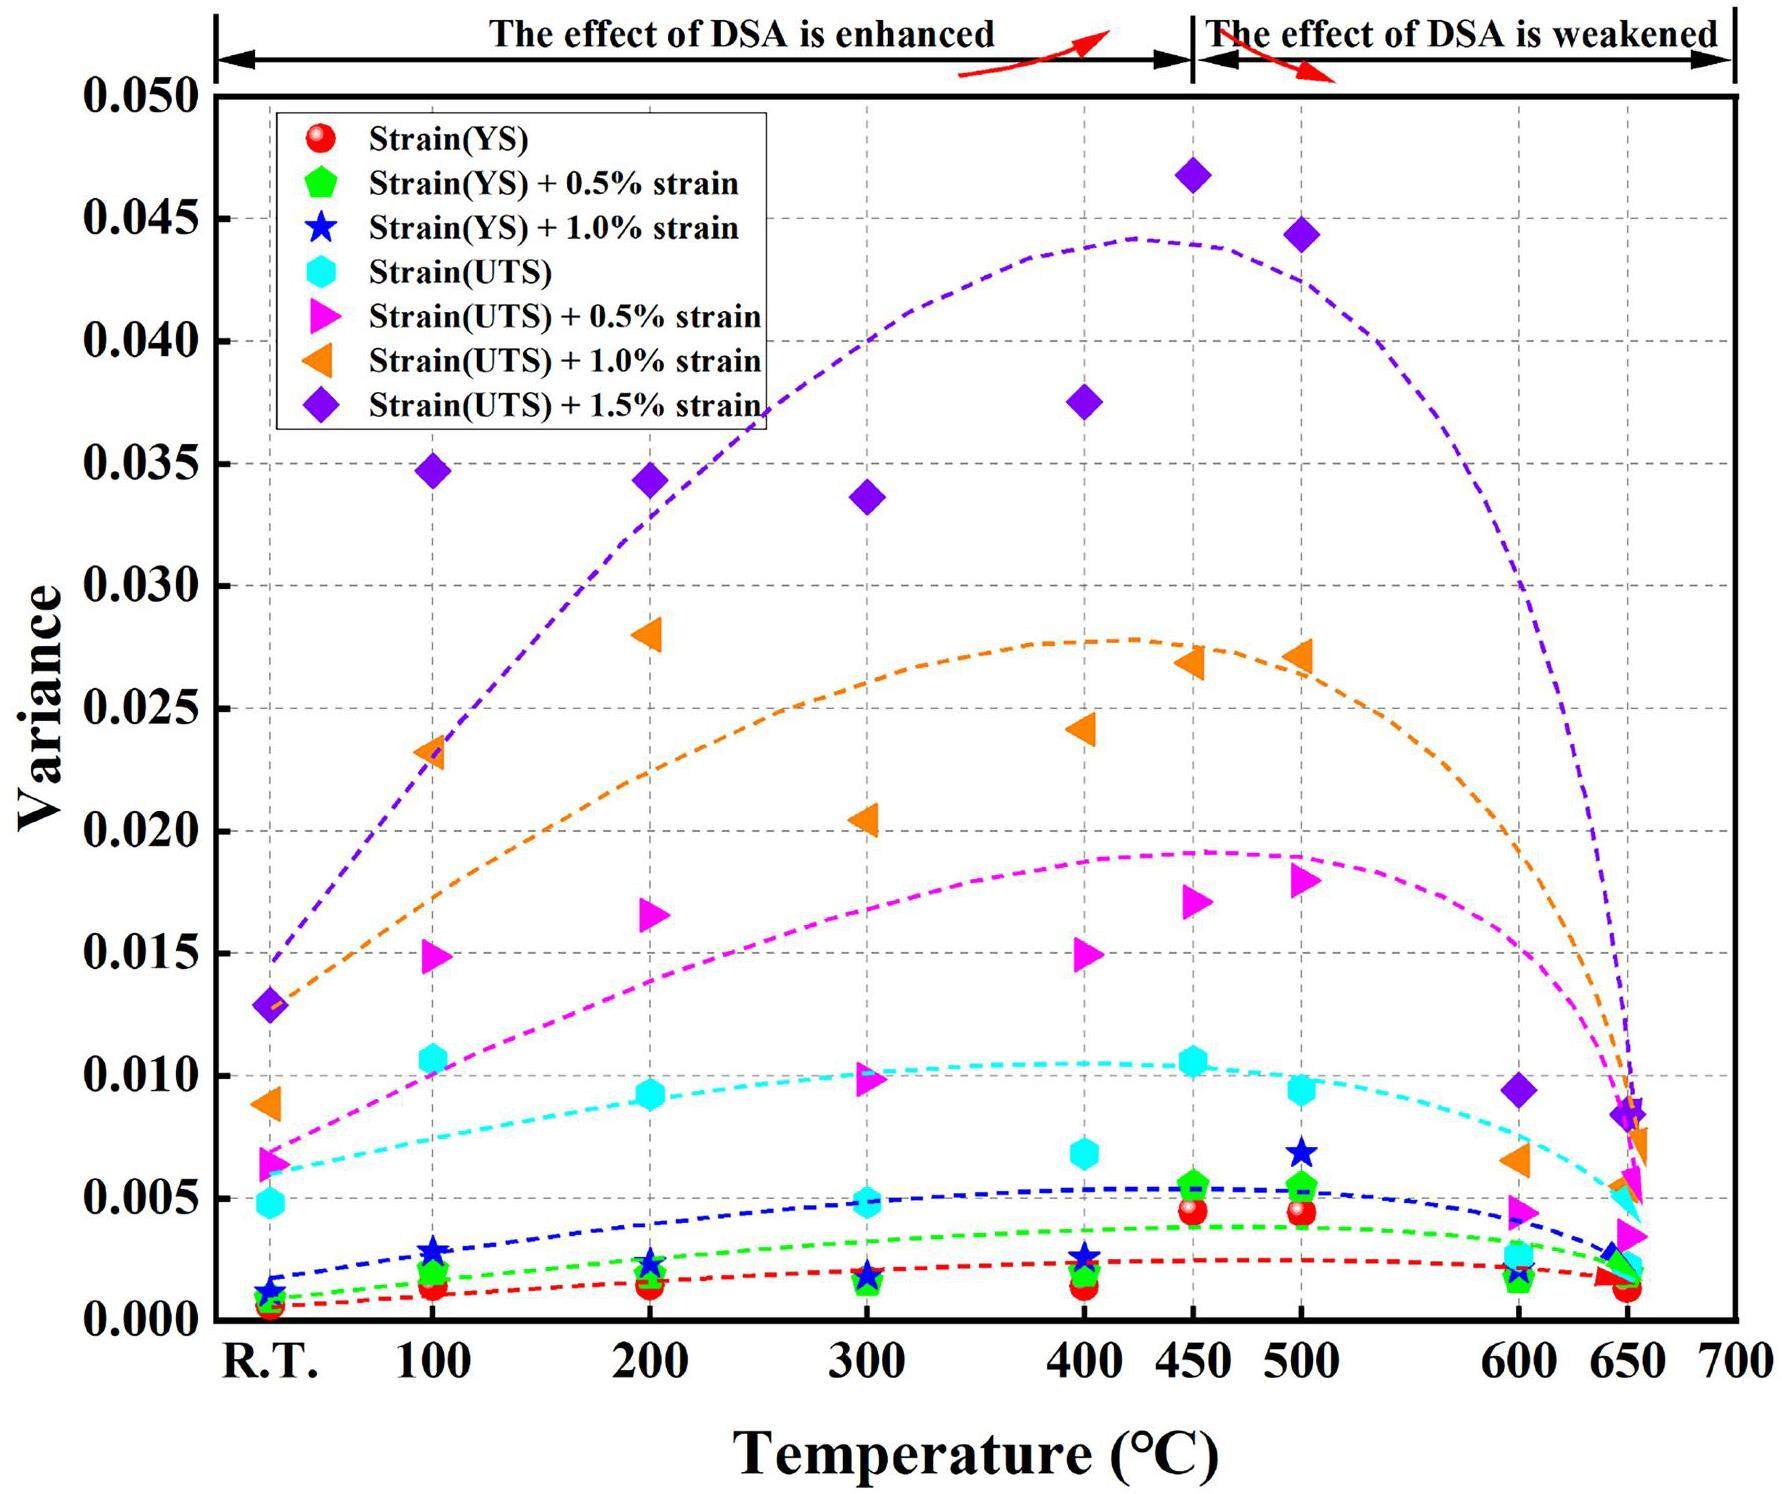
The strain (eyy) distributions at points A, B, C, D, and E at different test temperatures are shown in Fig. 10. The strain (eyy) distribution shifted to the right, the peak value of the strain value of the strain distribution gradually decreased, and the distribution gradually widened with the progress of the tensile tests at all test temperatures, as shown in Fig. 8(a, b). The strain variances in the eight deformation states at 25–650 ℃ are shown in Fig. 11. To the best of our knowledge, the variance and strain localization were positively correlated; that is, the greater the variance, the stronger the strain localization. The strain variance first increased and then decreased with increasing test temperature, reaching a maximum value of approximately 450 ℃ in all deformation states, as shown in Fig. 11. Interestingly, the analysis in Sect. 3.1. A has shown that the decline rate of the YS and UTS increased, and the TE reached the lowest value at approximately 450 ℃ with increasing test temperature owing to the effect of DSA as depicted in Fig. 5. With increasing test temperature, the variance increased; that is, the strain localization was enhanced, whereas the temperature was lower than 450 ℃, possibly because the effect of DSA was enhanced with increasing test temperature. The interaction between the solute atoms and dislocations was enhanced. In contrast, with increasing test temperature, the variance decreased when the temperature was higher than 450 ℃, possibly because the effect of DSA weakened with increasing temperature. The interaction between the solute atoms and dislocations was weakened. We believe that this discovery has general applicability to polycrystalline materials.
Conclusions
The effect of temperature on the strain distribution in the RAFM steel CLF-1 during deformation was explored using a uniaxial tensile test combined with DIC. The results provide a significant reference for mechanical engineering designs. The conclusions are as follows:
Strain localization region is alternately distributed in the direction of ±45° along the tensile direction during plastic deformation because shear stress has a maximum value in the same direction and the coordinated deformation of microstructure within the temperature range from R.T. to 650 ℃.
A universal law of strain distribution exists because of the competition between plastic strain and elastic strain at all temperatures. The total strain obeys a normal distribution because the elastic strain dominates in region 1. The total strain obeys both normal and lognormal distributions because the numerical value of the plastic strain is comparable to the numerical value of the elastic strain in region 2. The total strain obeys a lognormal distribution because the plastic strain dominates in the region 3.
Strain localization has a strong relationship with temperature at the same engineering strain because of the effect of temperature on DSA. The stronger the effect of DSA, the stronger the strain localization. With increasing temperature, the stronger the strain localization at the same strain, the weaker the plasticity, that is, DSA-induced embrittlement, and the slower the strength decline, that is, DSA-induced hardening.
Nuclear fusion and its large potential for the future world energy supply
. Nukleonika. 61, 425-432 (2016). https://doi.org/10.1515/nuka-2016-0070Socioeconomic and environmental impacts of bringing the sun to earth: A sustainability analysis of a fusion power plant deployment
. Energy. 209,Magnetic confinement fusion: a brief review
. Front. Energy. 12, 305-313 (2018). https://doi.org/10.1007/s11708-018-0539-1Recent activities in the field of nuclear materials and nuclear fuels
. J. Nucl. Sci. Technol. 56, 147-149 (2019). https://doi.org/10.1080/00223131.2018.1544940Development of reduced activation ferritic–martensitic steels and fabrication technologies for indian test blanket module
. J. Nucl. Mater. 417, 72-76 (2011). https://doi.org/10.1016/j.jnucmat.2011.02.032Development of nano-structure china low-activation martensitic steel for fusion reactors
. Mater. Lett. 252, 248-251 (2019). https://doi.org/10.1016/j.matlet.2019.06.005Development of reduced activation ferritic/martensitic steels in China
. J. Nucl. Mater. 568,Reduced activation martensitic steels as a structural material for ITER test blanket
. J. Nucl. Mater. 329, 243-247 (2004). https://doi.org/10.1016/j.jnucmat.2004.04.018On the potentiality of using ferritic/martensitic steels as structural materials for fusion reactors
. Nucl. Fusion. 44, 56 (2003). https://doi.org/10.1088/0029-5515/44/1/006Research and development on the china low activation martensitic steel (CLAM)
. J. Nucl. Mater. 367, 97-101 (2007). https://doi.org/10.1016/j.jnucmat.2007.03.236Development of benchmark reduced activation ferritic/martensitic steels for fusion energy applications
. Nucl. Fusion. 57,Preliminary development of a conceptual first wall for demo
. Nucl. Fusion. 60,Three-dimensional local stress analysis on grain boundaries in polycrystalline material
. Int. J. Solids. Struct. 44, 3267-3277 (2007). https://doi.org/10.1016/j.ijsolstr.2006.09.020Nanoindentation behaviour simulation of a polycrystalline NiTi shape memory alloy using the crystal plastic finite element method
. Mater. Today. Commun. 37,Overview of constitutive laws, kinematics, homogenization and multiscale methods in crystal plasticity finite-element modeling: Theory, experiments, applications
. Acta. Mater. 58, 1152-1211 (2010). https://doi.org/10.1016/j.actamat.2009.10.058Hierarchical multiscale crystal plasticity framework for plasticity and strain hardening of multi-principal element alloys
. J. Mech. Phys. Solids. 169,Damask–the düsseldorf advanced material simulation kit for modeling multi-physics crystal plasticity, thermal, and damage phenomena from the single crystal up to the component scale
. Comp. Mater. Sci. 158, 420-478 (2019). https://doi.org/10.1016/j.commatsci.2018.04.030Microscale modelling of the deformation of a martensitic steel using the voronoi tessellation method
. J. Mech. Phys. Solids 113, 35-55 (2018). https://doi.org/10.1016/j.jmps.2018.01.009Modelling of mechanical response and microstructure evolution of EA4T steel during hot compression using the improved crystal plasticity finite element method
. J. Mater. Eng. Perform. 33, 2940-2951 (2024). https://doi.org/10.1007/s11665-023-08176-xCrystal plasticity finite element simulations of pyramidal indentation in copper single crystals
. Acta. Mater. 55, 55-68 (2007). https://doi.org/10.1016/j.actamat.2006.07.018Incorporation of twinning into a crystal plasticity finite element model: Evolution of lattice strains and texture in zircaloy-2
. Int. J. Plasticity. 27, 1721-1738 (2011). https://doi.org/10.1016/j.ijplas.2011.04.005Evolution of face-centered-cubic polycrystalline plastic anisotropy under biaxial loading by crystal plasticity finite element method
. Eng. Computation. 37, 895-908 (2020). https://doi.org/10.1108/EC-12-2018-0573Simulation of polycrystalline aluminum tensile test with crystal plasticity finite element method
. T. Nonferr. Metal. Soc. 17, 1412-1416 (2007). https://doi.org/10.1016/S1003-6326(07)60286-6Strain localization and damage in dual phase steels investigated by coupled in-situ deformation experiments and crystal plasticity simulations
. Int. J. Plasticity. 63, 198-210 (2014). https://doi.org/10.1016/j.ijplas.2014.06.004A dispersive homogenization model for composites and its RVE existence
. Comput. Mech. 65, 79-98 (2020). https://doi.org/10.1007/s00466-019-01753-9RVE model with porosity for 2D woven CVI SiC f/SiC composites
. J. Mater. Eng. Perform. 25, 5138-5144 (2016). https://doi.org/10.1007/s11665-016-2393-9Determination of RVE with consideration of the spatial effect
. Int. J. Rock. Mech. Min. 61, 154-160 (2013). https://doi.org/10.1016/j.ijrmms.2013.02.013Experimental determination of representative volume element (RVE) size in woven composites
. Opt. Laser. Eng. 90, 59-71 (2017). https://doi.org/10.1016/j.optlaseng.2016.10.001Determination of the size of the representative volume element (RVE) for the simulation of heterogeneous polymers at finite strains
. Finite. Elem. Anal. Des. 119, 30-44 (2016). https://doi.org/10.1016/j.finel.2016.05.004Lognormal distribution of local strain: a universal law of plastic deformation in material
. Phys. Rev. Lett. 124,Hydrogen-promoted heterogeneous plastic strain and associated hardening effect in polycrystalline nickel under uniaxial tension
. Mat. Sci. Eng. A 894,Revealing the effect of misorientation on the deformation behavior of a Mg-Y alloy from the perspective of local strain
. Int. J. Plasticity. 170,Micro-mechanical deformation behavior of heat-treated laser powder bed fusion processed Ti-6Al-4V
. Scripta. Mater. 233,Dic/dsi based studies on the local mechanical behaviors of HR3C/T92 dissimilar welded joint during plastic deformation
. Mat. Sci. Eng. A 857,The second SINQ target irradiation program, STIP-II
. J. Nucl. Mater. 343, 33-44 (2005). https://doi.org/10.1016/j.jnucmat.2005.01.027The fourth SINQ target irradiation program, STIP-IV
. J. Nucl. Mater. 431, 2-9 (2012). https://doi.org/10.1016/j.jnucmat.2011.11.004Tensile properties and microstructure of EC316LN irradiated in STIP-II
. J. Nucl. Mater. 450, 42-47 (2014). https://doi.org/10.1016/j.jnucmat.2014.02.009Status of the first SINQ irradiation experiment, STIP-I
. J. Nucl. Mater. 296, 43-53 (2001). https://doi.org/10.1016/S0022-3115(01)00544-XTensile testing of EP-823 and HT-9 after irradiation in STIP II
. J. Nucl. Mater. 356, 56-61 (2006). https://doi.org/10.1016/j.jnucmat.2006.05.003A review of surface deformation and strain measurement using two-dimensional digital image correlation
. Metrol. Meas. Syst. 23, 461-480 (2016). https://doi.org/10.1515/mms-2016-0028Non-contact strain evaluation for miniature tensile specimens of neutron-irradiated F82H by digital image correlation
. Fusion. Eng. Des. 157,A review of speckle pattern fabrication and assessment for digital image correlation
. Exp. Mech. 57, 1161-1181 (2017). https://doi.org/10.1007/s11340-017-0283-1Accuracy and precision of digital volume correlation in quantifying displacements and strains in trabecular bone
. J. Biomech. 40, 3516-3520 (2007). https://doi.org/10.1016/j.jbiomech.2007.04.019Strain uncertainties from two digital volume correlation approaches in prophylactically augmented vertebrae: Local analysis on bone and cement-bone microstructures
. J. Mech. Behav. Biomed. 67, 117-126 (2017). https://doi.org/10.1016/j.jmbbm.2016.12.006Damage behavior and fracture mechanism of lithium hydride ceramics under quasi-static loading at elevated temperatures
. Ph.D. thesis,Tensile properties of CLAM steel irradiated up to 20.1 dpa in STIP-V
. J. Nucl. Mater. 468, 240-245 (2016). https://doi.org/10.1016/j.jnucmat.2015.10.040Tensile properties of 9Cr–1Mo martensitic steel irradiated with high energy protons and neutrons
. J. Nucl. Mater. 318, 215-227 (2003). https://doi.org/10.1016/S0022-3115(03)00119-3Overview of the tensile properties of EUROFER in the unirradiated and irradiated conditions
. J. Nucl. Mater. 386, 254-256 (2009). https://doi.org/10.1016/j.jnucmat.2008.12.109Stress–strain behavior on tensile and low cycle fatigue tests of JLF-1 steel at elevated temperature in vacuum
. Fusion. Eng. Des. 81, 2907-2912 (2006). https://doi.org/10.1016/j.fusengdes.2006.07.055Dynamic strain aging under tensile and LCF loading conditions, and their comparison in cold worked 316L stainless steel
. J. Nucl. Mater. 328, 232-242 (2004). https://doi.org/10.1016/j.jnucmat.2004.04.331Effect of N on the precipitation behaviours of the reduced activation ferritic/martensitic steel CLF-1 after thermal ageing
. J. Nucl. Mater. 442, S9-S12 (2013). https://doi.org/10.1016/j.jnucmat.2013.03.081Influence of dynamic strain aging on ferritic/martensitic steel and stability analysis
. Fusion. Eng. Des. 171,Why is local stress statistics normal, and strain lognormal
? Mater. Des. 198,A multiscale approach for the deformation mechanism in pearlite microstructure: Experimental measurements of strain distribution using a novel technique of precision markers
. Mat. Sci. Eng. A 590, 37-43 (2014). https://doi.org/10.1016/j.msea.2013.09.072The effect of stress state and strain partition mode on the damage behavior of a mg-ca alloy
. Int. J. Plasticity. 144,Full-field strain distribution and failure characteristics of CFRP-repaired steel structures
. Eng. Fail. Anal. 115,Study on mechanical behaviors and microstructure evolution of medium manganese steel with high product of strength and plasticity during uniaxial tensile progress
. Master's thesis,Using DIC to identify microscale strain fields from in-situ SEM images of a pearlitic steel
. Exp. Mech. 54, 1503-1513 (2014). https://doi.org/10.1007/s11340-014-9937-4Strain localization in titanium investigated via in situ digital image correlation with multiscale speckles
. Mater. Charact. 189,Dynamic shear localization of a titanium alloy under high-rate tension characterized by x-ray digital image correlation
. Mater. Charact. 137, 58-66 (2018). https://doi.org/10.1016/j.matchar.2018.01.011Deformation analysis of ferrite/pearlite banded structure under uniaxial tension using digital image correlation
. Opt. Laser. Eng. 85, 24-28 (2016). https://doi.org/10.1016/j.optlaseng.2016.04.019Effect of grain size on deformation and fracture of inconel718: An in-situ SEM-EBSD-DIC investigation
. Mat. Sci. Eng. A 861,Mechanical behavior of polycrystals: Coupled in situ DIC-EBSD analysis of pure copper under tensile test
. Mater. Charact. 194,Characterization and analysis of deformation heterogeneities in commercial purity titanium
. Mater. Charact. 108, 94-101 (2015). https://doi.org/10.1016/j.matchar.2015.09.001Study on grain boundary character and strain distribution of intergranular cracking in the cghaz of t23 steel
. Mater. Charact. 84, 216-224 (2013). https://doi.org/10.1016/j.matchar.2013.08.004Strain analysis of multi-phase steel using in-situ EBSD tensile testing and digital image correlation
. Met. Mater. Int. 1-11 (2022). https://doi.org/10.1007/s12540-021-01044-0Semi in-situ investigations on deformation-induced micro-damage in high-strength dual-phase steels
. Mater. Charact. 207,The authors declare that they have no competing interests.

