Introduction
With the industrial development in recent years, mineral reserves on land have gradually been reduced or even depleted [1-3]. However, there are abundant mineral resources in the deep oceans, and accelerating the exploration and exploitation of deep-sea minerals will aid in alleviating current resource constraints [4-6]. However, deep-sea mineral exploration is an emerging area, and standard laws and regulated exploration methods are yet to be perfected [6-8]. Therefore, it is important to design an exploration device capable of continuously measuring and analyzing the mineral composition of the deep sea. This will facilitate the effective exploitation of deep-sea mineral resources.
Currently, deep-sea mineral exploration relies primarily on equipment such as deep-sea mining vehicles or manned submersibles that transport the collected samples to land or ships for elemental analysis (using X-ray fluorescence spectrometry (XRF) and other methods) [9-11]. However, the complexity and variability of deep-sea geomorphological environments prevent many of these devices from accurately and efficiently collecting mineral samples. This leads to certain limitations in these methods for deep-sea mineral exploration. Simultaneously, if deep-sea mineral mining is performed blindly without precisely locating mineral deposits, it will cause irreversible damage to fragile marine ecosystems [12, 13]. In contrast, land-based mineral exploration relies primarily on traditional drilling platforms for sampling and analysis. For example, Peng et al. conducted a mineral analysis study of uranium deposits in the Erlian Basin of Inner Mongolia based on XRF and proposed ground leaching mining of sandstone-type uranium ores from the perspective of time-delayed mineralogy [14]. Based on the SRXRF and INAA methods, Kolmogorov et al. developed a method that can analyze rock ores with complex compositions and developed a method that can be used to detect platinum group elements [15]. If accurate exploration of deep-sea mineral distributions is combined with land-based logging techniques, deep-sea mining would have a significant advantage over traditional land-based mining [16-18].
According to related literature, veins such as sulfide ore or manganese nodules (MNs) in the ocean generally occur at depths of 3000 m–6000 m or near deep-sea volcanic mountains [19, 20]. However, the extreme high temperature and high pressure environments in the region pose a significant challenge to deep-sea exploration. In this context, conducting efficient and environmentally friendly mineral exploration is an important issue that needs to be addressed. Therefore, to a practicable extent, adverse environmental impacts should be reduced using advanced equipment or improve mining methods. This may involve ensuring that the exploration equipment is structurally adapted to extreme environments, minimizing the interaction between the exploration appliances and the environment, or adopting vertical slit-fill exploration and collection [21-23]. It is important to optimize the above aspects for the analysis of mineral element results.
The purpose of this study is to solve the problem of existing X-ray detection equipment in the deep sea or other extreme working conditions, owing to extreme pressure differences or temperature factors causing safety accidents and detection difficulties, and to conduct an early laboratory structural prototype development of a deep-sea X-ray probe tube required for mineral exploration in the Indian Ocean. First, this study focuses on the mechanical structure design of the area containing the X-ray transmitting and receiving system using finite element analysis to analyze the stresses and displacements of the mechanical structure in detail. The actual test method was also used to verify the stability of the model. Second, the Monte Carlo method was used to analyze the effect of the Be window thickness on the X-ray transmittance of the X-ray probe tube in detail. Finally, the effect of seawater thickness between the X-ray probe tube and the well wall formation on logging detection efficiency is discussed. The experimental study of this device can serve as a reference for the in situ characterization and analysis of minerals in the deep sea or other extreme working environments.
Materials and Methods
Deep-sea mineral X-ray survey device design
The overall structure of the X-ray probe tube comprises mainly four systems. A simplified diagram of its structure and a schematic of its working mode are shown in Fig. 1. Each system and its main components are respectively referred to as follows:
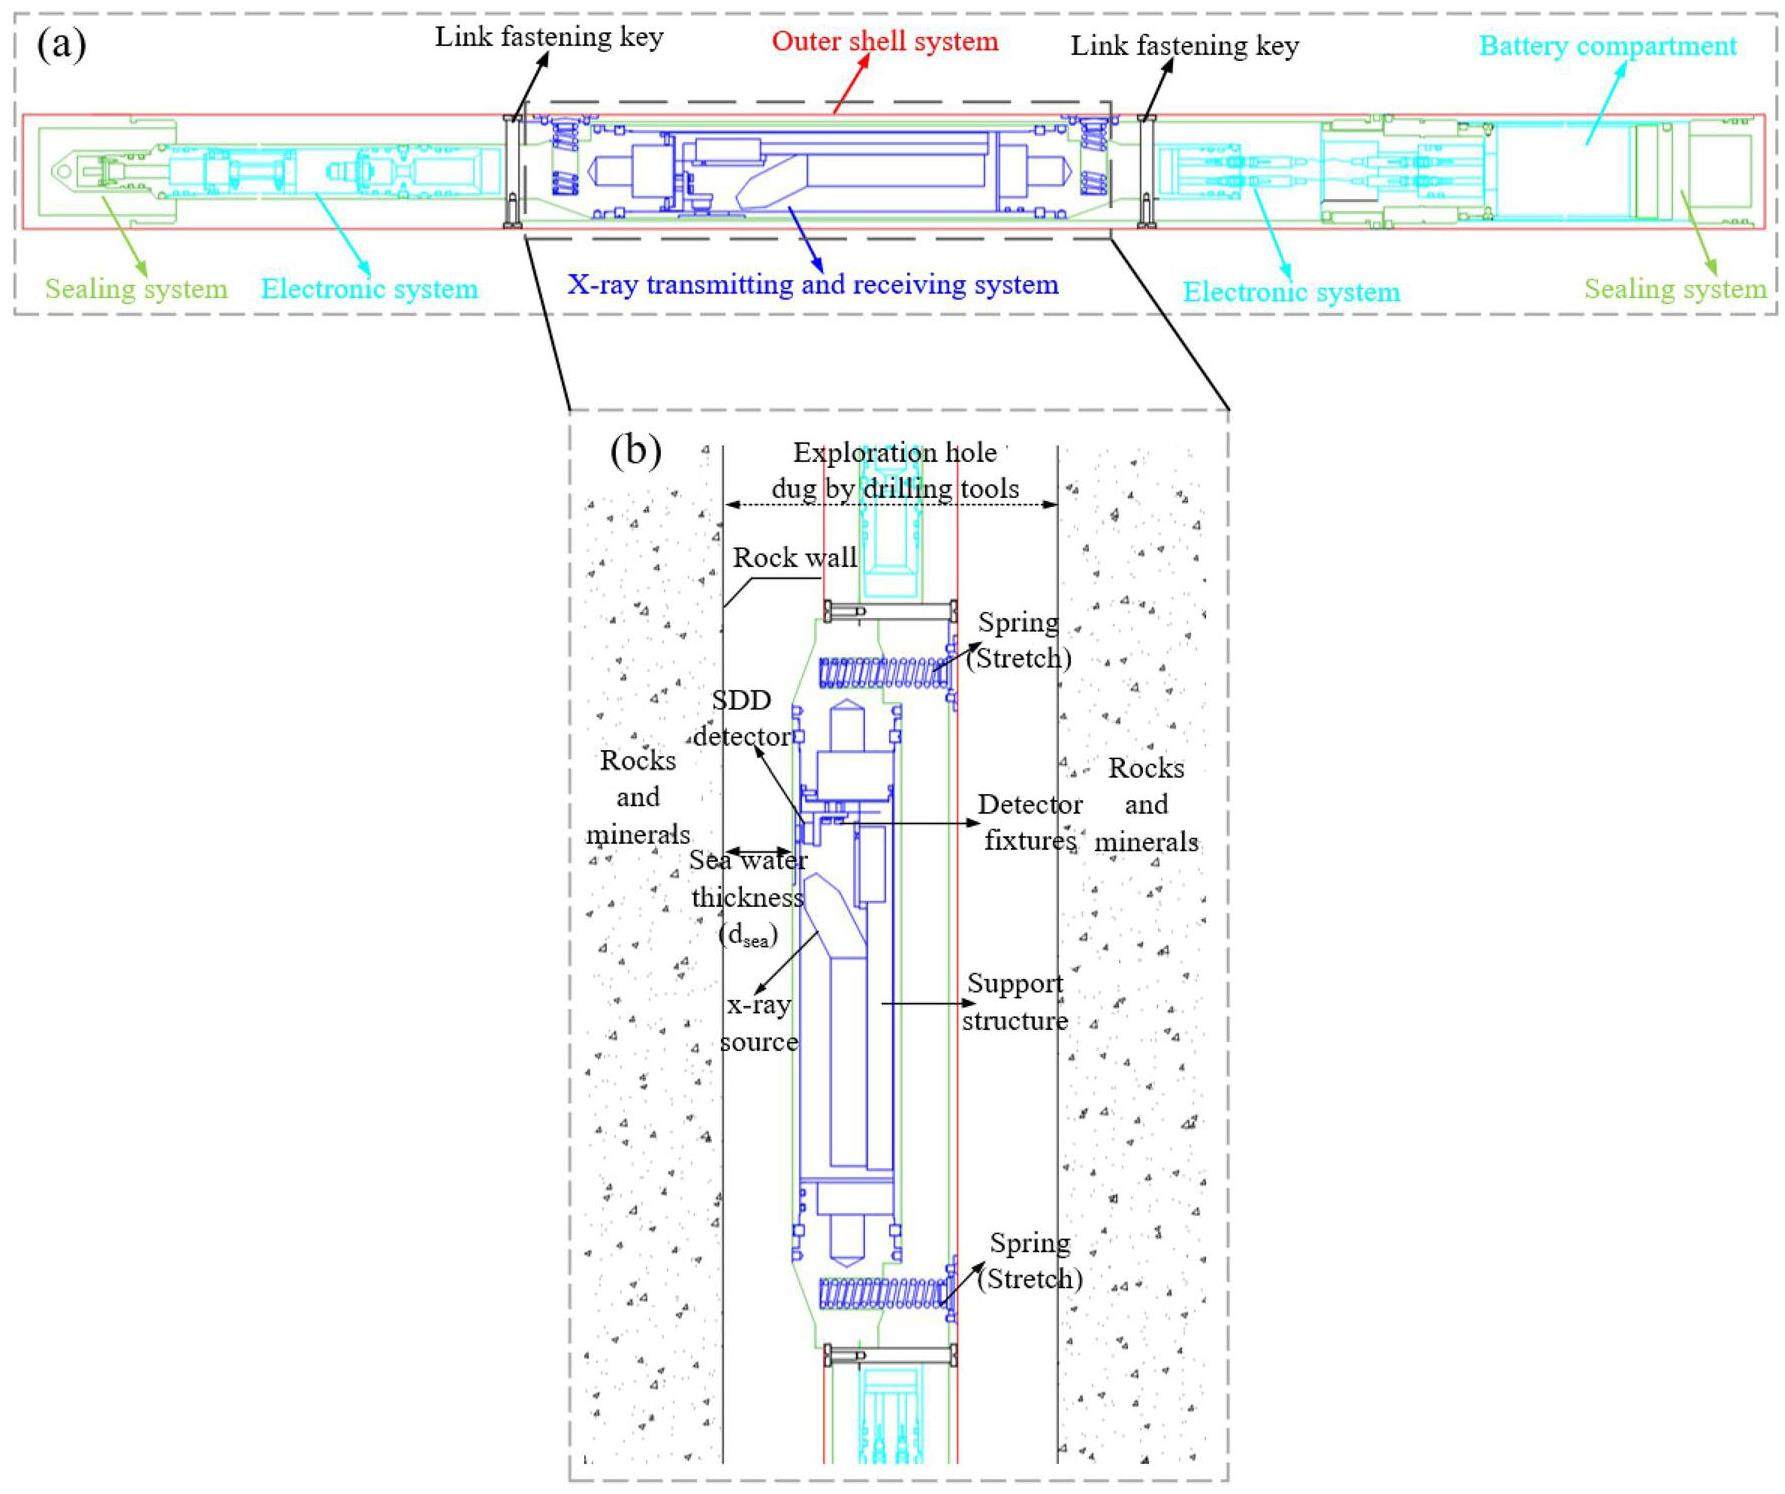
1. Outer shell system: Drill pipe joints, drill pipes, etc.
2. Sealing system: Supporting sealing seat, sealing needle seat, and sealing head, etc.
3. X-ray transmitting and receiving system (core system): Transmitter outer tube, compression spring, Be window, X-ray source, silicon drift detector (SDD), etc.
4. Electronic systems: Nuclear signal data processing devices, high-temperature-resistant battery power supply devices, spring expansion control devices, data storage devices, USB boards, etc.
To ensure minimal structural deformation and displacement of the X-ray survey device at a depth of approximately 4000 m, the entire device was designed as a cylinder (the pressure on an object in water is directly proportional to its surface area in contact with water, and the surface area of a cylindrical structure is smaller for the same volume). The internal pressure of the X-ray transmitting and receiving system should be maintained at standard atmospheric pressure to protect the core equipment, such as the X-ray source and SDD, from damage. Referring to the titanium alloy material used in the Chinese manned submersible Jiaolong, which completed the 7000 m sea trial in 2012 [24, 25], the Ti-6Al-4V (annealed) titanium alloy with a maximum ultimate compressive strength of 2042 MPa was selected as the housing material for the X-ray probe tube [26].
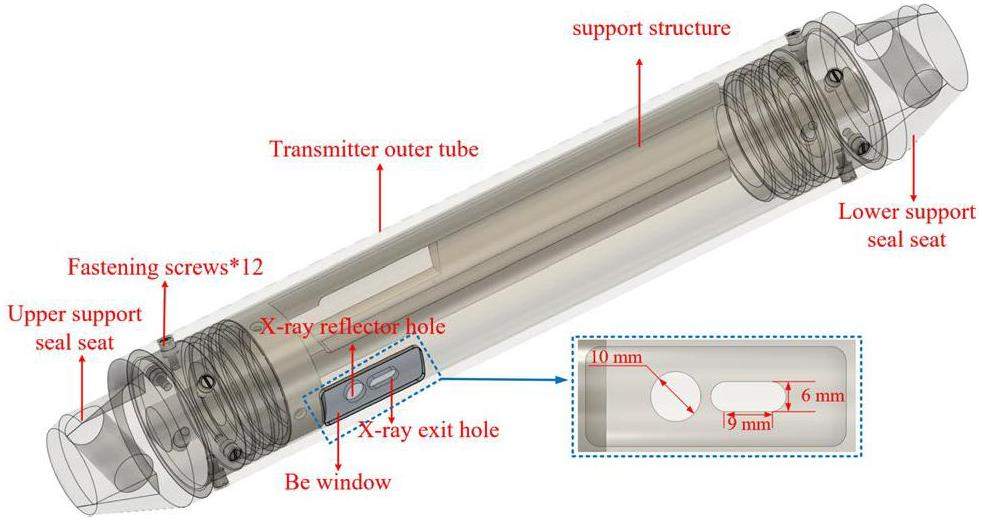
According to the design requirements, the outer tube of the transmitter was initially designed as a hollow cylinder with an inner diameter of SI62mmand an outer diameter of 72 mm. The X-ray exit aperture has a 3 mm arc radius at both ends and 9 mm length in the center. The X-ray reflection aperture has a radius of 5 mm Exploration is conducted in the deep sea mainly for veins such as MN ores or cobalt ores. To accurately identify the constituent elements of deep-sea minerals, the X-ray probe tube must be capable of detecting characteristic X-rays with energies ranging from 1 keV to 20 keV. The device was designed to use an X-ray tube with Ag as the anode target and X-ray source.
Seawater causes additional scattering and energy attenuation of X-rays from the target elements, which complicates the energy spectrum received by the detector. Therefore, the X-ray exit and reflection apertures of the device must be coated with Be windows of a certain thickness to remove the influence of low-energy X-rays. However, there is a difference in hardness between Be and Ti-6Al-4V. Moreover, the thickness of the Be layer directly affects the final detection efficiency of SDD. Consequently, the Be window thickness should also be analyzed in detail to determine the optimal thickness for improving the efficiency and safety of the equipment.
FEA model
The X-ray detection system was originally designed to use a compression spring to push the outer tube of the transmitter containing the X-ray source and SDD out of the housing at a certain distance. This design facilitated the collection and analysis of the mineral constituents (for the working principle, refer to Fig. 1(b)). To simplify the computational complexity, the X-ray transmission and reception systems can be analyzed as separate structures. At the same time, to maximize the assessment of the structural safety of the system, critical structures such as the support seal seat, Be window, and internal support frame will be retained during the experiments.
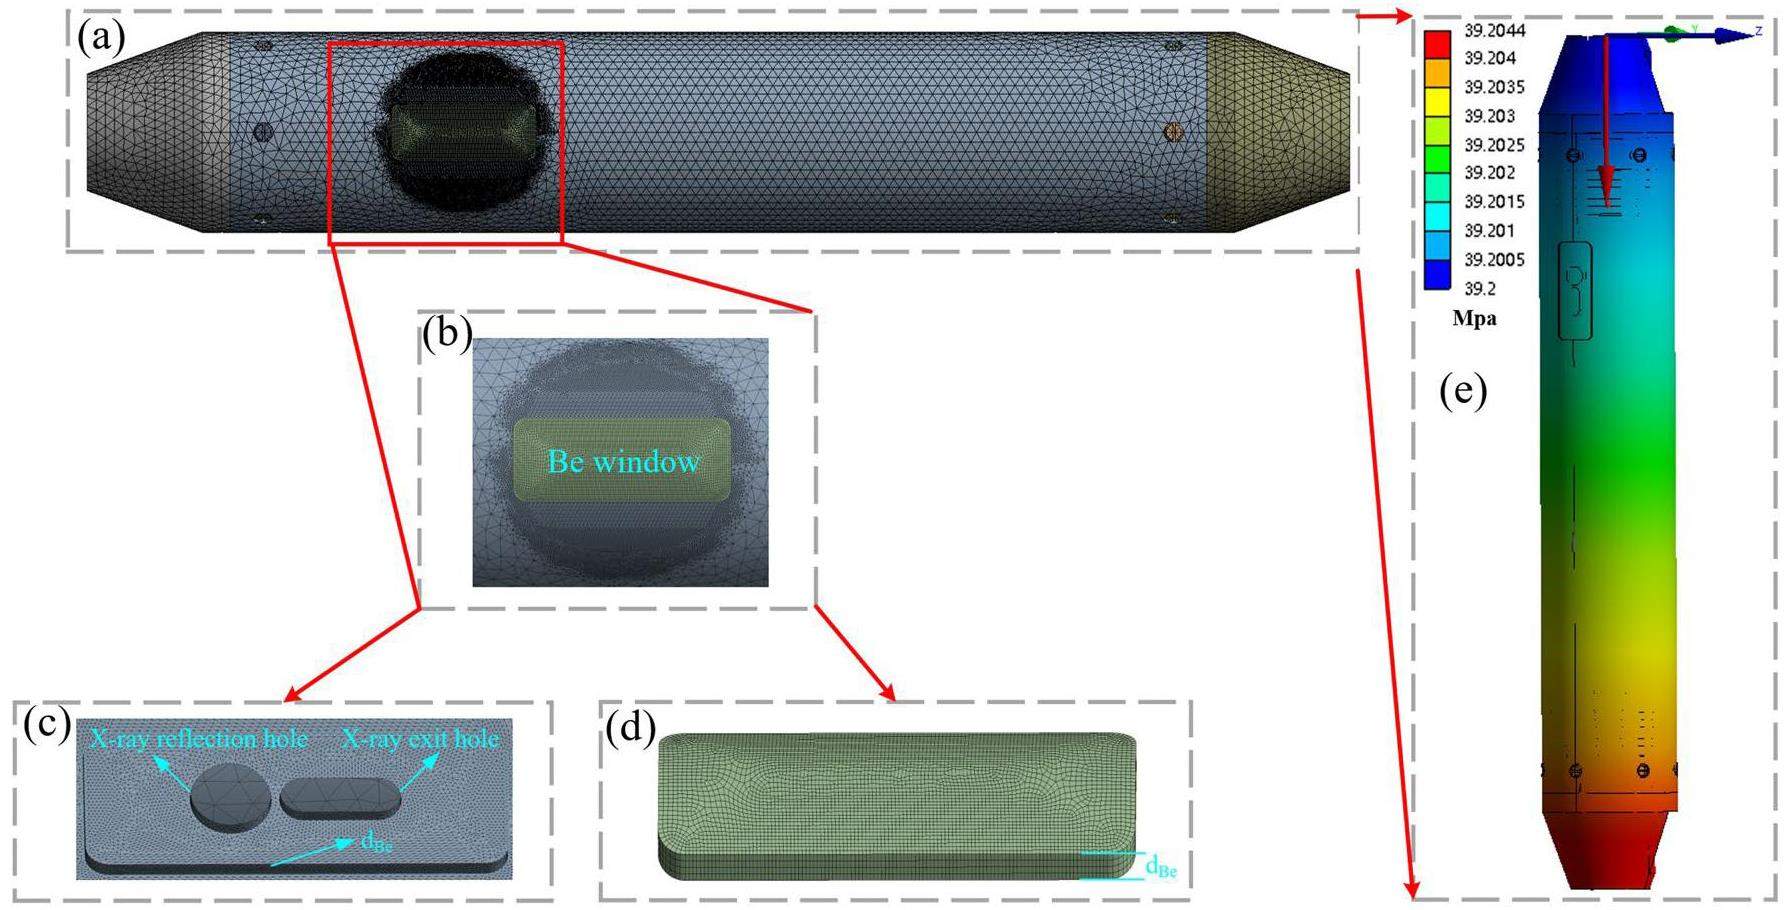
When plating Be on the X-ray exit and reflection holes of the outer tube of the transmitter, it is necessary to remove an equal amount of Ti-6Al-4V from the surface of the shell according to the thickness of the Be window. Therefore, the 3D model of the Be window is designed as a cube with a changeable thickness and certain curvature according to experimental needs. Simultaneously, the area where the Be window is located in the outer tube of the transmitter is dug and patched to ensure that the surface of the Be window is parallel to the outer surface of the transmitter's outer tube. This was done to minimize the possibility of damage to the X-ray probe tube due to collision of the Be window with the external environment during submersion or operation. The final 3D structural device diagram used for the safety assessment analysis is shown in Fig. 2. This experiment investigated the stress analysis of Be windows with different thicknesses in extreme environments, and thus, the Be window thicknesses (dBe) were designed as 1.0 mm, 1.5 mm, 2.0 mm, 2.5 mm, and 3.0 mm for structural simulation experiments.
The ANSYS Workbench mesh tool was used to generate the mesh during finite element analysis of the model. A tetrahedral mesh of size 4 mm was utilized for finite element discretization calculations. Because the Be window, X-ray exit, and reflection holes are critical structures that need to be analyzed for structural safety, the mesh in this area should be encrypted. The encryption method was based on an arc with a radius of 16 mm centered at the midpoint of the Be window, where the encrypted mesh was 0.4 mm, resulting in an approximately 1.42 million meshes for calculation.
Because the device can be used near a submarine volcanic mountain range, the environmental temperature during the simulation was set to 373.15 K. The end face of the upper support sealing seat is designated as a fixed support surface, and the hydrostatic pressure needs to be considered when calculating the surface effect, where the density of water is approximately 1×10³ kg/m3 and gravitational acceleration is 9.8 m/s2, the system was simulated in liquid water at depths of 1,000, 2,000, 3,000, and 4,000 m. The model used for the structural safety analysis is shown in Fig. 3. The material of the fastening screws was 304 stainless steel, and the transmitter outer tube was Ti-6Al-4V (annealed). The engineering data of the relevant materials used for the pressure simulation are shown in Table 1.
| Be | Ti-6Al-4V (annealed) | 304 stainless steel | |
|---|---|---|---|
| Density (kg/m3) | 1848 | 4429 | 7750 |
| Young's modulus (Pa) | 3.0×10¹¹ | 1.112×10¹¹ | 1.93×10¹¹ |
| Poisson's ratio | 0.07 | 0.3387 | 0.31 |
| Thermal expansion coefficient (C-1) | 1.206×10⁻⁵ | 8.789×10⁻⁶ | 1.7×10⁻⁵ |
| Tensile yield strength (Pa) | 2.3994×10⁸ | 8.457×10⁸ | 2.07×10⁸ |
| Tensile ultimate strength (Pa) | 3.7025×10⁸ | 9.18×10⁸ | 5.86×10⁸ |
Monte Carlo model
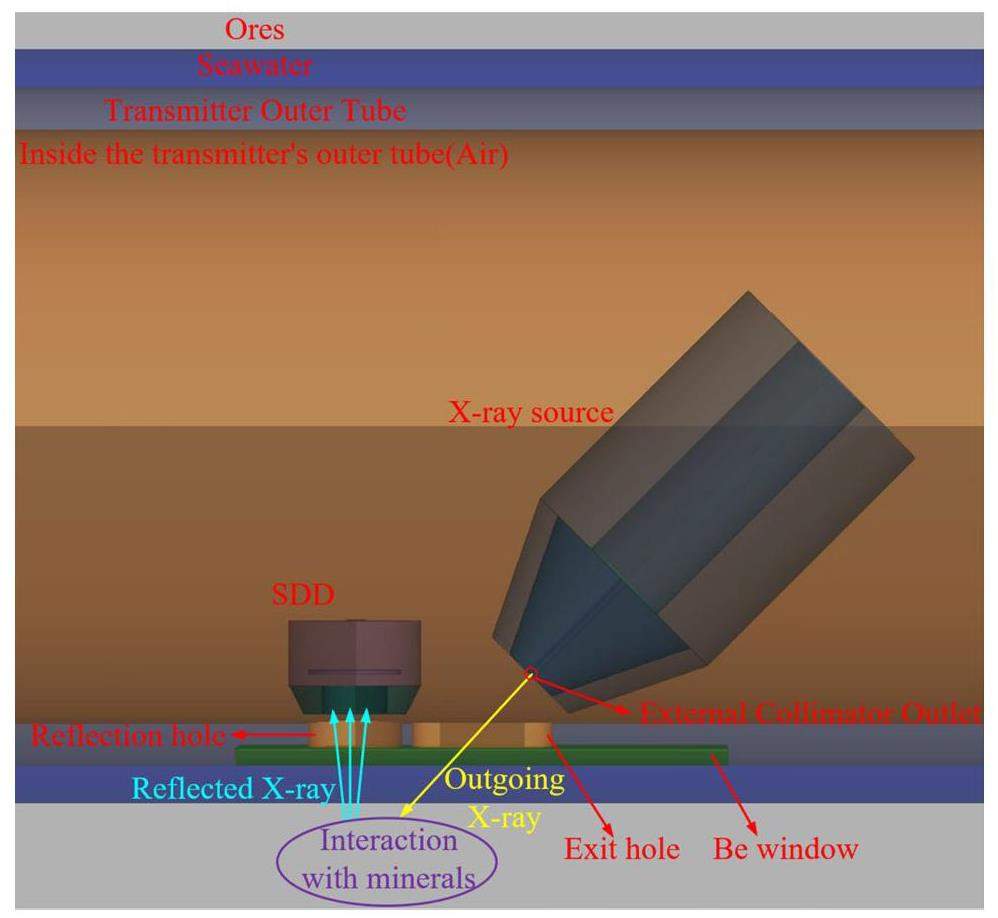
The Monte Carlo simulation experiments were performed using Geant4-11.1.2, and the simulation model is shown in Fig. 4. The Ag target was 0.005 mm thick, the radius was 5 mm, the Be window thickness was 0.5 mm, the inner collimator inside the diameter of The X-ray tube was 5 mm, and the outer collimator inner diameter was 0.5 mm. SDD used VITUS H20 manufactured by KETEK (in the actual equipment, semiconductor thermoelectric cooling technology was used. The operating environment of the probe assembly was maintained at 238.15 Kusing a secondary cooling component). The ambient temperature in the experiment was set to 373.15 K and the pressure was set to 400 atm. To improve the accuracy of the experiment in the simulation, initially 5×10⁹ electrons with an energy of 50 keV were emitted to bombard the Ag target of the X-ray tube. The X-ray energy spectrum at the exit of the external collimator was recorded and analyzed. Subsequent experiments used this spectrum to replace the particle source generated by the X-ray source unit during operation.
Results and discussion
Structural Safety Analysis
From the FEA results, the stress and displacement magnitude distributions were similar for different Be window thicknesses. Figure 5 shows the simulated von-Mises stress contour maps of the transmitter outer tube, X-ray exit hole, and reflection hole at seawater depths of 3000 m and 4000 m for dBe=1.5 mm and 2.0 mm. The results show that the von-Mises stress zone on the device is mainly located at the junction of the X-ray exit and reflection holes. In contrast, the stresses on the surface of the transmitter's outer tube were concentrated in the middle region of the outer tube because the ends of the outer tube of the transmitter contained sealing seat fillers to withstand the stresses (Fig. 2. The results show that the middle portion of the outer tube of the transmitter is subjected to higher von-Mises stresses than that at the ends.
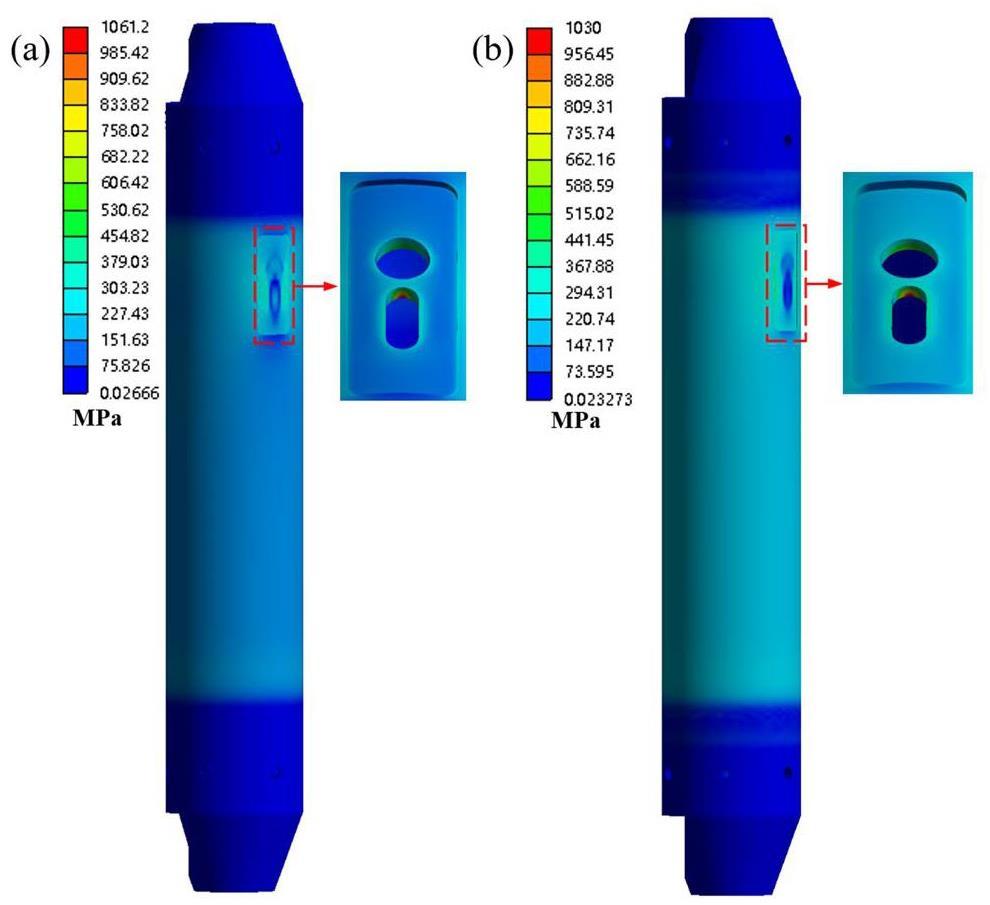
Concerning the Be window plating on the outer tube of the transmitter, because the Be window's interior is in direct contact with the edges of the X-ray exit and reflection holes, this may result in an outlier in the pressure in a specific area inside the Be window. Therefore, the stress distribution and displacement of the Be window must be analyzed separately. Based on Fig. 5, the Be window was calculated separately, and the results are shown in Fig. 6. The results show that under seawater pressure, an extreme stress distribution similar to the hole shape occurred on the internal face of the Be window. This is because in the original design, there was no material blocking the two holes to minimize the interaction of X-rays with other objects during motion, which reduces the contact area in the center area of the Be window, resulting in extreme stresses. However, the entire Be window is embedded in the outer tube of the emitter and the Be window edge area coincides with the outer tube of the emitter. This better transfers the pressure exerted on the edge of the Be window to the outer tube of the emitter.
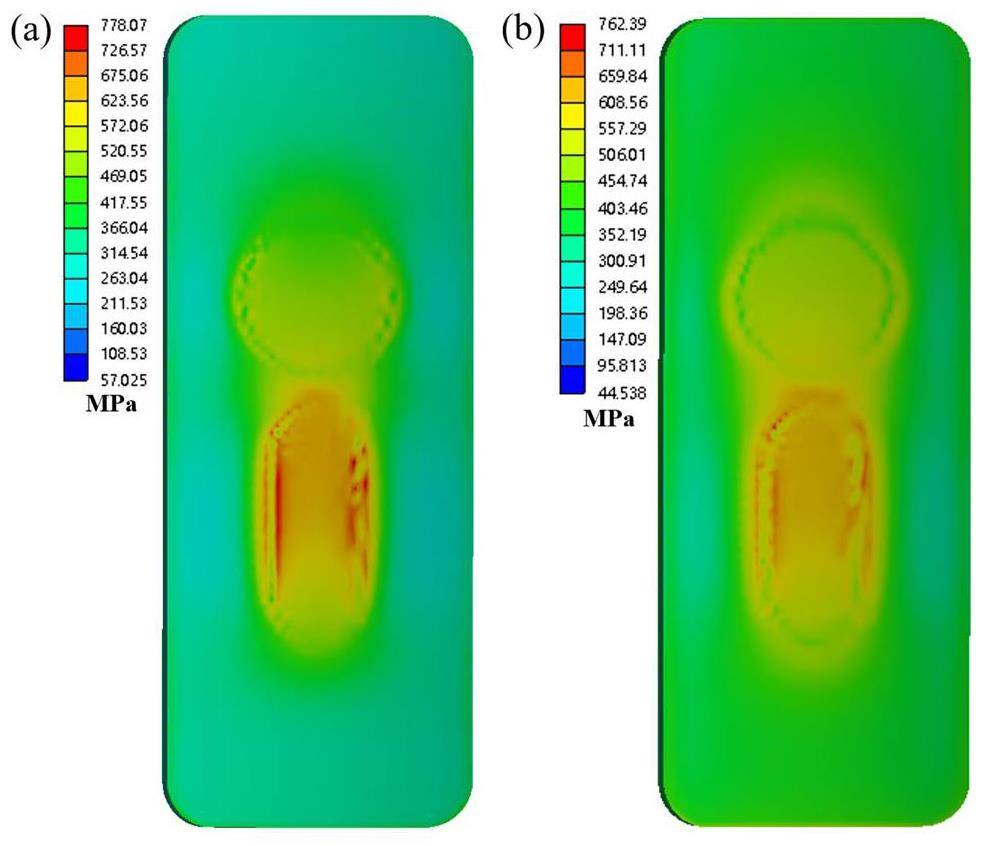
From the results shown in Figs. 5 and 6, the X-ray exit hole and reflection hole regions generate higher von Mises stresses near this region than in other regions of the transmitter outer tube, which may cause breakage of the transmitter outer tube structure or the Be window, ultimately affecting X-ray transmission. Because the Be window is not only designed to block seawater from entering the tube but also to be as thin as possible under structural safety conditions (the Be window thickness has a significant effect on X-ray attenuation), the Be window's optimal thickness must be determined through rigorous calculations. Figure 7 shows the trend plot of the maximum stress between the Be window and two holes of the transmitter outer tube for different Be window thicknesses under different deep-sea pressures. The results in Fig. 7(a) show that the magnitudes of the stresses on both decreased as the Be window thickness increased. Be is easily oxidized in air to form BeO (its maximum compressive strength is approximately 1551 MPa [27]). To ensure structural safety of the entire system, Be window detectors with corresponding thicknesses within the safe stress threshold can be selected for measurements based on the seawater depth of the actual measurement environment.
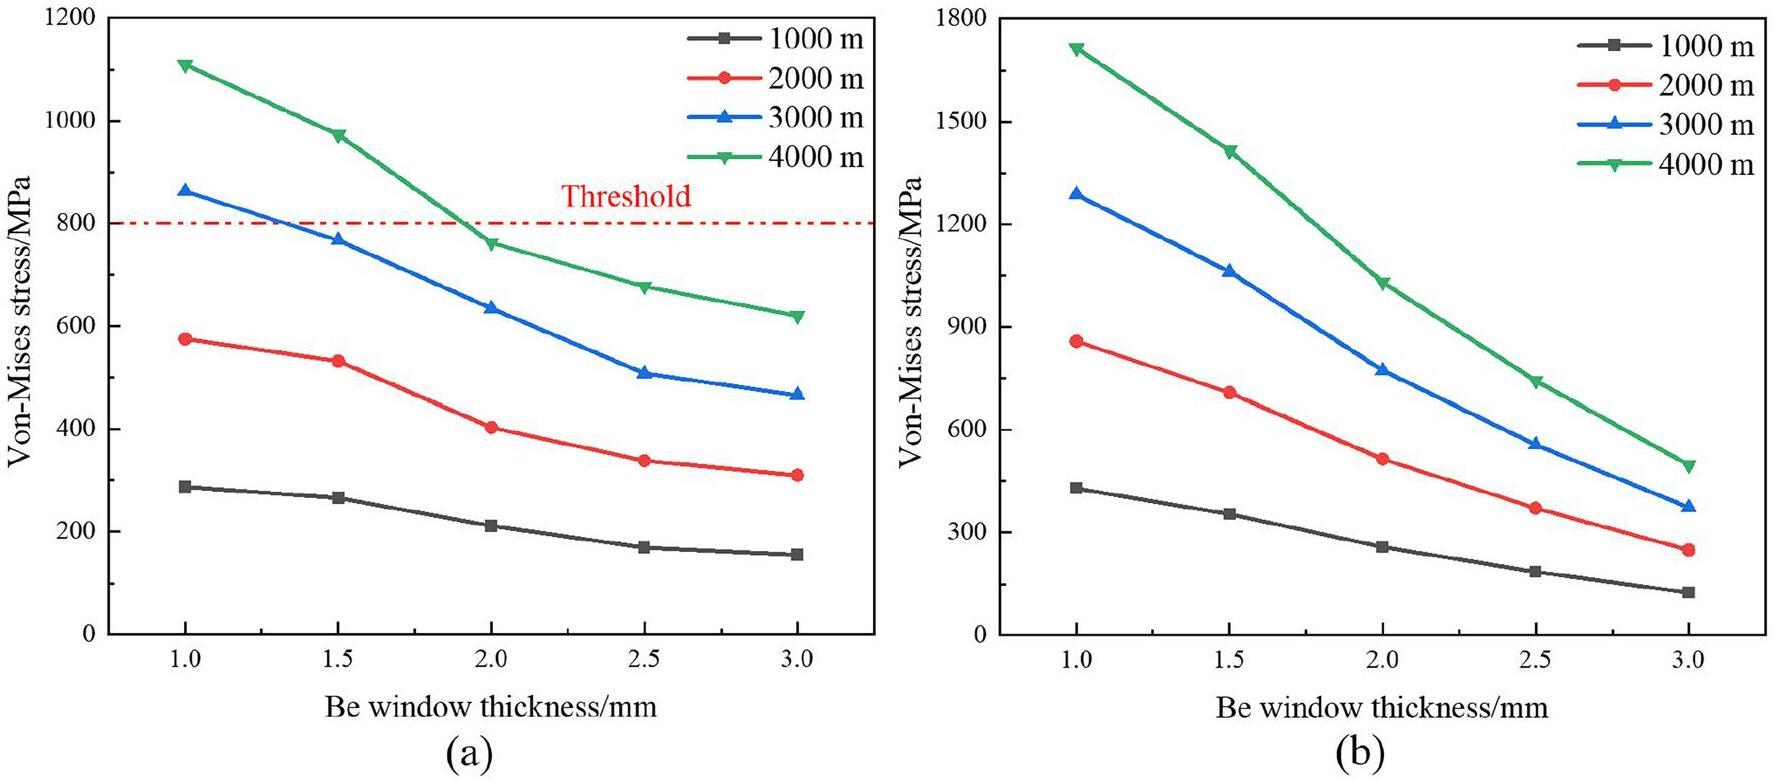
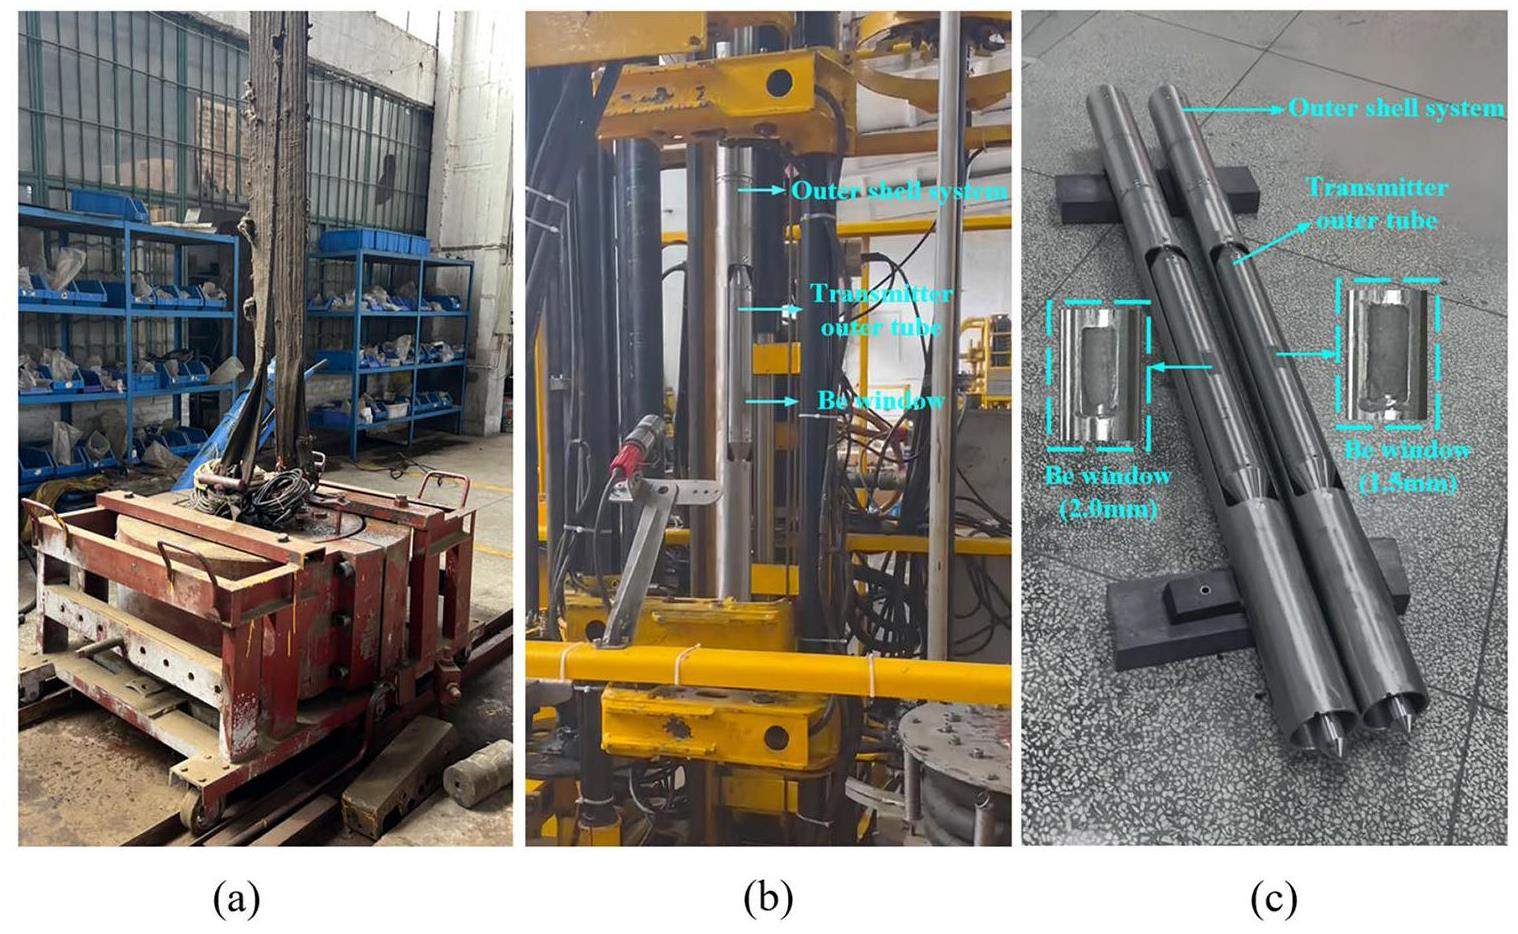
Based on the results of the above FEA, two preliminary deep-sea mineral exploration X-ray detectors (with Be-window thicknesses of 1.5 mm and 2.0 mm) were produced for this experimental test. The Be window was bonded to the designated area of the outer transmitter tube using LEAFTOP casting adhesive, which has an operating temperature between 218.15 K and 493.15 K and is highly waterproof and rigid. The two devices were shipped to Changsha Institute of Mining Research Co., Ltd., Hunan Province, China, for high-pressure damage testing (Fig. 8. The test procedure involved placing the device in well pressurizers, while gradually increasing the pressure in the well by following a process from 0 MPa to 40 MPa. The results show that no anomalies were produced in the structure of the two devices under the experimental conditions at pressures ranging from 0 MPa to 40 MPa, and the surface of the Be window did not show any significant breakage. However, combined with the FEA results(Figs. 6 and 7), the maximum von-Misese stress exceeded the safety threshold when the Be window thickness was 1.5 mm. Therefore, to avoid device anomalies in future deep-sea exploration, a Be window with a thickness of 1.5 mm can be selected when the ocean depth of the exploration reaches 3000 m, and a Be window with a thickness of 2.0 mm can be selected when the depth of the exploration reaches 4000 m. A Be window with a thickness of 2.0 mm was selected when the exploration depth reached 4000 m.
The initial design and simulation of the entire X-ray probe tube were performed in an extreme working environment. However, during the actual measurement, the device was in the standby mode most of the time to save power, and the temperature of the working environment was maintained at 293.15 K-313.15 K, which means that the temperature change had no obvious effect on the performance of the device [28, 29], and the effect of ambient temperature on the fatigue of the X-ray probe in the device was negligible at this stage.
Effect of Be window thickness on X-ray detection efficiency
Be windows have a filtering effect on X-rays in the low-energy range and can effectively filter low-energy bremsstrahlung and scattered X-rays [30, 31]. In general, the Be window should be as thin as possible to increase the X-ray transmission and optimize the instrument performance [32]. To obtain detailed X-ray spectral data, the Geant4 software was first used to calculate the X-ray source's outgoing energy spectrum at the time of operation (the X-ray source and SDD are located 0.1-mm inside the transmitter outer tube wall). Figure 9 shows the X-ray energy spectrum (normalized using the ratio of the statistical photon number to the incident electron number) at the external collimator exit (the geometric structure is shown in Fig. 4.
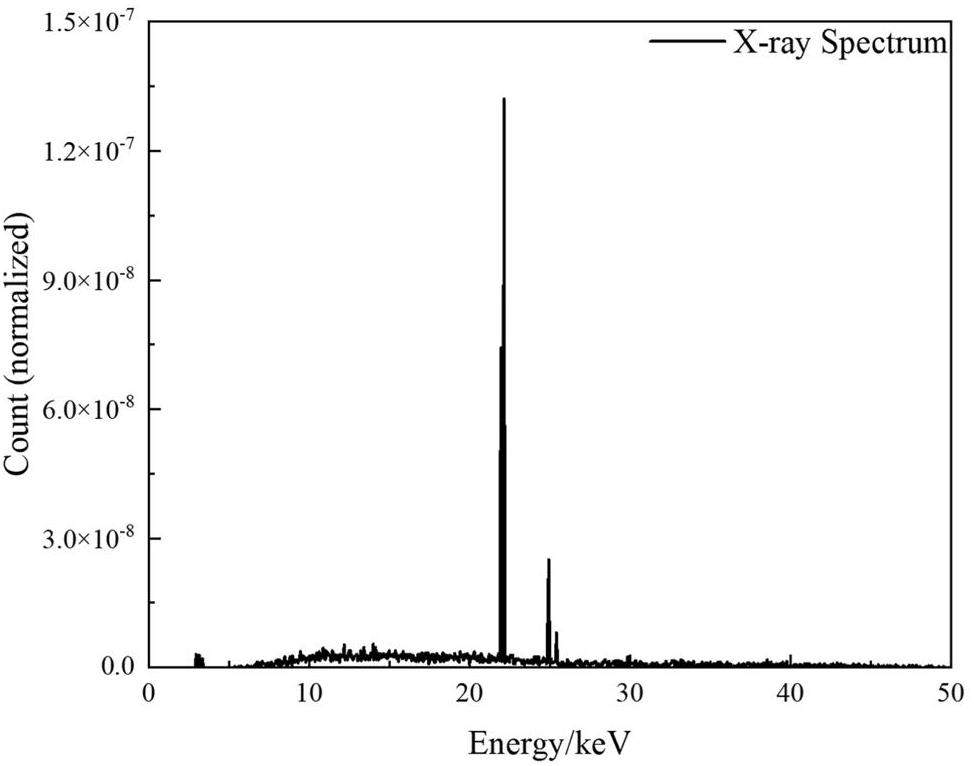
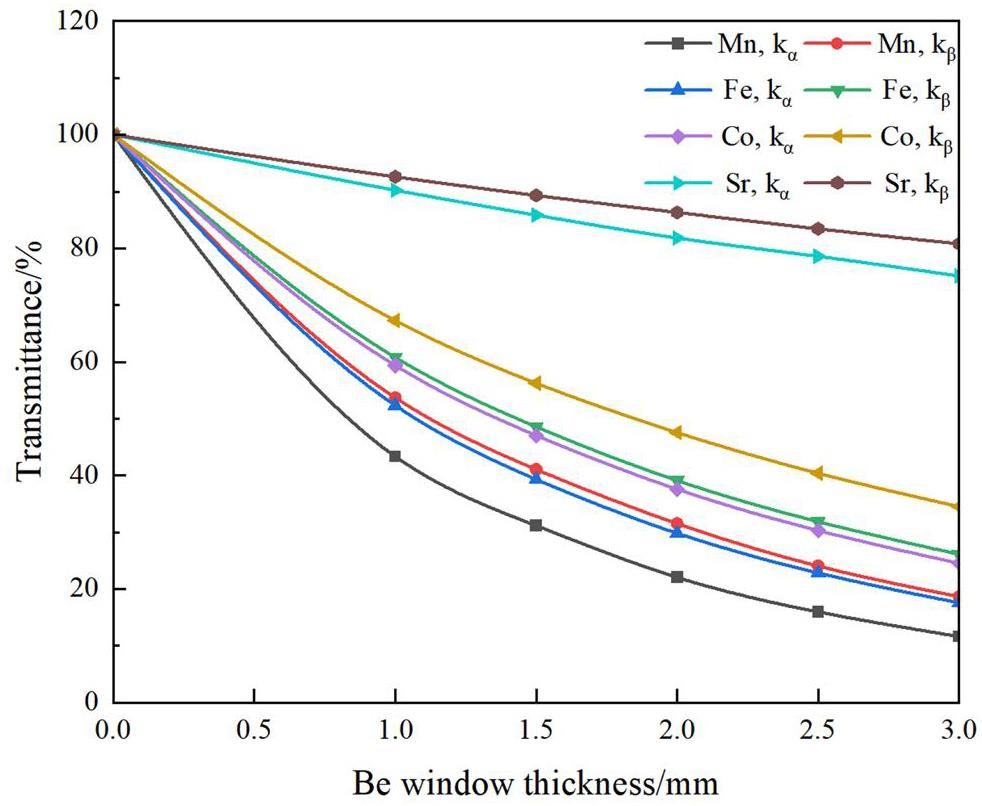
According to the conclusions drawn from Fig. 7, to ensure that the thickness of the Be window on the transmitter outer tube is as thin as possible under safe working conditions, it is necessary to perform simulation tests for Be window thickness (dBe) at 1 mm, 1.5 mm, 2.0 mm, 2.5 mm, and 3.00 mm. Based on the literature on the properties of ore distribution in the ocean, the ore materials were selected as MnO, FeO, Co(OH)2, and SrSO4 for the experiments [33, 34]. By comparing the characteristic X-ray transmittances of the target elements, Mn, Fe, Co, and Sr, for different Be window thicknesses in these materials (using the X-ray spectra shown in Fig. 9 as a radiation source), it is possible to determine the minimum Be window thicknesses that satisfy safe structural conditions. The results are presented in Fig. 10, where the X-ray transmittance decreases as the Be window thickness increases. Combined with the structural safety analysis and actual testing of the outer tube of the transmitter and Be window, as shown in Figs. 7 and 8, selecting a Be window with a thickness of 1.5 mmor 2.0 mm can improve the X-ray detection efficiency while ensuring structural safety.
Effect of seawater thickness on detection efficiency
In addition, it is crucial to determine the distance between the outer tube of the transmitter and rock wall inside the log. This is because it effectively solves the problem of X-ray energy attenuation at different seawater thicknesses (dsea) (see Fig. 1, which is important for the subsequent improvement of SDD detection efficiency [35]. Seawater primarily comprises water and dissolved salts, typically at a concentration of 3.5% [36]; however, dissolved salts produce ions that have no significant effect on the X-ray absorption [37, 38]. Thus, for the simulation analysis of detection efficiency, seawater can be considered as ordinary H2O.
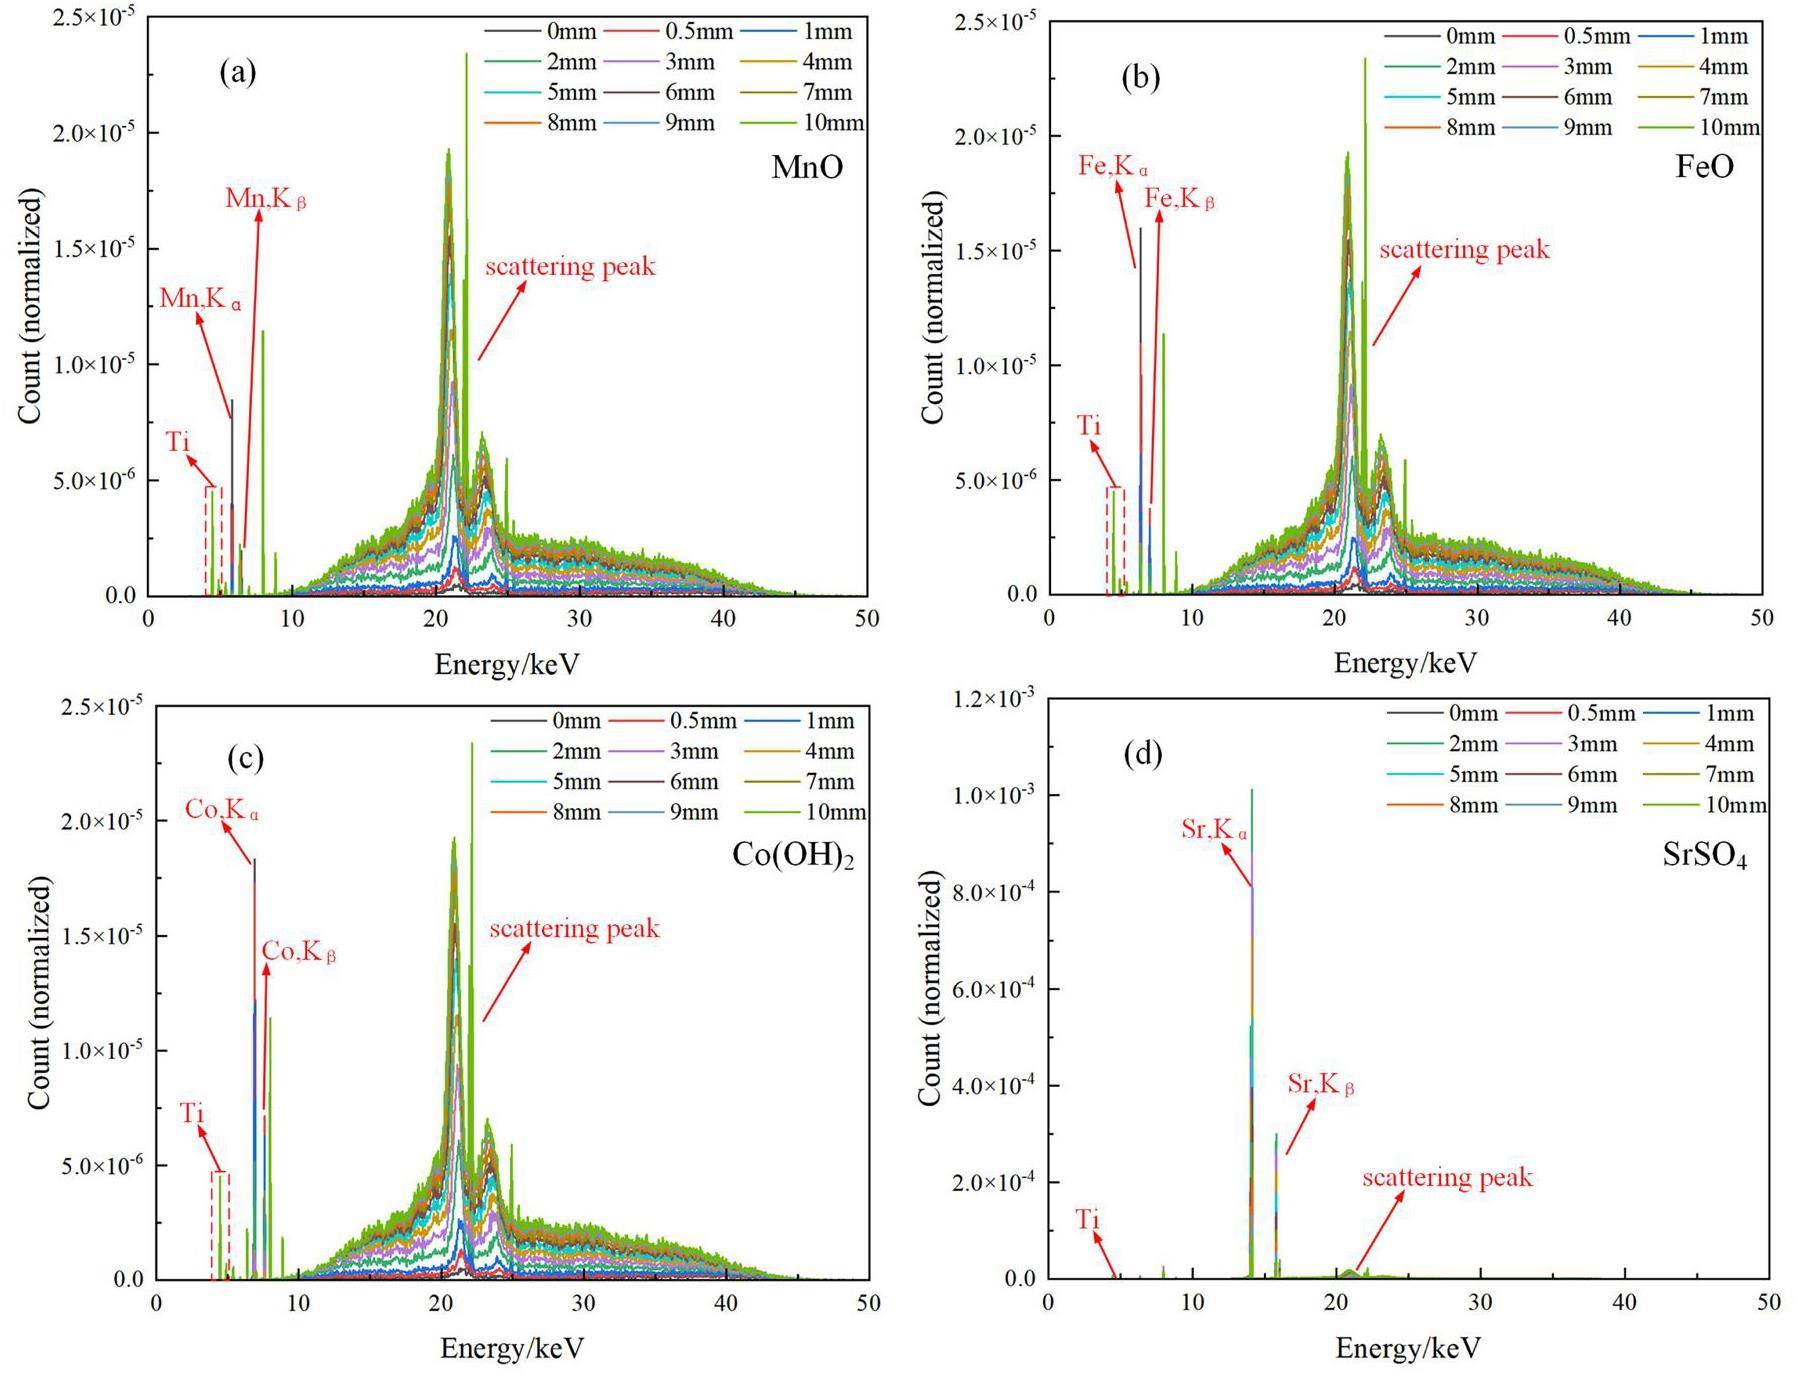
To investigate the effect of the distance (dsea) between the rock wall inside the logging and Be window on the transmitter outer tube on the SDD detection efficiency, we simulated the energy spectrum statistics of the X-rays received by the SDD for different seawater layer thicknesses (the Be window on the transmitter outer tube was maintained at a thickness of 2 mm during the simulation). A total of 12 cases with seawater thicknesses of 0 mm, 0.5 mm, 1 mm, 2 mm, 3 mm, 4 mm, 5 mm, 6 mm, 7 mm, 8 mm, 9 mm, and 10 mm were analyzed. To control the experimental variables, the experiment used the X-ray energy spectra shown in Fig. 9 as the ray source, and the emission position of the particle source was at the exit of the X-ray emission source (refer to Fig. 4. Figure 11 shows the X-ray energy spectra excited by different ores and received by the SDD for different values of dsea. Figure 12 shows the characteristic X-rays corresponding to the four ores plotted as a trend with respect to dsea. Simultaneously, to distinguish the seawater's effect on X-ray scattering or energy attenuation, another Geant4 simulation was conducted with seawater in a vacuum environment, and the SDD-detected target element characteristic X-ray trends under different vacuum layer thicknesses were statistically analyzed (dvac: distance between the transmitter outer tube and rock layer in a vacuum environment).
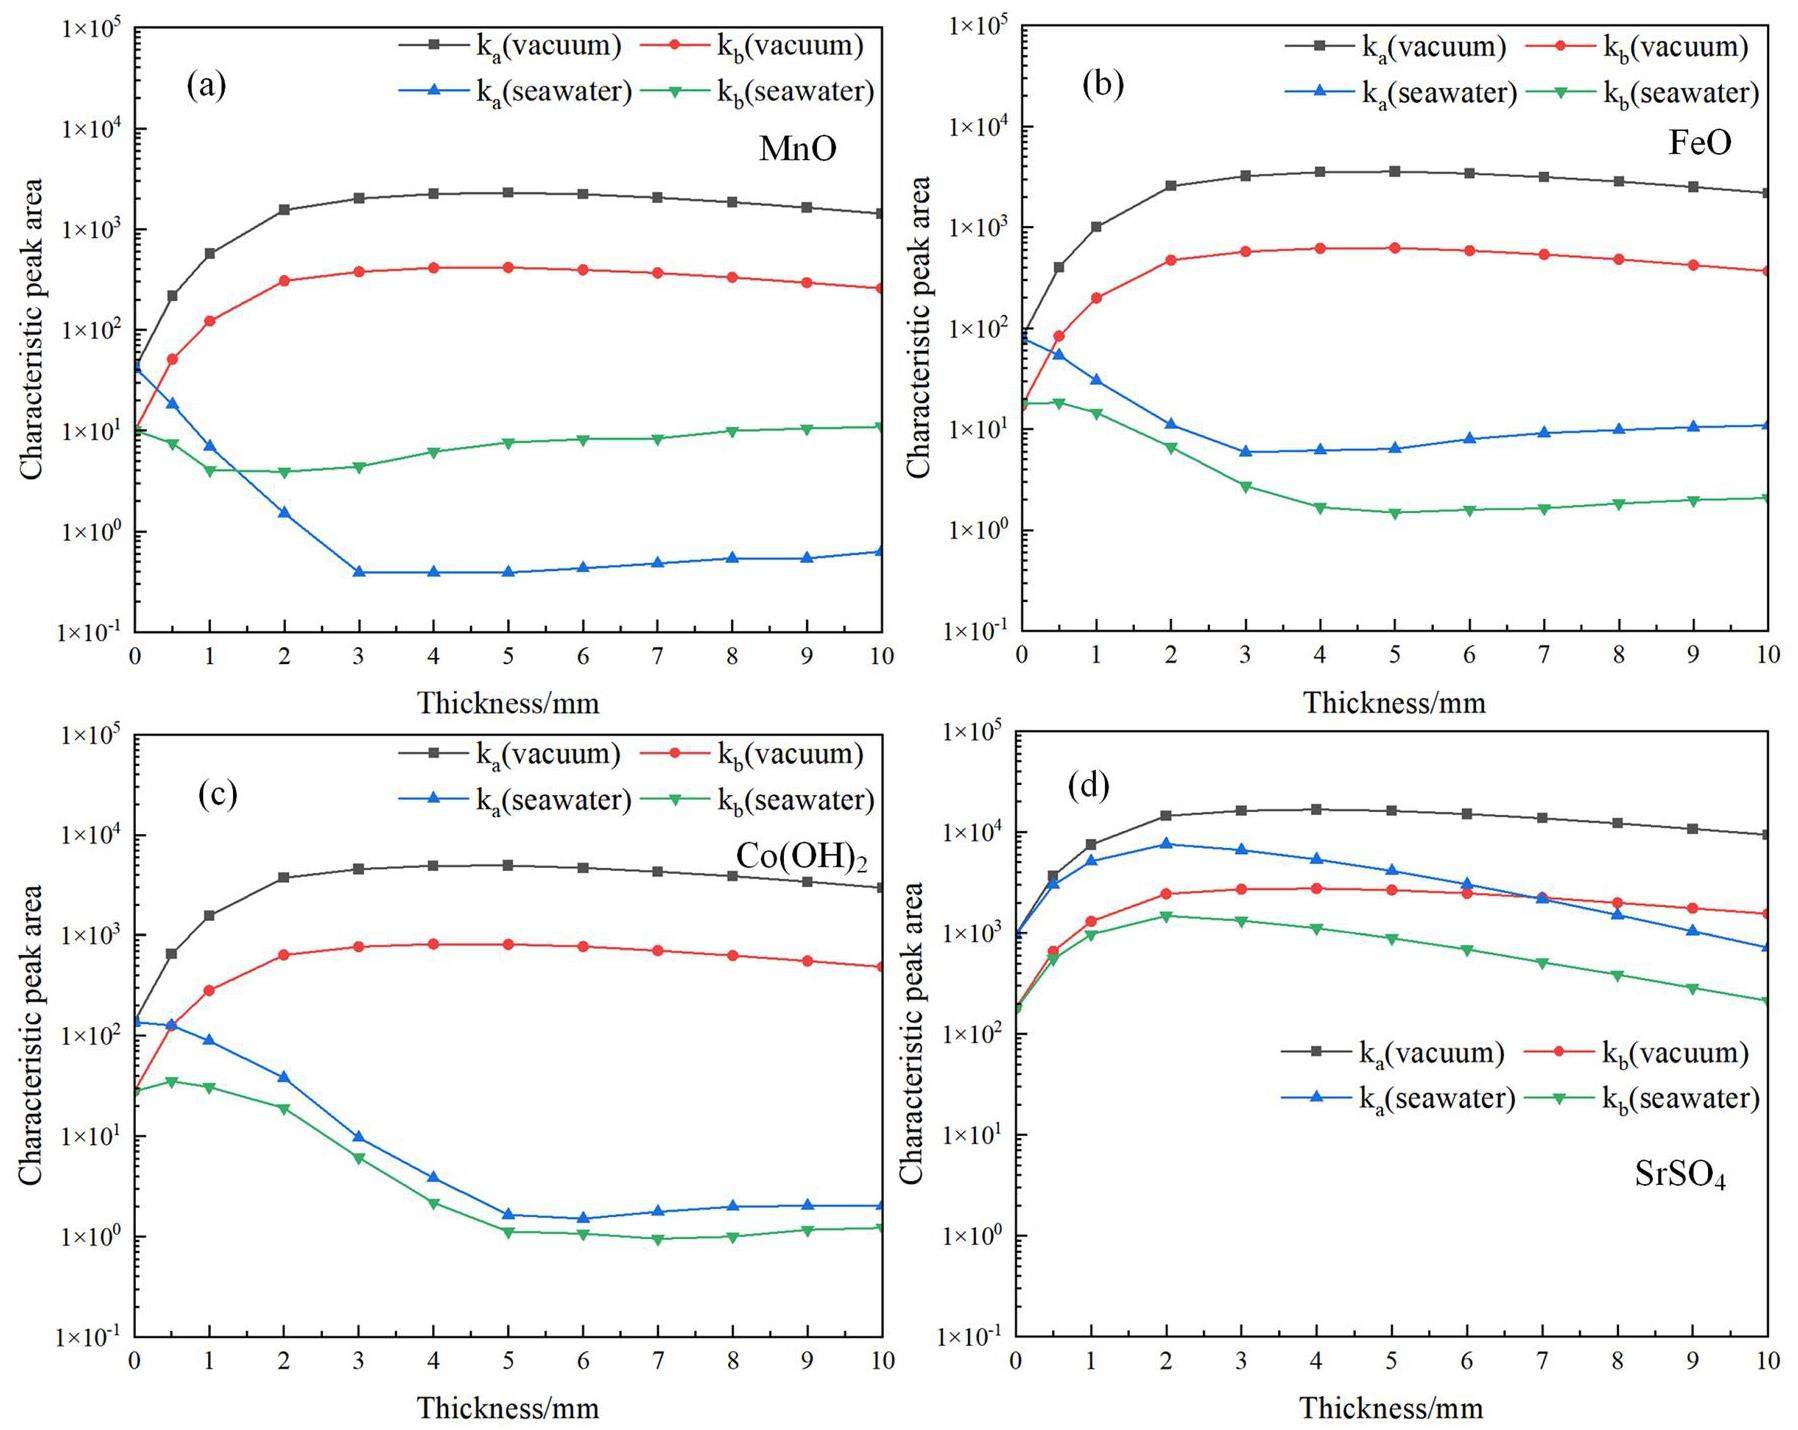
The results show that in the absence of seawater interference with X-rays, the SDD detection efficiency showed an increasing and then a decreasing trend with increasing dvac. However, when dvac increased, the X-ray reflection holes projected a larger area onto the ore surface (the angle becomes larger), resulting in more X-rays reaching the SDD through the X-ray reflection holes. However, when dvac exceeded a certain threshold, even if the projected area increased, the particle flux through the X-ray reflecting aperture decreased slightly, resulting in a slight decrease in the number of particles that can be detected by the SDD. Similarly, when the entire device was in seawater, owing to the attenuation effect of seawater on the X-ray energy [39], the detection efficiency of SDD decreased with increasing dsea for ores with characteristic peak energies below 10 keV. However, to detect ores with characteristic peak energies exceeding 10 keV, such as Sr-containing ores, when dsea < 2 mm, the increase in the projection area of X-ray reflection holes had a greater impact on the detection efficiency of SDD compared with that of the X-ray scattering or energy attenuation caused by seawater. Thus, the detection efficiency of SDD improves. When dsea >2 mm, the X-ray scattering or energy attenuation by seawater is the main influencing factor, and the detection efficiency of SDD decreases.
Conclusion
This paper presented the design of an X-ray probe tube for application in extreme environments such as the deep sea. This study focused on the structural design, mechanical structure safety analysis, and detection efficiency optimization of target elements. The main results are as follows:
1. In a deep-ocean environment, an extreme working environment leads to deformation of the detector, which adversely affects its safety. Combining FEA and actual high-pressure and high-voltage damage test results, the Be window thickness can be selected at the appropriate ocean depth for exploration (For 3000 m seawater depth, dBe = 1.5 mm; for 4000 m seawater depth, dBe = 2.0 mm) to ensure the safety of the equipment.
2. From the Monte Carlo simulation experiments, it was observed that the size of dsea should be appropriately adjusted according to the ore type. For ores with characteristic peak energies less than 10 keV, dsea should be minimized during exploration. However, when the ore's characteristic peak energy is greater than 10 keV, dsea should be increased to approximately 2 mm.
Note that the structural stability and corrosion resistance of the entire device in deep sea under long-term working conditions may affect the detection efficiency of the detector. In addition, the analysis of the impact of the water content on the data will be investigated in subsequent experiments.
Mineral resources: Reserves, peak production and the future
. Resources 5(1), 14 (2016). https://doi.org/10.3390/resources5010014Deep-sea mining: economic, technical, technological, and environmental considerations for sustain
. Dev. Mar. Technol. Soc. J. 45(5), 28-41 (2011). https://doi.org/10.4031/MTSJ.45.5.2Resource depletion, peak minerals and the implications for sustainable resource management
. Global Environmental Change 22(3), 577-587 (2012). https://doi.org/10.1016/j.gloenvcha.2011.08.009Deep-ocean mineral deposits as a source of critical metals for high- and green-technology applications: Comparison with land-based resources
. Ore Geol. Rev. 51, 1-14 (2013). https://doi.org/10.1016/j.oregeorev.2012.12.001Seabed mining and blue growth: exploring the potential of marine mineral deposits as a sustainable source of rare earth elements (MaREEs) (IUPAC Technical Report)
. Pure Appl. Chem. 94(3), 329-351 (2022). https://doi.org/10.1515/pac-2021-0325Explore China's stakeholders in the exploration and exploitation of mineral resources in deep seabed areas: Identification, challenges and prospects
. Ocean & Coast. Manage. 244(1),Global Observing Needs in the Deep Ocean
. Frontiers in Marine Science 6, 241 (2019). https://doi.org/10.3389/fmars.2019.00241Calibrating the linearity between grayscale and element content for X-ray KES imaging of alloys
. Nucl. Sci. Tech. 33, 1 (2022). https://doi.org/10.1007/s41365-022-00986-3Manned submersibles–deep-sea scientific research and exploitation of Marine resources
. Bulletin of Chinese Academy of Sciences 36(5), 622-631 (2021). https://doi.org/10.16418/j.issn.1000-3045.20210408004Advances in nuclear detection and readout techniques
. Nucl. Sci. Tech. 34, 205 (2023). https://doi.org/10.1007/s41365-023-01359-0Identifying toxic impacts of metals potentially released during deep-sea mining–A synthesis of the challenges to quantifying risk
. Front. Mar. Sci. 4, 368 (2017). https://doi.org/10.3389/fmars.2017.00368Defining “serious harm” to the marine environment in the context of deep-seabed mining
. Mar. Policy. 74, 245-259 (2016). https://doi.org/10.1016/j.marpol.2016.09.032Rock mineralogical characteristics and in-situ leaching uranium process test of Manglai uranium deposit in Erlian basin, Inner Mongolia
. Miner. Petrol. 44, 109-120 (2024). 51.1143.TD.20240229.1354.002Development of a complex of instrumental nuclear–physical methods to detect PGE, Re, Au, and Ag in hard-to-analyze rocks and complex ores
. Nucl. Instrum. Meth. Phys. Res. Sect. A 603(1-2), 131-133 (2009). https://doi.org/10.1016/j.nima.2008.12.117Deep-sea Rock Mech. and mining technology: State of the art and perspectives
. International J. Min. Sci+ and Technology 33(9), 1083-1115 (2023). https://doi.org/10.1016/j.ijmst.2023.07.007Conflicting Narratives of Deep Sea Mining
. Sustainability 13(9), 5261 (2021). https://doi.org/10.3390/su13095261The Indian Ocean Nodule Field: petrotectonic evolution and ferromanganese deposits
. Earth-Sci. Rev. 60(1-2), 67-130 (2003). https://doi.org/10.1016/S0012-8252(02)00078-8Manganese Nodules in Chile, an Alternative for the Production of Co and Mn in the Future–A Review
. Minerals. 10(8), 674 (2020). https://doi.org/10.3390/min10080674Numerical simulation and method study of X-ray litho-density logging
. Nucl. Sci. Tech. 31, 124 (2020). https://doi.org/10.1007/s41365-020-00826-2Dynamics analysis of deep-sea mining pipeline system considering both internal and external flow
. Marine Georesources Geotechnology 39(4), 408-418 (2019). https://doi.org/10.1080/1064119X.2019.1708517Linkage characteristics of deep-sea mining lifting system
. Ocean Eng. 233,Study of microstructure, mechanical properties, and corrosion behavior of As-cast Ni-Ti and Ti-6Al-4V alloys
. J. Mater. Eng. Perform. 32, 7831-7845 (2023). https://doi.org/10.1007/s11665-022-07654-yPrediction of fatigue limit in additively manufactured Ti-6Al-4V alloy at elevated temperature
. Int. J. Fatigue. 126, 55-61 (2019). https://doi.org/10.1016/j.ijfatigue.2019.04.025Effects of stress ratio and temperature on fatigue crack growth in a Ti–6Al–4V alloy
. Int. J. Fatigue. 27, 1151-1558 (2005). https://doi.org/10.1016/j.ijfatigue.2005.06.007Research on Spectral Characteristic of Miniature X-Ray Tube and Determination of Beryllium Window Thickness
. Spectrosc. Spect. Anal. 34(1), 252-256 (2014). https://doi.org/10.3964/j.issn.1000-0593(2014)01-0252-05The filter effects in X-ray tube XRF simulated by using the MCNP5 code
. Nucl. Tech. (in Chinese) 35(10), 751-754 (2012).Development of X-ray fluorescence spectrometry in the 30 Years
. Rock and Mineral Analysis 31(3), 383-398 (2012). (in Chinese)Use of portable X-ray fluorescence in the analysis of surficial sediments in the exploration of hydrothermal vents on the Southwest Indian Ridge
. Acta Oceanol. Sin. 36, 66-76 (2017). https://doi.org/10.1007/s13131-017-1085-0Preparation and characterization of iron-ore-imbedded silicone rubber materials for radiation protection
. Nucl. Sci. Tech. 29, 135 (2018). https://doi.org/10.1007/s41365-018-0459-0Prototype GaAs X-ray detector and preamplifier electronics for a deep seabed mineral XRF spectrometer
. X-Ray Spectrom. 47(3), 201-214 (2018). https://doi.org/10.1002/xrs.281Determination of water equivalent ratio for some dosimetric materials in proton therapy using MNCPX simulation tool
. Nucl. Sci. Tech. 30, 31 (2019). https://doi.org/10.1007/s41365-019-0544-zThe authors declare that they have no competing interests.


