Introduction
Because of the high sensitivity of neutron beams to light elements (e.g., H, B, and Li), neutron radiography (NR) has become an important nondestructive testing method in fields such as the nuclear industry, biology, chemical engineering, archaeology, and aerospace [1-3]. Currently, high-quality neutron radiographic images (NRIs) can be obtained using high-flux neutron sources such as research reactors and large-scale accelerators. However, the high cost, immobility, and large footprint of these NR devices limit their applications. Consequently, compact NR technology is gradually emerging as a research hotspot, both domestically and internationally.
Compact NR systems typically use small accelerators or high-yield neutron generators as neutron sources, resulting in neutron flux levels that are several orders of magnitude lower than those from reactors and large-scale accelerators. Additionally, to satisfy the miniaturization requirements, the collimator ratio (L/D, the length of the beam collimator to the diameter of the neutron source) is also limited. The long exposure times required to compensate for the low-flux neutron source further increase the likelihood of high-energy particles irradiating imaging detectors. These factors lead to specific distortions in NRIs, including Poisson-Gaussian noise, geometric unsharpness (blurring), and white spots [4-15].
Various studies have been conducted to improve the performance of compact NR systems. In 2014, Sun et al. proposed a deblurring method for NRIs using a steering kernel-based Richardson–Lucy algorithm [16]. In 2015, Qiao et al. developed a denoising method for NRIs using BM3D frames and nonlinear variance stabilization [17]. In 2020, Zhao et al. introduced a white-spot removal method for NRIs by integrating a spatially adaptive filter and median filter [18]. Over the following two years, Li et al. studied moderators and collimators suitable for compact NR systems using MCNP simulations [19]. In 2024, Meng et al. proposed a generative adversarial network-based image restoration method to improve the perceptual quality of degraded NRIs [20]. Although hardware improvements and image processing algorithms designed for NRIs have achieved considerable success, objective image quality assessment (IQA) for NRIs has rarely been reported. The primary reason for this is the lack of NRI datasets compared with those available for natural images.
Image quality assessment (IQA) is a crucial technique for predicting the quality scores of digital images and is widely used in various digital image processing tasks such as image restoration and super-resolution reconstruction. However, because the imaging mechanisms and distortion types of neutron radiographic images (NRIs) differ significantly from those of natural images, IQA methods designed for natural images cannot be applied directly to NRIs. To address this issue, Zhang et al. proposed a proof-of-concept IQA method for NRIs in 2021 based on a deep bilinear convolutional neural network (CNN) framework. This method utilizes two datasets, a large-scale natural image dataset and a small number of real NRIs, leveraging transfer learning to achieve quality prediction [21]. Notably, this IQA method only evaluates the quality of various noises in NRIs without considering blurring and white spots. In the same year, Zhang et al. further improved their IQA scheme for NRIs by expanding the evaluation scope to include Poisson-Gaussian noise and blurring [22]. However, these IQA methods focus solely on Gaussian noise, Poisson noise, and blurring, neglecting white spots, which are other significant distortions that severely degrade the visual quality of NRIs.
White spots in neutron radiographic images typically appear as randomly shaped blocks with smooth high-brightness structures. Traditional gradient-based IQA methods can only detect the edges of white spots, rather than their internal pixels. To address this issue, we propose treating white spots as special image content rather than noise owing to their blocky nature. In addition, the saliency of white spots differs significantly from that of noise and blurring within the same image, making it an effective metric for calibrating the quality of NRIs with multiple distortions, including noise, blurring, and white spots. Therefore, we propose a novel quality assessment method for NRIs based on visual salience and gradient magnitudes aimed at comprehensive quality evaluation. Specifically, a large-scale NRI dataset with more than 20,000 images was constructed, including high-quality original NRIs and synthetic NRIs with random multidistortions. Subsequently, an image quality calibration method based on visual salience and a local quality map is introduced to label the NRI dataset with quality scores. Finally, a lightweight CNN model was designed to learn the abstract relationship between the NRIs and corresponding quality scores using the constructed NRI dataset. The experimental results show that the proposed IQA method exhibits good consistency with human visual perception when evaluating real NRIs as well as processed NRIs using enhancement and restoration algorithms.
Construct degraded datasets of NRIs
Most public image datasets designed for image processing are based on natural images. However, the imaging principles and degradation models of NRIs significantly differ from those of natural images. In addition, acquiring NRIs is much more challenging because of the scarcity of available neutron sources and the high cost of neutron radiography. Therefore, 30 high-quality NRIs from published papers and shared laboratories were selected and then degraded using random levels of noise, blurring, and white spots to construct a degraded NRI dataset for subsequent calibration and training.
To simulate the degradation process of real NRIs, two degradation models were employed to generate synthetic NRIs as follows:
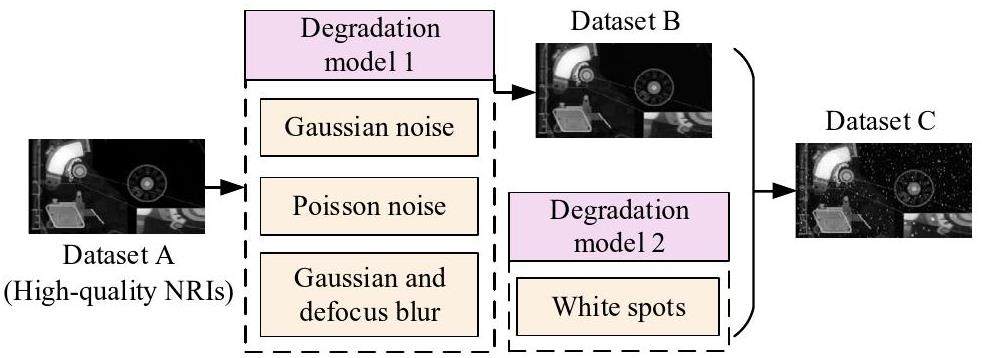
As shown in Fig. 1, random levels of Gaussian noise, Poisson noise, Gaussian blur, and defocus blur were employed for f (i.e., high-quality NRIs) based on Eq. 1 to obtain Dataset B. In addition, random quantities, sizes, and positions of the white spots were added to the resulting g based on Eq. (2) to obtain Dataset C. Note that both Datasets B and C contain the original high-quality NRIs as reference images.
Existing white-spot simulations [23] are limited to a few fixed shapes that differ significantly from real white spots in terms of size and distribution, as shown in Fig. 2(a). To address this issue, we propose a novel method for simulating white spots with high fidelity for proprietary dataset construction. Specifically, authentic white-spot samples, such as those in Fig. 2(b), are first extracted from real NRIs. These samples are used to train a generative adversarial network (GAN) [24] to generate synthetic white spots, as shown in Fig. 2(c).
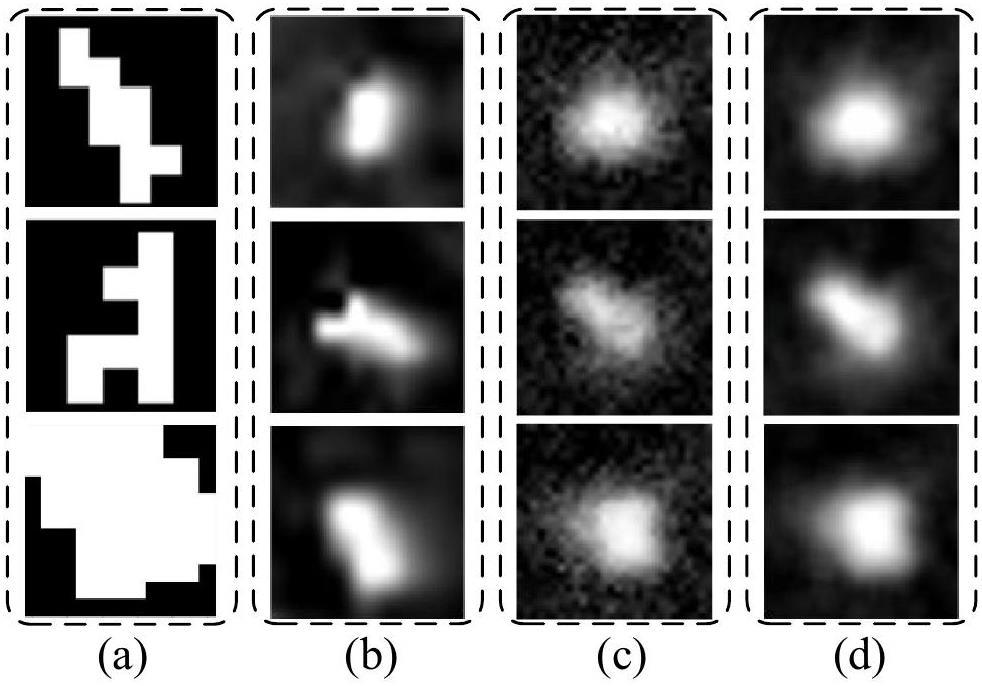
Because the generated white-spot samples contain white speckle noise (i.e., large areas of discrete white dots) outside their main shape, mean filtering and cubic spline interpolation were employed to suppress the unexpected discrete white dots and smooth the processed white spots, respectively. Contrast stretching was used to improve the brightness and contrast of the generated white spots. As a result, the generated white spots closely resemble the authentic white spot samples, as shown in Fig. 2(d). Note that the one-dimensional pixel range of the generated white spots was approximately one-twentieth of that of the NRIs.
Quality calibration method for NRIs based on gradient magnitudes and visual saliency
Saliency analysis of white spots
Currently, the gradient is widely used as a metric to evaluate image degradation, such as blur and noise, in classical image quality assessment methods (e.g., GMSD [25]). However, the gradient is not sensitive to the white spots because of their smooth interior structure. In contrast, white spots can severely degrade the visual quality of NRIs compared with noise and blur. Because all IQA algorithms aim to simulate the human visual system (HVS), the predicted quality score should be highly correlated with the subjective quality score perceived by human vision.
To solve this issue, image saliency is introduced into the designed IQA method for NRIs, which can enhance the image content, including white spots, using a transformational model. Specifically, a saliency map is utilized to display the saliency of visual scenes, which is a grayscale image corresponding to the original image. In the saliency map, areas of high and low brightness denote the salient and non-salient regions, respectively. Brightness intensity is directly correlated with the degree of saliency in each region.
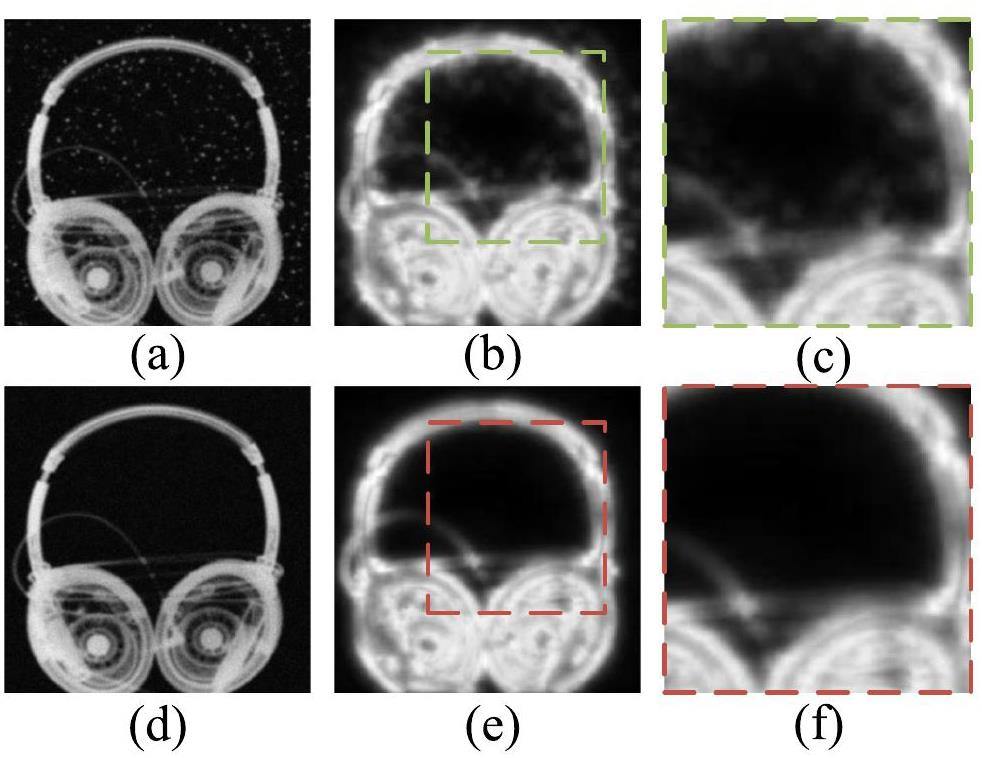
For example, consider a pair of synthetic NRIs in which the only difference between Figs. 3(a) and 3(d) is the presence or absence of white spots. Figures 3(b) and 3(e) show the corresponding visual saliency maps of Figs. 3(a) and 3(d), respectively. Note that, except for the white spots, the same levels of noise and blurring were also added to Figs. 3(a) and (d). A comparison between Figs. 3(c) and (f) shows that the saliency algorithm enhances the white spots more effectively than the noise and blurring. This demonstrates that image saliency is sensitive to the special degradation types of white spots. Therefore, image saliency can be used to refine the local quality map obtained from the gradient operation, thereby ensuring that the proposed quality calibration method can effectively evaluate NRIs with white spots.
Calculation methodology of image saliency
In this study, a classical context-aware (CA) algorithm was selected as the saliency detection method [26]. The main reason for using CA rather than other types of saliency detection is that it can enhance the context of the dominant objects and the objects themselves, which is especially suitable for NRIs with white spots. In addition, CA can prevent distortions in important regions of NRIs. A brief calculation process for the CA is given below:
Let
Verification of image saliency and white spots
From the perspective of image features, density (Den), background brightness (B_b), and aggregation degree (A_d) can be considered as the key factors influencing the visual saliency of white spots. Using the control variable method, five different levels of the above features were selected to validate the correlation between saliency and white spots. Specifically, B_b was adjusted via contrast stretching on the same reference NRI with the same parameters as those of Den and A_d. For Den, different numbers of white spots were added to the same reference NRI with the same parameters B_b and A_d. For A_d, the same number and shape of white spots were added to different sizes of the local area of the same reference NRI with the same parameters as those of Den and B_b. The bar graph in Fig. 4 shows the relationship between the preset parameters and saliency levels.
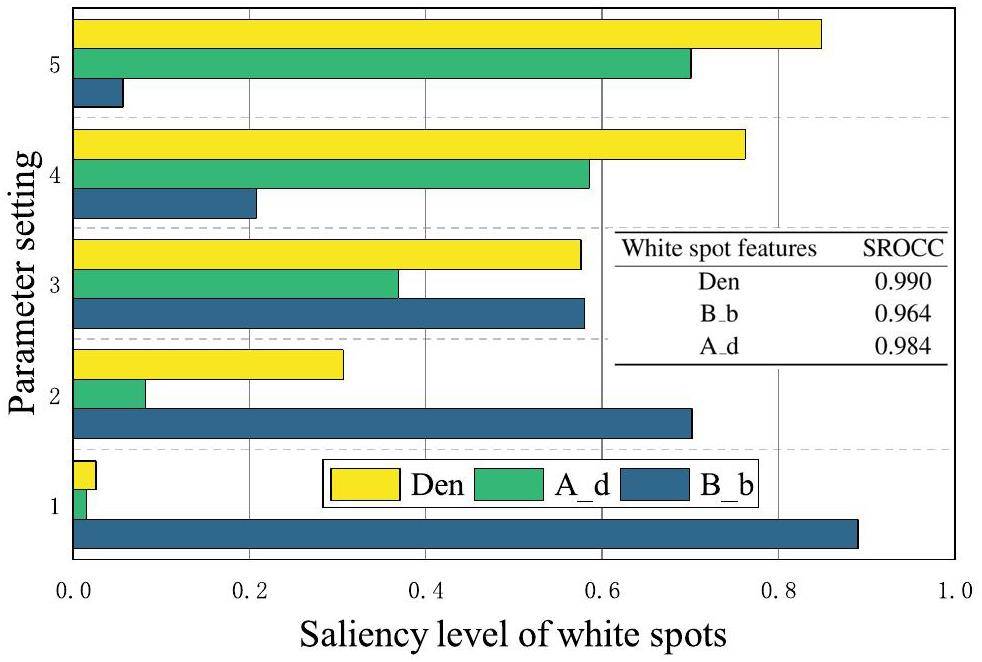
Figure 4 indicates that each feature shows a good linear relationship between the preset parameters and saliency levels of the white spots. Specifically, for the features Den and A_d, the saliency levels of the white spots increased as the parameter value increased. For B_b, the bar graph shows an opposite trend. This was because the bright background drowned out the white spots and reduced their saliency level. To quantitatively analyze these correlations, Spearman's rank order correlation coefficient (SROCC) was introduced to measure the correlation between the preset parameters (i.e., Den, B_b, A_d) and the saliency levels as follows:
The above analysis indicates that visual saliency can be considered an effective metric for evaluating white spots and can be employed in the quality calibration method of NRIs with white spots.
Quality calibration method for NRIs with multi-distortions
Inspired by classical gradient-based IQA methods [25, 27, 28], a novel IQA method was designed for NRIs with multiple distortions, based on gradient magnitudes and visual saliency. The gradient magnitude is defined as the orthogonal decomposition of an image along two directions and can be considered a valuable indicator of the image's structural information. Different structural distortions resulted in different gradient amplitude degradations. In general, image gradients can be obtained by convolving an image with linear filters such as the well-known Roberts, Sobel, Canny, and Prewitt filters. In this study, a Prewitt filter was used to calculate the image gradients. The Prewitt filters along the horizontal (x) and vertical (y) directions are defined as
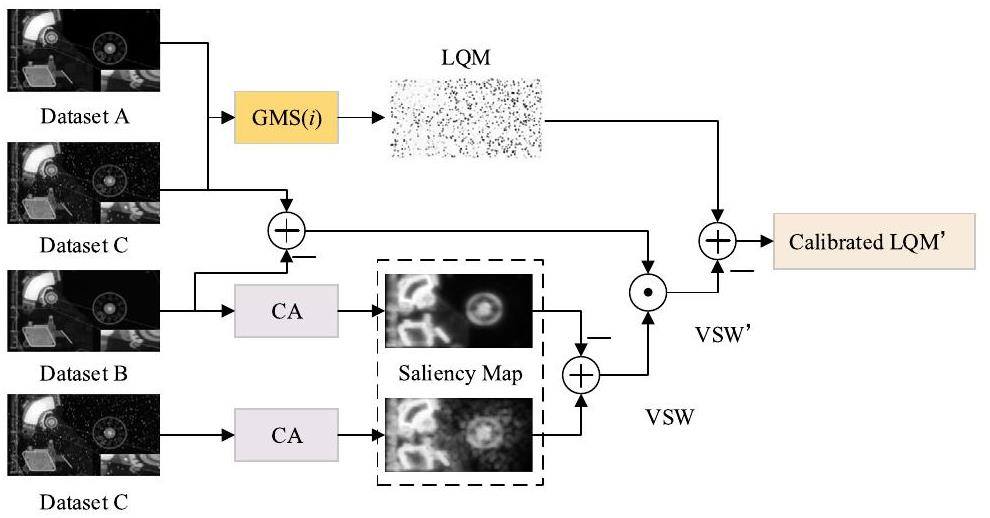
Although the local GMS can effectively evaluate image degradation, such as noise and blurring, it is still insensitive to the special distortion type of white spots existing in NRIs. The gradient operator only affects the edges of the white spots during local gradient computation and is insensitive to the internal pixels of the white spots. Therefore, visual saliency is further introduced to LQM to achieve comprehensive quality calibration for NRIs with white spots. A flowchart of the calibration algorithm is shown in Fig. 5, which can be summarized in four steps.
Step 1: The original high-quality NRIs from Dataset A and the corresponding degraded image from Dataset C are first employed to calculate the local GMS as LQM using Eq. 8, which can predict the quality of NRIs with noise and blurring.
Step 3: LQM quantifies the differences in each pixel by gradient magnitude. The inner product operation between the saliency maps of white spots and background images containing only white spots was used to avoid affecting pixels other than white spots during the correction process.
Step 4: LQM' reflects the local quality of each small block in the degraded image. Inspired by GMSD [25], which uses the standard deviation of GMS(i) as the final IQA index, this pooling strategy was also used for the proposed IQA method. Therefore, the overall image quality score can be obtained by employing standard deviation pooling operations on the calibrated LQM' as follows:
Validation of the proposed calibration method
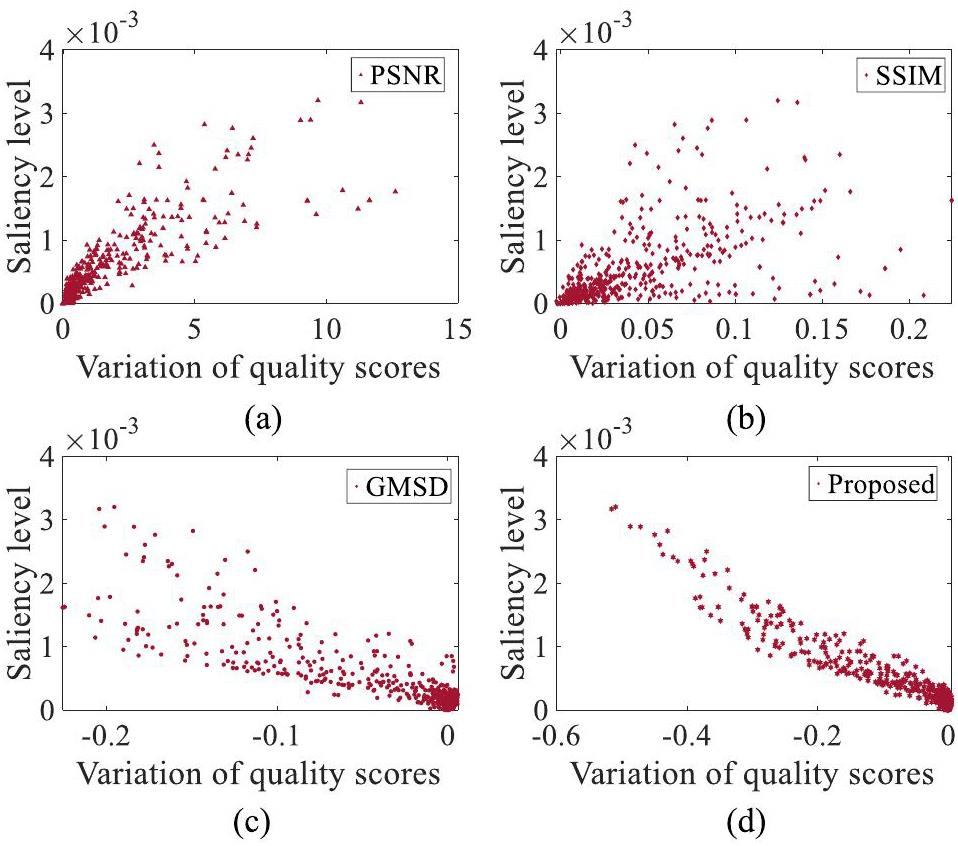
To validate the effectiveness of the proposed calibration method, several classical IQA methods were compared using scatter plots to illustrate their sensitivity to white spots. The vertical and horizontal axes in Fig. 6 denote the saliency level of the white spots and the quality score variation, respectively. The variation in quality scores can be obtained by a subtraction operation on the same reference image with and without white spots using the proposed quality calibration method and other classical IQA methods. For the vertical axis in Fig. 6, the saliency level is calculated VSW by Eqs. 9, which can indicate the significance level of white spots. Using the images from datasets B and C, the distribution between the variation in quality scores and the saliency level of the white spots can be obtained. The scatter distribution demonstrates that the proposed calibration method shows good linearity between the saliency level of the white spots and the variation in quality scores. In contrast, the three classical IQA methods (PSNR [30], SSIM [29] and GMSD [28]) do not show sufficient linearity, which aligns with our previous theoretical analysis.
We further validated the proposed method using the public dataset TID2013, which comprised 3,000 distorted images generated from 25 reference images, including distortion types of noise, Gaussian blur, and local block-wise. The mean opinion scores (MOS) of all distorted images ranged from 0 to 9, and a higher MOS value indicated better image quality. Because Gaussian blur, high-frequency noise, and local blockwise distortions are similar to the degradation types in NRIs, we chose the above distortion types with different intensities in TID2013 to validate the cross-dataset. Local blockwise distortions can be approximated as white spots to some extent.
Next, a comprehensive comparison of several distortion types was performed using the aforementioned IQA methods, as shown in Table 1. SROCC was also employed as a metric to evaluate the correlation between the preset value of degradation and the predicted value obtained by PSNR, SSIM, GMSD, and proposed IQA methods. The SROCC results for the proprietary IQA-dataset of NRIs indicated that the proposed method outperformed the classical PSNR, SSIM, and GMSD methods in terms of blurring, noise, white spots, and average scores. In addition, the SROCC results for the IQA-dataset of TID2013 further demonstrate that the proposed method shows good consistency with MOS in evaluating degradation types similar to NRIs. Overall, the proposed method proved to be a satisfactory IQA method, designed specifically for NRIs.
| Distortions | ||||
|---|---|---|---|---|
| Method | PSNR | SSIM | GMSD | Proposed |
| Proprietary IQA-dataset of NRIs | ||||
| Blurring | 0.870 | 0.965 | 0.943 | 0.972 |
| Noise | 0.930 | 0.976 | 0.954 | 0.979 |
| White spots | 0.821 | 0.645 | 0.804 | 0.953 |
| Average | 0.873 | 0.861 | 0.891 | 0.968 |
| IQA-dataset of TID2013 | ||||
| Gaussian blur | 0.910 | 0.924 | 0.954 | 0.943 |
| High-frequency noise | 0.913 | 0.863 | 0.904 | 0.924 |
| Local block-wise | 0.300 | 0.572 | 0.553 | 0.901 |
| Average | 0.707 | 0.786 | 0.803 | 0.922 |
No-reference image quality assessment based on convolution neural networks
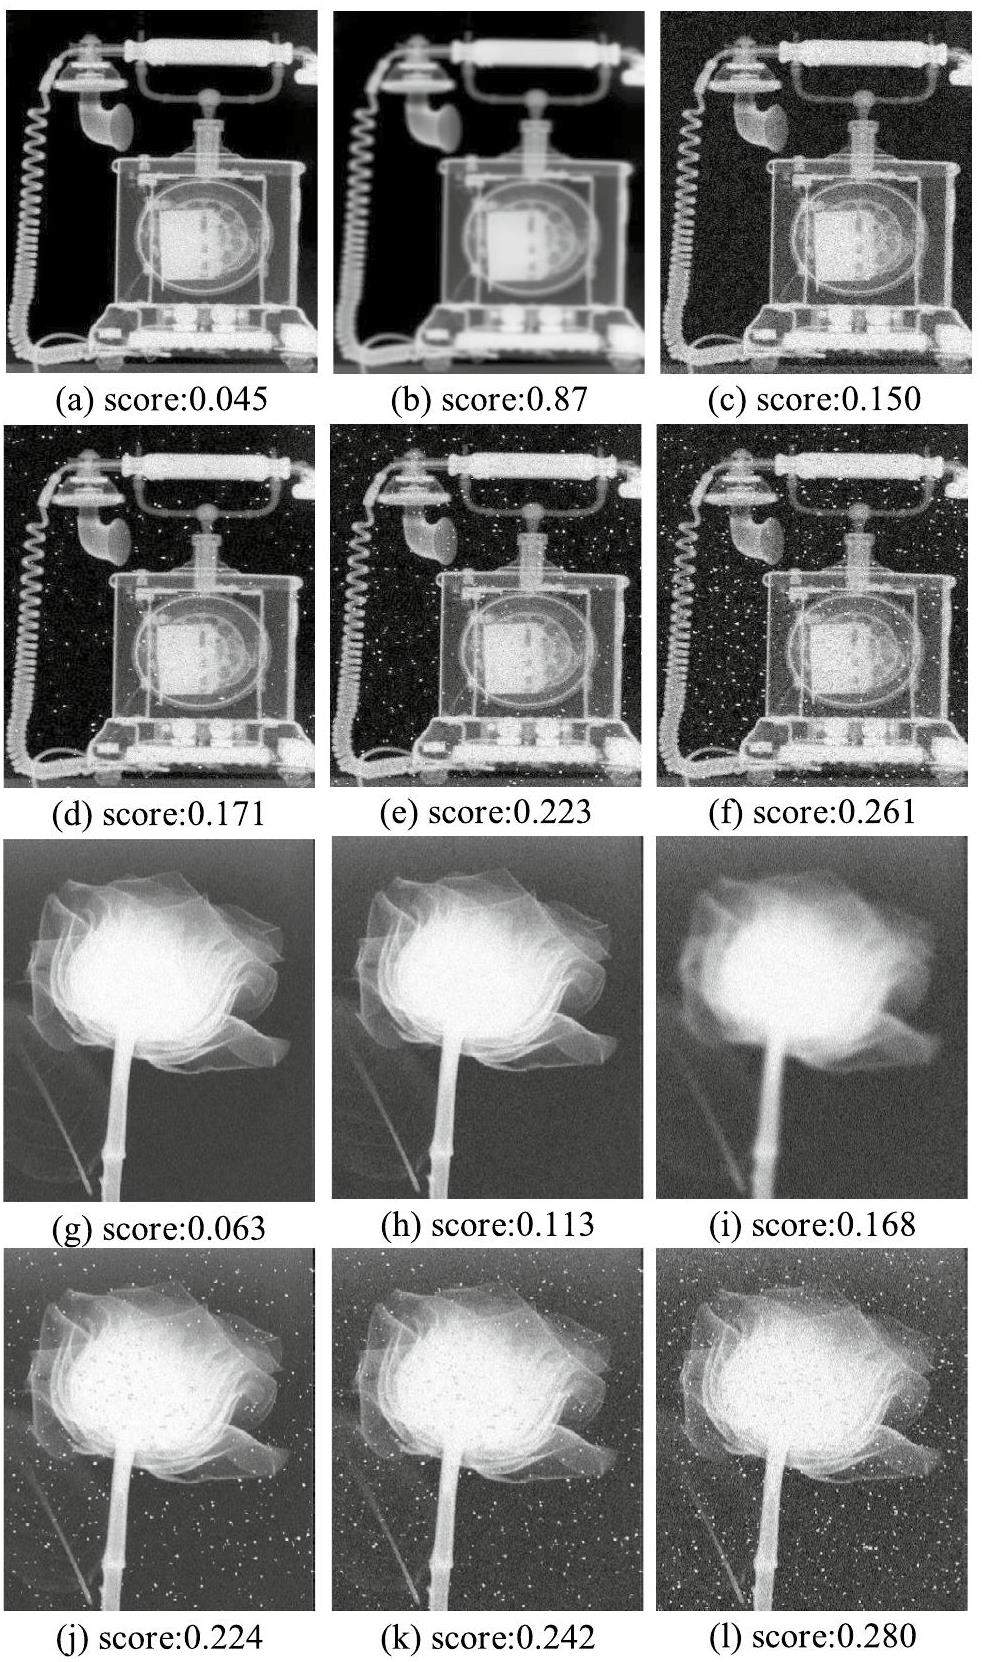
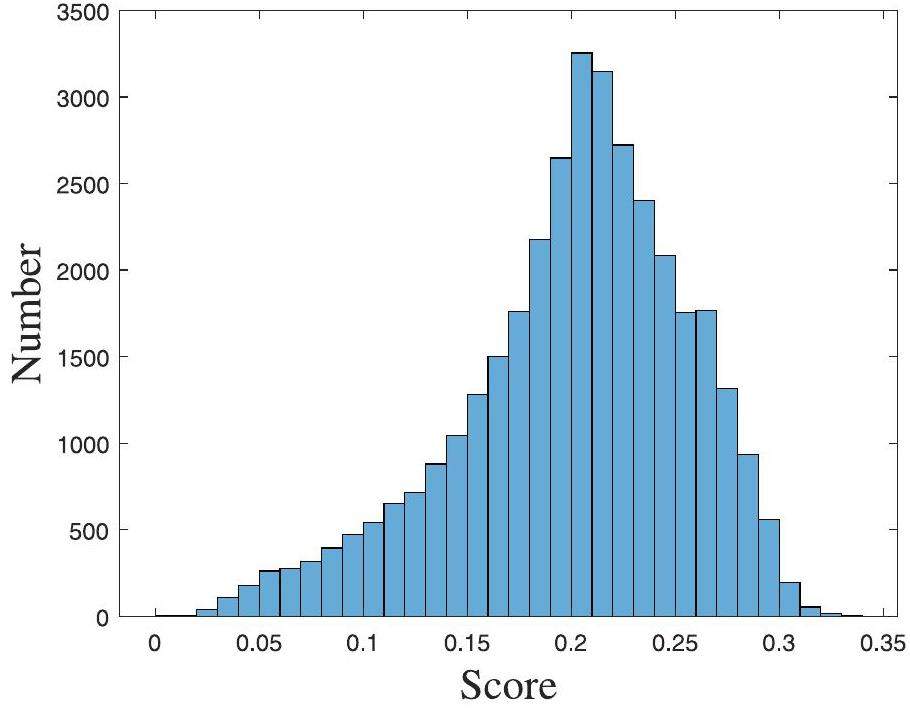
According to the degree of dependence on the reference image, IQA can be categorized as full-reference image quality assessment (FR-IQA), semi/reduced-reference image quality assessment (S/RR-IQA), or no-reference image quality assessment (NR-IQA). Owing to the lack of an ideal reference image for on-site NR, the classical full-reference IQA model cannot be applied. To achieve a no-reference image quality assessment (NR-IQA) for NRIs, the CNN framework is further employed to learn the abstract relationship between the degraded NRIs and the corresponding quality scores based on the constructed quality assessment Dataset C. Using the aforementioned image quality calibration method, the degraded NRIs of Dataset C are labeled with the quality scores, as shown in Fig. 7. From left to right in Fig. 7, the level of image quality decreased, and the calibrated image quality score increased accordingly. Specifically, the constructed IQA Dataset C contained 20,000 synthetic NRIs generated from 30 high-quality original NRIs with different types and intensity distortions, including noise, blurring, white spots, and mixed distortions. A histogram of the score distribution of the constructed IQA dataset is presented in Fig. 8, which can be used to achieve subsequent end-to-end training.
The proposed CNN framework for no-reference image quality assessment
CNNs have achieved tremendous progress in pattern recognition. Therefore, we fully utilized the feature extraction and nonlinear fitting ability of the CNN to achieve a no-reference quality assessment of NRIs. To satisfy the miniaturization development requirements of NR devices, a lightweight CNN framework was designed, as shown in Fig. 9.
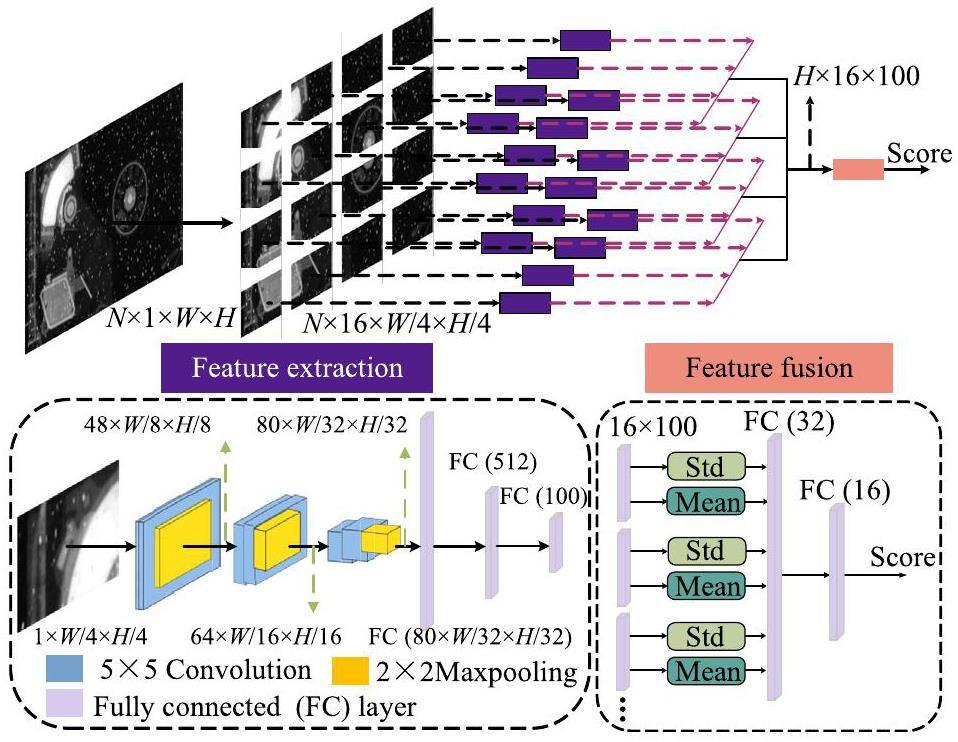
The input NRI was first cropped into four 4×4 subimages and thereafter fed into the feature extraction model to extract the image feature information. Finally, a feature fusion model was employed to obtain the predicted quality scores. Specifically, the CNN model comprises three convolutional and three fully connected (FC) layers. Each convolutional layer is equipped with a 5×5 filter. A smaller number of convolutional layers can mitigate the overfitting issues induced by small datasets [31]. Because severe image distortions can significantly affect subjective impressions [32], we incorporated two 2×2 max pooling operations after each convolutional layer to capture salient features. Moreover, to address the problem of the vanishing gradient existing in deep-learning-based methods, rectified linear unit (ReLU) activation functions [33] were applied to all layers except the final FC layer. The last FC layer with 100 dimensions was employed to obtain the feature vector of each subimage. For the feature fusion model, the mean and standard deviation of the feature vectors were selected as the most representative features [29, 34, 35]. After obtaining the standard deviation and mean of the feature vectors from each subimage using the feature extraction model, two FC layers were used to map them to the final predicted score for image quality.
Performance comparison of the proposed lightweight network with the mainstream networks
The performance was tested on the constructed IQA dataset with the ratio of the training set to the testing set divided at 8:2. Table 2 presents a performance comparison between the proposed lightweight network and other mainstream networks such as Resnet18 [36], AlexNet [37], DenseNet [38], VGG16 [39], VIT [40], and the Swin Transformer [41]. Floating point operations per second (FLOPS) and the number of parameters in each network were employed to evaluate the complexity. The PLCC and SROCC of the above networks were calculated to show the statistical results between the predicted and calibration scores of each network on the testing set. Table 2 indicates that the proposed network is very close to the state-of-the-art (SOTA) performance of the current mainstream network frameworks (e.g., ResNet18 and DenseNet), but with a significant reduction in calculation time and parameters, which is much more suitable for a compact NR system.
| Networks | FLOPS.(M) | Params.(M) | SROCC | PLCC |
|---|---|---|---|---|
| ResNet18 | 1823 | 11.1 | 0.945 | 0.940 |
| AlexNet | 714 | 61.1 | 0.932 | 0.927 |
| DenseNet | 2897 | 9.8 | 0.939 | 0.938 |
| VGG16 | 15466 | 134.3 | 0.798 | 0.794 |
| VIT | 2674 | 53.5 | 0.853 | 0.847 |
| Swin transformer | 4361 | 27.50 | 0.856 | 0.850 |
| Proposed | 442 | 9.34 | 0.929 | 0.927 |
Experiments and discussions
A series of experiments were conducted to evaluate the effectiveness of the proposed NR-IQA method on real NRIs. The following experiments were conducted on the same workstation with an AMD 3700X CPU and an NVIDIA RTX 4090 GPU.
Quality predictions on original NRIs
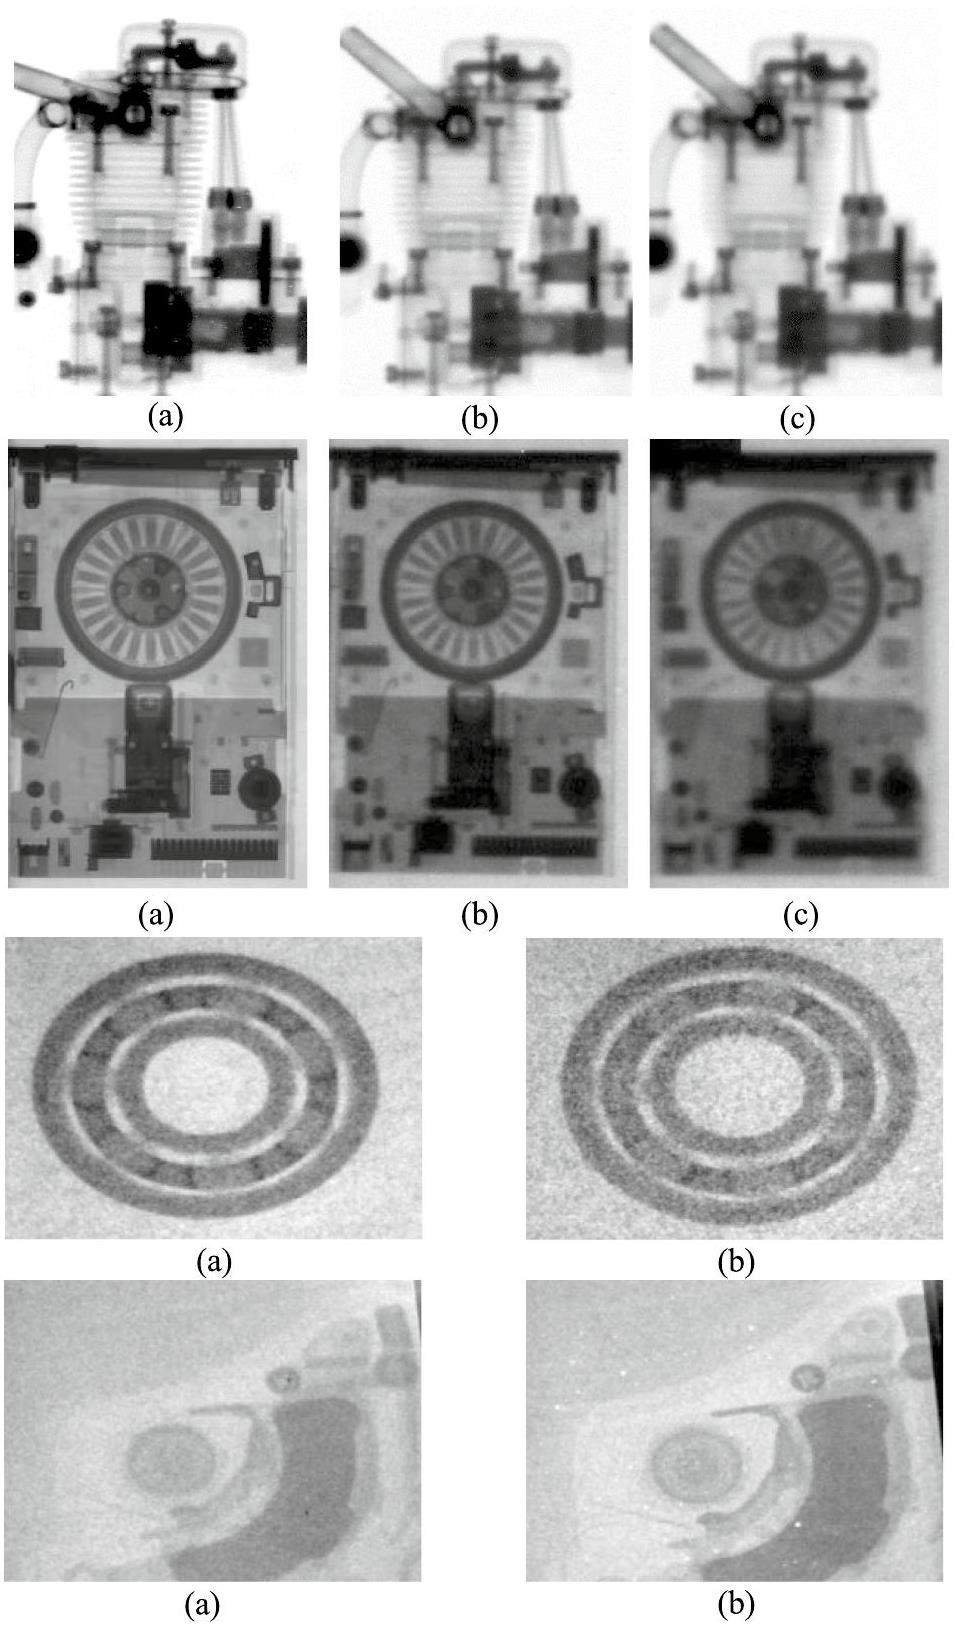
Specifically, the first line in Fig. 10 is the NRIs of the same small motor with different L/D ratios (i.e., 320, 115, and 71). The second line of Fig. 10 shows the NRIs of the same floppy driver taken at different distances (i.e., 0 cm, 10 cm, and 20 cm) but with the same L/D of 71. The third line of Fig. 10 shows the NRIs of a ball bearing with different imaging parameters, where (a) was obtained with an L/D of 20, exposure time of 5 min, and total fluence of 6×10⁷n/cm2, and (b) was obtained with an L/D of 50, exposure time of 10 min, and total fluence of 2.1×10⁷n/cm2. The fourth line of Fig. 10 shows the NRIs of a hard drive with and without the moderator, where an L/D of 50 and an exposure time of 10 min are set to be the same in this case. The visual quality shown in Fig. 10 gradually decreases from left to right, which is consistent with the imaging parameter settings. The NRIs in Fig. 10 were chosen to validate the subjective and objective consistency of the proposed IQA method with three NR-IQA counterparts: BLINDS [42], NIQE [43], and Qiao et al. [22]. The predicted quality scores are presented in Table 3. Note that, the symbol ‘+’ means that the higher the predicted score, the better the quality of the image, and ‘-’ means the opposite trend.
| Figure 10 | label | ||||
|---|---|---|---|---|---|
| Method | BLIINDS+ | NIQE- | Qiao [22]- | Proposed- | |
| 1st Line | (a) | 57.5 | 8 | 0.21 | 0.11 |
| (b) | 49 | 10.3 | 0.26 | 0.22 | |
| (c) | 4 | 5.1 | 0.32 | 0.24 | |
| 3*2nd Line | (a) | 32.5 | 5.4 | 0.22 | 0.11 |
| (b) | 17.5 | 12.4 | 0.35 | 0.19 | |
| (c) | 23.5 | 15.2 | 0.43 | 0.30 | |
| 3rd Line | (a) | 17.5 | 39.7 | 0.29 | 0.21 |
| (b) | 20.5 | 39.8 | 0.25 | 0.31 | |
| 4th Line | (a) | 15.5 | 35.2 | 0.31 | 0.23 |
| (b) | 7.5 | 33.6 | 0.30 | 0.27 | |
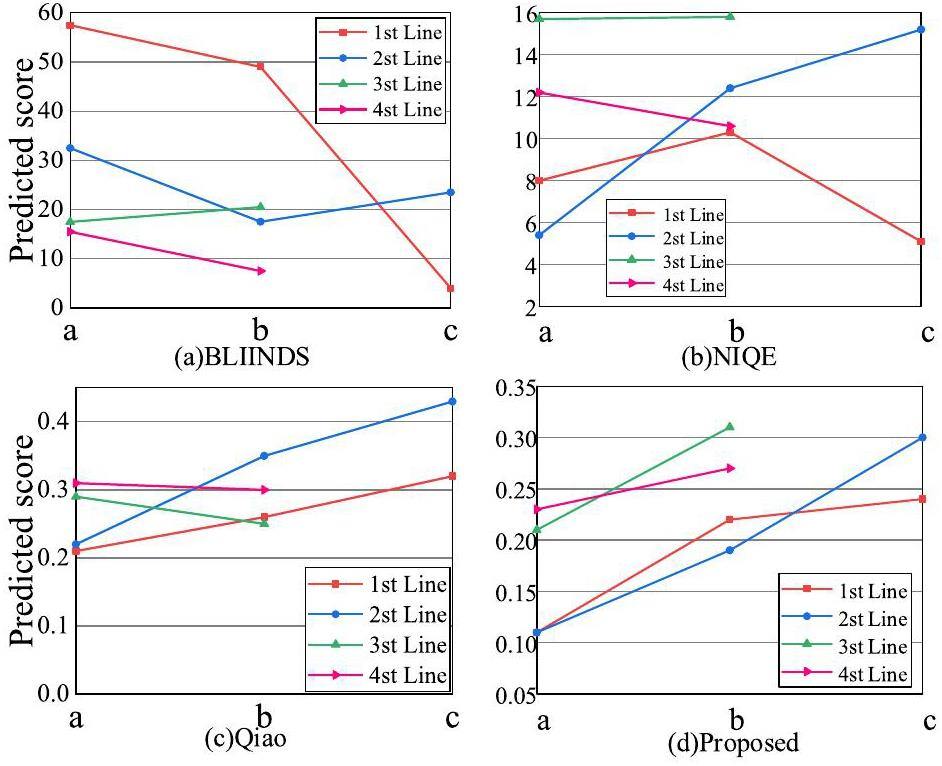
Because the evaluation metrics (e.g., score range and monotonicity, etc.) of different IQA methods are different, a quantitative comparison between these IQA methods is not fair. However, the subjective and objective consistency of each method indirectly reflects its effectiveness. As the visual quality of each line in Fig. 10 is known, we further drew a line graph of the predicted results of different IQA methods in Fig. 11 to illustrate the consistency with the perception trend. From the results in Fig. 11, we can conclude that only the proposed method shows remarkable consistency and monotonicity compared with the other NR-IQA methods. For the BLINDS method, although the predicted quality trends of the first and fourth lines of Fig. 11 are correct, the second and third lines show fluctuations and even opposite trends, which are not consistent with the real quality trend. For the method of NIQE, except for the second line showing the correct trend, the first line also shows fluctuations, and the third and fourth lines show incorrect trends. The poor performance of IQA methods such as BLIINDS and NIQE can be attributed to the design targets of natural images rather than NRIs. For the method proposed by Qiao et al., although the predictions of the first and second lines showed a satisfactory trend, the third and fourth lines were also incorrect. The main reason for this is that Qiao et al. did not consider the special distortion type of the white spots. Figure 11(d) shows the evaluated results of the proposed IQA method, which indicates that the proposed IQA can not only accurately predict the quality of the above real NRIs containing noise, blurring, and white spots but also matches the subjective evaluation trend well.
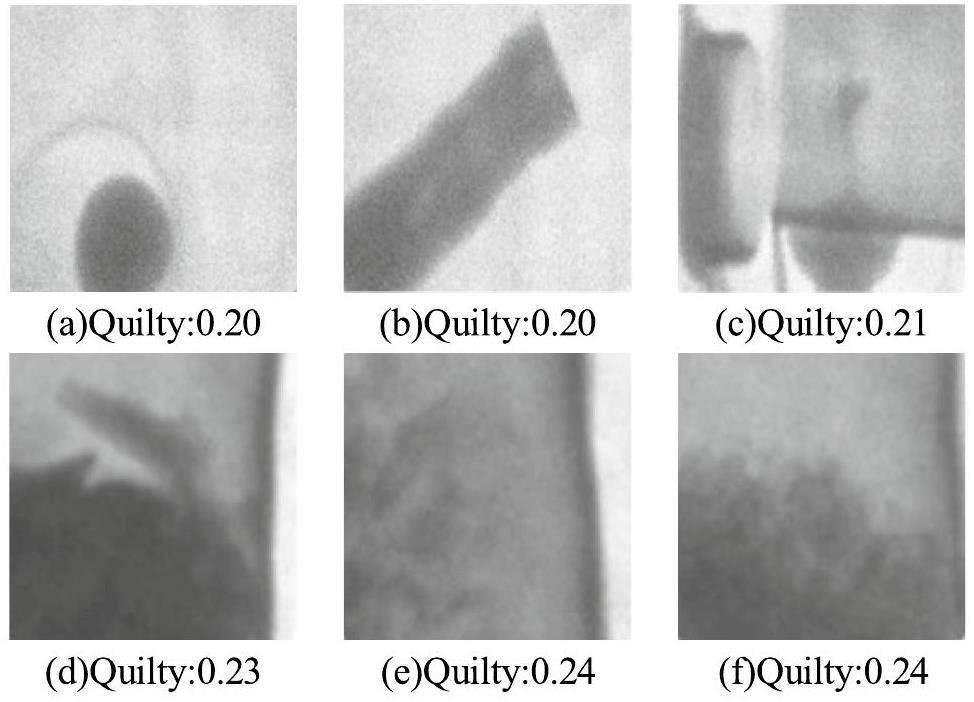
Although the subjective and objective consistency of the proposed IQA method was demonstrated by the NRIs (i.e., Fig. 10) obtained under different imaging parameters with significant quality differences, the robustness of the proposed IQA in evaluating NRIs with small quality differences still needs to be verified. In addition, a good IQA method should only be relevant to the distortions of the image rather than the content of the images.
To verify this, two sets of NRIs are selected, as shown in Fig. 12 and 13. Specifically, for the first line of Fig. 12, this group of NRIs for different objects [44] was obtained using the same equipment with the same imaging parameters, which means that the quality of these NRIs should be similar. The second line in Fig. 12 [44] is another group of NRIs of the same object in different states, which is also obtained using the same equipment with the same imaging parameters. The predicted quality scores in Fig. 12 using the proposed IQA method indicate that the proposed method is robust in evaluating NRIs with small quality differences.
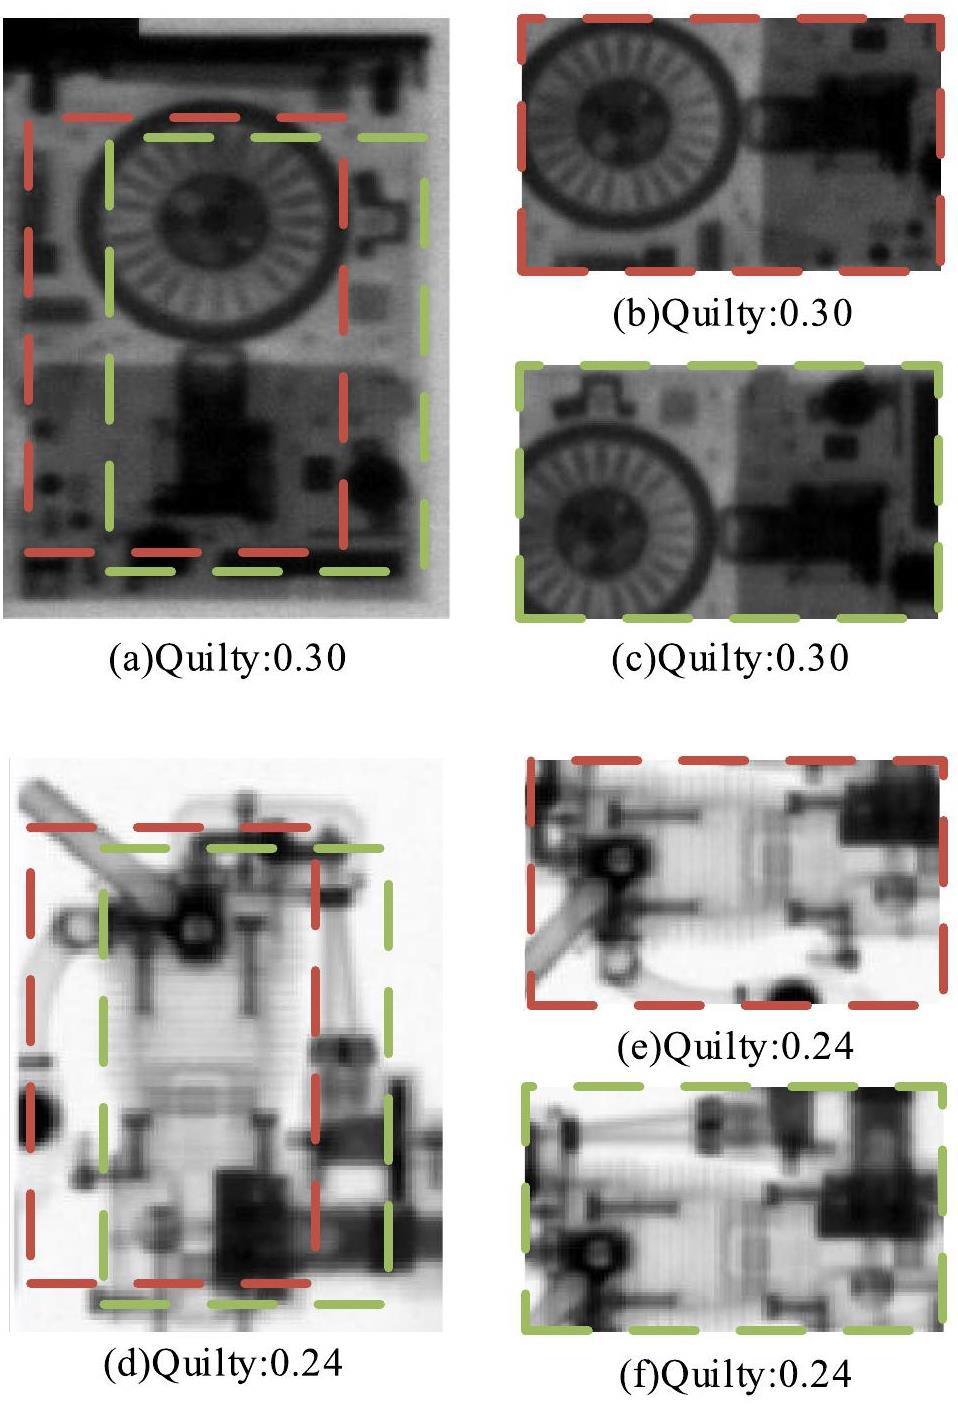
Simultaneously, we believe that the local and whole NRIs should have similar quality scores. Therefore, we cropped the same NRIs into two sub-images containing most of the detected objects and backgrounds, as shown in Fig. 13. Note that the two cropped subimages contain overlapping areas. The same prediction results further demonstrate the accuracy of the proposed IQA method for evaluating NRIs with small quality differences.
Quality predictions on the enhanced NRIs via ImageJ with different thresholds
A good IQA method should also have the capability to evaluate both the original and processed images, which can be used as an objective metric for optimizing image-processing algorithms. Therefore, the validity of the proposed method was demonstrated by the consistency of the enhanced images with their corresponding scores. Fortunately, this can be realized using the well-known software ImageJ [45]. It can easily yield a series of enhanced images of sorted quality. Specifically, we can set several sorted thresholds by using the function of ‘Process-noise-Remove Outside’ of ImageJ to improve the quality of NRIs with significant white spots. Note that a smaller threshold value results in a superior suppression effect on the white spots. The original NRI and processed NRIs using ImageJ with sorted thresholds are shown in Fig. 14, which shows a decreasing trend in the visual quality from (a) to (k).
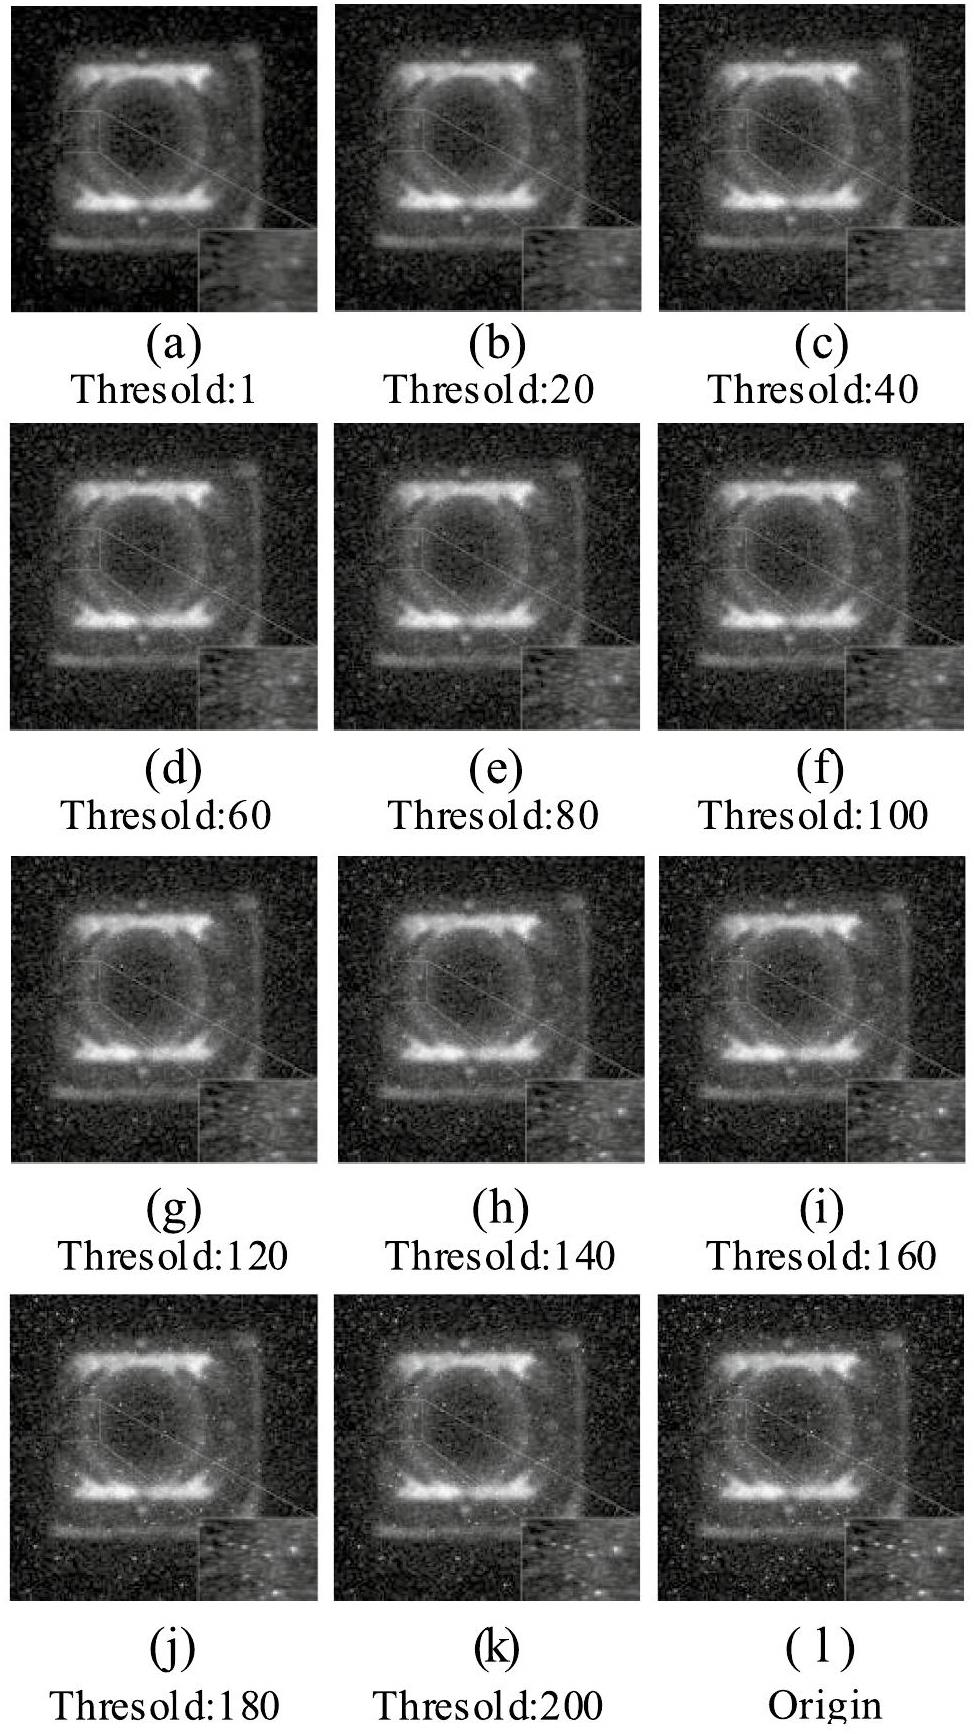
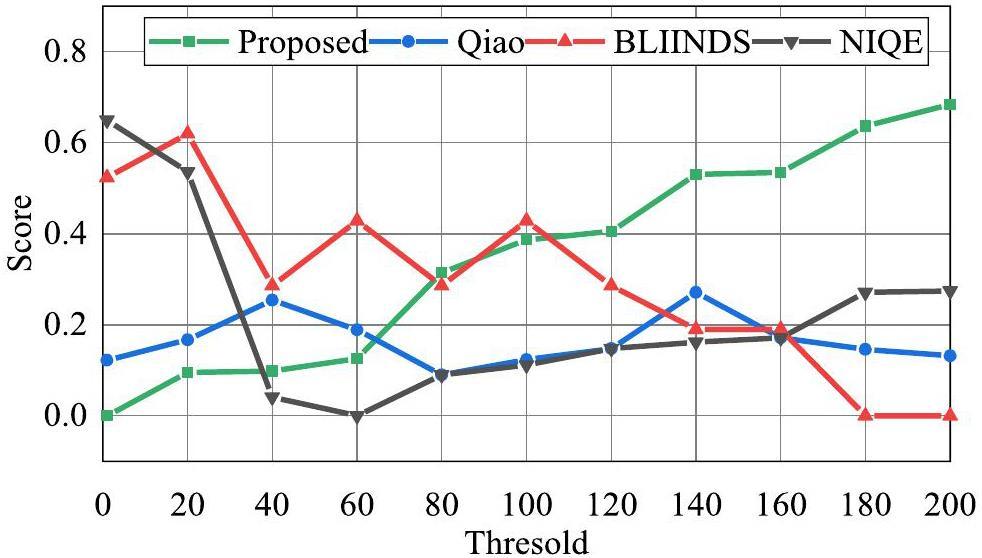
In addition, the quality prediction of Fig. 14 using the proposed NR-IQA method and its three counterparts is shown in Fig. 15. For BLIINDS, it fails to perceive subtle changes in quality scores resulting from minute enhancements (e.g., thresholds from 1 to 200). The NIQE method has large quality fluctuations that are not consistent with the above analysis. For the method proposed by Qiao et al., it is difficult to perceive changes in the white spots. Only the proposed method exhibited a trend consistent with the parameter setting of ImageJ. In addition, we calculated the correlation coefficients (i.e., SROCC and PLCC) and root mean square error (RMSE) of the quality evaluation and parameter settings of ImageJ, as well as the average of the above results, to quantitatively analyze the performance of the above IQA methods in Table 4. The results indicate that the proposed method exhibits superior performance in terms of SROCC, PLCC, RMSE, and so on.
| Index | ||||
|---|---|---|---|---|
| Method | BLIINDS | NIQE | Qiao et al. [22] | Proposed |
| SROCC | 0.850 | 0.385 | 0.312 | 0.993 |
| PLCC | 0.803 | 0.409 | 0.249 | 0.987 |
| RMSE | 0.789 | 0.272 | 0.345 | 0.978 |
| Average | 0.814 | 0.355 | 0.302 | 0.986 |
Quality predictions on the enhanced NRIs with different image processing algorithms
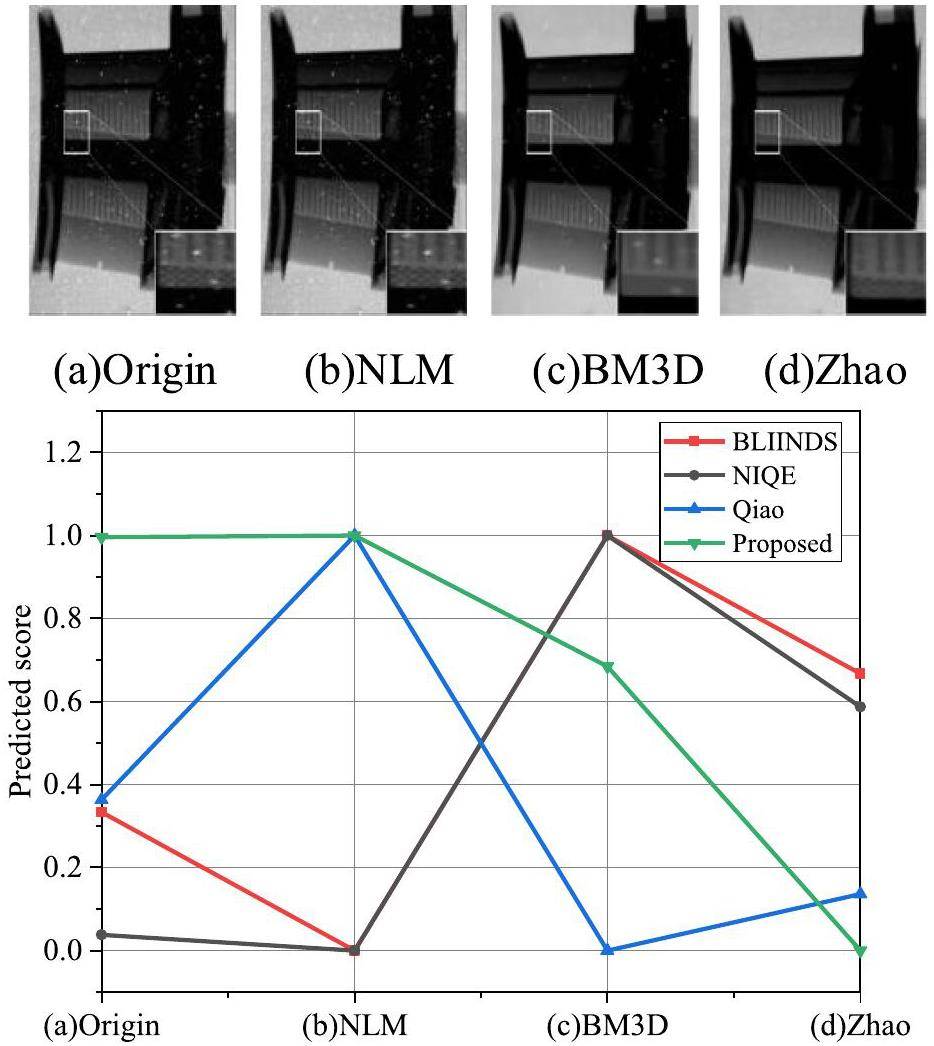
In the previous subsections, we validated the performance of the proposed method using the well-known software ImageJ. In this section, we use a series of advanced image-processing algorithms to further demonstrate the effectiveness of the proposed method. Four algorithms, including Non-Local Means (NLM), BM3D Frames [17], KSVD [46], and Zhao et al. [47], were employed to suppress the distortion of white spots. Because the white spots have the properties of high light and a large area, the three-dimensional (3D) grayscale distribution of local images containing white spots is chosen and illustrated in Fig. 16. The suppression effects of white spots can indirectly reflect the quality of the enhanced NRIs. These NR-IQA methods were then employed to predict the quality score of the original NRI and its corresponding processing results using different algorithms. From the viewpoint of 3D distribution, the white-spot suppression effect of NLM is very limited. Although BM3D can filter white spots to some extent, additional blurring is generated owing to the nature of the filtering algorithm. The final algorithm proposed by Zhao et al. showed the best suppression effect for white spots. The above analysis and perception quality indicate that only the proposed method shows good consistency between the predicted and perceptual quality.
Conclusion
In this study, a comprehensive image quality assessment method is proposed for neutron radiographic images based on a lightweight convolutional neural network. Large-scale NRI datasets with more than 20,000 images were constructed, including high-quality original NRIs and synthetic NRIs with multiple distortions. Subsequently, an image quality calibration method based on visual salience and a local quality map is proposed to label the NRI dataset with quality scores. After end-to-end training on the constructed IQA dataset, a no-reference image quality assessment was achieved. Extensive experimental results demonstrate that the proposed IQA method exhibits good consistency with human visual perception in evaluating real NRIs as well as processed NRIs with enhancement and restoration algorithms, thus demonstrating its application potential in the field of neutron radiography.
Advancing elastic wave imaging using thermal susceptibility of acoustic nonlinearity
. Int. J. Mech. Sci. 175,Laser-driven x-ray and neutron source development for industrial applications of plasma accelerators
. Plasma Phys. Contr. F. 58,Non-destructive testing and evaluation of composite materials/structures: a state-of-the-art review
. Adv. Mech. Eng. 58, 1687 (2020). https://doi.org/10.1177/1687814020913761The main factors influencing the performance of neutron radiography
. Nucl. Electron. Detection Technol. 24, 387-390 (2004). (in Chinese)Statistical uncertainty in quantitative neutron radiography
. Eur. Phys. J. Appl. Phys.78, 10702 (2017). https://doi.org/10.1051/epjap/2017160336Contrast sensitivity in 14 MeV fast neutron radiography
. Nucl. Sci. Tech. 28, 78 (2017). https://doi.org/10.1007/s41365-017-0228-5Study on moderators of small-size neutron radiography installations with neutron tube as source
. Nucl. Sci. Tech. 175, 129-134 (1995).Design of a mobile neutron radiography installation based on a compact sealed tube neutron generator
. Nucl. Sci. Tech. 8, 53-55 (1997).Availability of MCNP & MATLAB for reconstructing the water-vapor two-phase flow pattern in neutron radiography
. Nucl. Sci. Tech. 19, 282-289 (2008). https://doi.org/10.1016/S1001-8042(09)60005-1Thin-film approximate point scattered function and its application to neutron radiography
. Nucl. Sci. Tech. 33, 109 (2022). https://doi.org/10.1016/j.ijmecsci.2020.105509Feasibility study of portable fast neutron imaging system using silicon pho-tomultiplier and plastic scintillator array
. Nucl. Tech. (in Chinese) 44,Super fifield of view neutron imaging by fifission neutrons elicited from research reactor
. Nucl. Tech. (in Chinese) 46,Simulation and optimization for a 30-MeV electron accelerator driven neutron source
. Nucl. Sci. Tech. 23, 272-276 (2012). https://doi.org/10.13538/j.1001-8042/nst.23.272-276Material decomposition of spectral CT images via attention-based global convolutional generative adversarial network
. Nucl. Sci. Tech. 34, 45 (2023). https://doi.org/10.1007/s41365-023-01184-5Calculation and analysis of the neutron radiography spatial resolution
. Nucl. Tech. (in Chinese) 37,A new method by steering kernel-based Richardson-Lucy algorithm for neutron imaging restoration
. Nucl. Instrum. Methods. Phys. Res. A 735, 541-545 (2014). https://doi.org/10.1016/j.nima.2013.10.001Neutron radiographic image restoration using BM3D frames and nonlinear variance stabilization
. Nucl. Instrum. Methods. Phys. Res A 789,An effective gamma white spots removal method for CCD-based neutron images denoising
. Nucl. Instrum. Methods Phys.Res A 150,Design of moderator and collimator for compact neutron radiography systems
. Nucl. Instrum. Methods Phys. Res A 959,Multi-distortion suppression for neutron radiographic images based on generative adversarial network
. Nucl. Sci. Tech. 35, 81 (2024). https://doi.org/10.1007/s41365-024-01445-xNo-reference quality assessment for neutron radiographic image based on a deep bilinear convolutional neural network
. Phys. Nucl. Instrum. Methods. Phys. Res. A 1005,A practical residual block-based no-reference quality metric for neutron radiographic images
. Phys. Nucl. Instrum. Methods. Phys. Res. A 1019,Research on the Application of improved RPCA Method in the Removal of white speckle Noise in Neutron Images
. Dissertation,Gradient magnitude similarity deviation: A highly efficient perceptual image quality index
. IEEE. Trans. Image. Process 23, 684-695 (2014). https://doi.org/10.1109/TIP.2013.2293423Context-Aware Saliency Detection
. IEEE. Trans. Pattern. Anal. Mach. Intell. 34, 1915-1926 (2012). https://doi.org/10.1109/TPAMI.2011.272Modern image quality assessment
. Diss. Morgan & Claypool Publishers 2, 1-156 (2006). https://doi.org/10.1103/10.1007/978-3-031-02238-8Gradient information-based image quality metric
. IEEE. T. CONSUM. ELECTR. 56, 930-936 (2010). https://doi.org/10.1109/TCE.2010.5506022.Peak signal-to-noise ratio revisited: Is simple beautifu
, International Conference on Quality of Multimedia Experience, (Image quality assessment: from error visibility to structural similarity
. IEEE.Trans.Image.Process. 13, 600-612 (2004). https://doi.org/10.1016/0375-9474(91)90748-UFully deep blind image quality predictor
. IEEE. J-STSP. 13, 600-612 (2004). https://doi.org/10.1109/JSTSP.2016.2639328Visual Importance Pooling for Image Quality Assessment
. IEEE. J-STSP, 3, 193-201 (2009). https://doi.org/10.1109/JSTSP.2009.2015374Rectified Linear Units Improve Restricted Boltzmann Machines
, International Conference on Machine Learning, (37 807-814 2010). https://doi.org/10.5555/3104322.3104425Multiscale structural similarity for image quality assessment
. The Thrity-Seventh Asilomar Conference on Signals, SystemsδComputers, (Completely blind image quality analyze
. IEEE. Signal. Proc. Let. 20, 209-212(2013). https://doi.org/10.1109/LSP.2012.2227726Deep residual learning for image recognition
. IEEE Conference on Computer Vision and Pattern Recognition(CVPR), (ImageNet classification with deep convolutional neural networks
, Communications of the ACM, 60, 84-90 (2012). https://doi.org/10.1145/3065386Densely connected convolutional networks
. IEEE Conference on Computer Vision and Pattern Recognition (CVPR), (Very deep convolutional neural network based image classification using small training sample size
,An image is worth 16 ×16 words: Transformers for image recognition at scale
. https://doi.org/10.48550/arXiv.2010.11929Swin transformer: Hierarchical vision transformer using shifted windows
. 2021 IEEE/CVF International Conference on Computer Vision (ICCV), (Blind Image Quality Assessment: A Natural Scene Statistics Approach in the DCT Domain
. IEEE Trans. Image. Process 1, 3339-3352 (2012).. https://doi.org/10.1109/TIP.2012.2191563A statistical evaluation of recent full reference image quality assessment algorithms
. IEEE Trans.I mage.Process. Let. 15, 3441-3452 (2006). https://doi.org/10.1109/LSP.2012.2227726A novel method for NDT applications using NXCT system at the Missouri University of Science & Technology
. Nucl. Instrum. Methods. Phys. Res. A. 750, 43-55 (2014). https://doi.org/10.1016/j.nima.2014.03.002Fiji: an open-source platform for biological-image analysis
. Nature Methods. 9, 676-682 (2012). https://doi.org/10.1038/nmeth.2019K-SVD: An algorithm for designing overcomplete dictionaries for sparse representation
. IEEE T. Signal Proces. 54, 4311-4322 (2006). https://doi.org/10.1109/TSP.2006.881199An effective gamma white spots removal method for CCD-based neutron images denoising
. Phys. Fusion. Eng. Des 150,The authors declare that they have no competing interests.


