Introduction
Hadron linear accelerators (hadron linacs) are crucial scientific instruments with significant applications in many fields. Examples include PIP-II [1] for the pursuit of the intensity frontier in particle physics; FRIB [2] and TRIUMF [3] for rare isotope production in experimental nuclear physics; SNS [4], ISIS [5], J-PARC [6], CSNS [7], and ESS [8] as spallation neutron sources for materials research; numerous machines for nuclear medicine [9, 10]; and CiADS [11, 12] as a demonstration of an accelerator-driven system in advanced nuclear energy. In the 21st century, research linacs have increasingly utilized superconducting cavities, which have lower operating costs than normal conducting cavities and enable high-current operation [4, 13].
Linacs employ independently phased resonant cavities to accelerate the beam particles. As a linac is tuned-up, to achieve the designed energy profile and ensure stable longitudinal dynamics, each cavity must be phased correctly such that the beam particles arrive at each cavity during the design phase. This phase-setting or turn-on problem has been a longstanding challenge for linacs, because uncertainties over the relevant beam and cavity parameters can render direct model-based calculations unfeasible.
A conventional solution to the phase-setting problem is a cavity phase scan [14, 15] at the beginning of each linac tune-up. Although cavity phase scans require limited knowledge at the start and accommodate many common uncertainties, cavities can only be set up individually, and each cavity takes several minutes to set up. In superconducting linacs, where the number of independently phased structures is typically larger for a given energy gain [16], linac tune-up via phase scans is a time-consuming procedure that can take several hours.
To satisfy the demands for rapid beam tune-up, automatic phase setting is rapidly emerging as a new technique for the tune-up of modern superconducting linacs, such as those at SNS [17], FRIB[18], and TRIUMF [19]. Automatic phase-setting capabilities are a prerequisite for rapid online fault compensation [20, 21], which is an essential feature in applications such as accelerator-driven systems that require effort to limit the duration of beam trips and boost reliability.
Automatic phase-setting relies on alignment and phase calibration techniques to obtain sufficient knowledge of relevant linac parameters, such that the input phase values can be obtained from model calculations. This enables a superconducting linac to be set up in minutes and significantly accelerates tune-up. The conventional method involves obtaining the required position information separately via surveys or monitors [22] and phase information via calibration experiments.
In this study, a beam-based method is proposed that employs time-of-flight (TOF) experiments to simultaneously determine the cavity and beam position/phase monitor (BPM) positions in addition to cavity phase offsets. This method is particularly useful for implementing automatic phase setting in superconducting linacs because it can account for the longitudinal position shifts of cavities and BPMs within cryomodules (CMs) during cool-down, which may significantly affect the accuracy of the phase calculation model.
The remainder of this paper is organized as follows. Section 2 elaborates on the phase-setting problem and its relevant parameters, followed by a discussion of two potential solutions: cavity phase scan and automatic phase-setting. In Sect. 3, a set of alignment and calibration experiments are described based on TOF measurements and data analysis that enable the beam-based calibration of both cavity positions and cavity phase offsets. The results of an experiment at the CAFe II accelerator are reported in Sect. 4, followed by the successful application of the calibration results to automatic phase-setting at CAFe II. The conclusions of this study and proposals for further research are presented in Sect. 5.
Phase-Setting Problem
Cavity Phase upon Beam Arrival
For a given cavity, the relationship between the set phase φset and the phase of the cavity when the beam arrives φin is given by:
The phase-setting problem involves finding the correct φset for each cavity such that the corresponding φin is equal to the value in the beam dynamics design. As shown in Eq. (1), for a given target φin, setting φset requires knowledge of φoffset and φRF-ref.
φRF-ref is highly sensitive to differences in the upstream beam conditions between runs. Therefore, phase-setting is not a one-off problem that can be solved by reusing φset once a successful run is achieved. At the start of each new run, φset for each cavity must be correctly reset according to the unique beam conditions.
φoffset is often assumed to be a fixed parameter in the absence of hardware changes. Under this assumption, φoffset must only be measured once per hardware setup; however, it is currently unfeasible to directly measure it electronically. In practice, φoffset experiences small drifts during day-to-day operation, particularly in older facilities. Such time drifts introduce additional errors in future phase-settings after φoffset is calibrated. As an ongoing research subject, where recent advances include time-drift-aware optimization techniques based on machine learning [23, 24], this problem is beyond the scope of this study. Time drifts are ignored in φoffset in the following sections.
The description above uses φin, the cavity phase when the beam reaches the entrance of the cavity, which can be taken as the upstream end of the cavity fringe fields. φin is selected rather than the synchronous phase φs because the former is unambiguous. Although φs is part of the standard description in the basic treatment of beam acceleration and longitudinal dynamics, it has different possible definitions once the constant-velocity assumption no longer holds within the cavity, and such an ideal assumption operates poorly in hadron linacs, particularly in the low-β section. To avoid obtaining the details for defining φs, only the calculation of φin is discussed. Such a treatment does not affect the utility of the results because regardless of the definition of φs, given the incoming beam energy and cavity field distribution, φs can always be calculated from φin. Considering the existence of such a conversion, only φin is used in this study.
Relevant Parameters and Uncertainties
Given a new superconducting linac, typical knowledge about the relevant parameters of cavities and BPMs in CMs is shown in Table 1. BPMs are standard diagnostic devices that can return both the transverse position and arrival phase of a beam up to a fixed phase offset relative to the RF reference line [25]. The BPM parameters are crucial because phase-setting is typically resolved with the aid of measurements from BPMs installed along the entire linac [26].
| Cavity | Position | ±2.5 mm |
| Phase offset | No prior knowledge | |
| Voltage Coefficient | 1 ± 0.3 | |
| BPM | Position | ± 2.5 mm |
| Phase Offset | No prior knowledge |
The phase offsets of the cavities and BPMs are completely unknown, whereas uncertainties over the longitudinal positions of the cavities and BPMs, caused by structural displacements in the CM during cool-down, are estimated assuming that intra-CM position monitors are absent. These values are close to the typical tolerances for the longitudinal displacements [27, 28] or cavity phases [29] in CMs. Note that these two tolerances can be approximately converted by simply exchanging mm with °. Suppose that the beam velocity is in the β=0.1 regime, where the cavity frequency is typically ≈ 100 MHz. A longitudinal displacement of 1 mm then approximately corresponds to a phase error of 1.2° because
The cavity voltage coefficients provide the ratio between the set and the true voltages, which is typically in the neighborhood of unity. These coefficients are also required to set up the beam acceleration correctly, but they are fixed parameters that can be obtained from one conventional phase scan and thus are significantly less challenging than phase-setting.
Cavity Phase Scan
A widely used technique for resolving the phase-setting problem is the cavity phase scan [14], where φset corresponding to the desired φin is found without explicit knowledge of φRF-ref and φoffset. This can be achieved by scanning the operating phases of the cavities, recording the phases of the beam upon reaching the downstream BPMs, and obtaining a sine-like curve that represents the cavity-BPM phase relationship, often referred to as the signature of the phase scan. Next, in a procedure that is often referred to as signature matching, mathematical modeling is employed to determine the cavity voltage and φin [15], and occasionally the incoming beam energy, under the criterion that the modeled curve fits the phase scan results by matching the phase scan signature. If the information from a single phase scan is insufficient, the scan is repeated at different cavity voltages to obtain better fitting results.
In the two-BPM version of the cavity phase scan [14, 30], the only requisite knowledge is the relative distance between the two BPMs downstream of the cavity, where the relative phase difference upon beam arrival is used to obtain the cavity-BPM phase relationship. The exact position of the cavities, zcav, is not required in the calculations, which can avoid the problem of displacements within CMs due to cool-down.
A cavity phase scan is performed sequentially through the linac, cavity by cavity. Hence, the larger the number of cavities, the longer the process. Even in linacs where automatic phase-setting is implemented, a cavity phase scan is often an indispensable step in the calibration stage.
Automatic Phase-Setting
As phase scans are time-consuming, many linac facilities, notably SNS and FRIB, have developed methods to tune-up the linac without phase scans, which can reduce the tune-up time by two orders of magnitude, from ~10 h to ~10 min [18, 31]. In these methods, a beam-based TOF calibration experiment [32] involving a phase scan alongside additional BPM measurements is first conducted to calculate φoffset. Once all φoffset are known, they can be employed to accurately calculate φRF-ref in each cavity, thereby achieving an automatic phase-setting in each subsequent tune-up. Both the calibration and automatic phase-settings require good knowledge of the cavity positions provided by alignment surveys.
Table 2 presents a comparison of different solutions that employ BPM phase information for the phase-setting problem. The proposed method is listed in the rightmost columm, where both the cavity and BPM positions are obtained via TOF alignment. A method that simultaneously performs the alignment and phase calibration is introduced in the following section.
| Phase Scan | Automatic Phase-Setting | Automatic Phase-Setting with TOF Alignment | |
|---|---|---|---|
| φRF-ref | Unknown / not needed | Model calculations | Model calculations |
| φoffset | Unknown / not needed | TOF calibration | TOF calibration |
| φin | Signature matching | Eq. (1) | Eq. (1) |
| zcav | Unknown / not needed | Survey / monitor | TOF alignment |
| zbPM | Survey / monitor | Survey / monitor | TOF alignment |
| Time required per cavity | ~ 102 sec | ~1 sec | ~1 sec |
TOF Alignment and Phase Calibration
Linac Setup
To apply the TOF alignment and calibration method, the linac setup must fulfill two requirements [33]. First, there must be a pair of BPMs not far downstream of every cavity such that it is possible to conduct a conventional phase scan. As conventional phase scans are compulsory in modern hadron linacs, this requirement is always satisfied. Second, there must be an energy measurement device downstream of the last cavity, normally in high-energy beam transport (HEBT), which follows the superconducting section. In this study, it was assumed that the energy measurement was performed via TOF on a pair of BPMs dedicated to this purpose. This is the most common and practical setup used for accelerated hadron beams. This method still applies if the energy is measured using other means.
All the quantities listed in Table 1 were determined via TOF experiments and subsequent data analysis. Once obtained, they do not need to be measured again unless the linac hardware changes.
It is noteworthy that this TOF alignment and calibration method is applicable only to hadron linacs. As electrons are highly relativistic, each superconducting cavity can create only minuscule velocity changes, and the resulting differences in TOF measurements are far below the noise level of the phase monitors.
Calibration Experiment
The calibration experiment comprised two steps. The first step was a forward phase scan that moved forward through the entire linac and performed a phase scan on each cavity. Conversely, the second step was a backward voltage scan that conducted a voltage scan on each cavity from the exit to the entrance.
Forward Phase Scan
The goal of the forward phase scan is to set the phase of each cavity so that it accelerates the beam and provides proper longitudinal focusing. Even though detailed information about cavities and BPMs is not present at this stage, a preliminary beam dynamics design can be created based on prior knowledge of the cavity and BPM positions. Based on this design, an empirical approach can be applied to perform phase scans in the following manner. Starting from the first cavity:
1. Set the cavity voltage to the design value.1
2. Scan the cavity phase φset over 360° and measure the arrival phases of the beam φa and φb at the two nearest downstream BPMs. Record φa and φb as a function of φset.
3. Plot φset vs φb-φa, adding or subtracting appropriate multiples of 360° at each φb-φa to ensure a sine-like curve.
4. Set φset to a phase that is
5. Repeat steps one to four at the next cavity, until the last cavity is reached.
In the last cavity, BPMs dedicated to TOF energy measurements can be utilized to perform the phase scan. Note that, in step two, the cavity phase φset must be scanned over an interval sufficiently small to reconstruct a sine-like curve without ambiguities in step three. The typical interval is 10°. φset is also scanned over 360° to ensure that φset vs φb-φa is 360° periodic in φset, thus avoiding errors in the multiples of 360° added or subtracted in step four.
It is possible to attempt TOF energy measurements throughout the forward phase scan and record the results. However, most results would probably be unreliable owing to poor longitudinal focusing of the beam during a phase scan. Hence, a backward voltage scan is also required to accumulate sufficient data for calibration.
Backward Voltage Scan
The goal of the backward voltage scan is to measure the TOF of the beam at several energy values. The cavity voltage, rather than the cavity phase, is scanned to vary the energy while maintaining a longitudinal focusing effect, such that the bunch can be kept sufficiently short for TOF measurements as far downstream as possible.2 Using the linac configuration established by the forward phase scan, the backward voltage scan proceeds as follows. Starting from the last cavity:
1. Decrease the voltage of the cavity in discrete amounts down to zero. At each voltage value, record the TOF velocity and phase measurements of all downstream BPMs over multiple pulses.
2. After recording data at a zero cavity voltage, turn-off and detune the cavity to prevent interference with the beam energy in subsequent measurements.
3. Repeat steps one and two at the cavity upstream, and conclude the experiment after the voltage scan is performed on the first cavity.
Throughout the backward voltage scan, the transverse focusing and steering are adjusted as required to ensure proper beam transport.
Data Analysis
The measurement results from the calibration experiment were analyzed in several steps, with each step depending on the analysis in the previous steps. The analysis provides the relative positions and relative phase offsets between all the cavities and BPMs in the linac. Section 3.4 addresses whether absolute positions and phase offsets are required and how the calibration results can be utilized to achieve automatic phase-setting.
BPM Positions and Phase Offsets
The results from the backward voltage scan were first used to obtain the relative positions and phase offsets between pairs of BPMs. For any pair of BPMs, denoted by BPM-a and BPM-b, with the latter located downstream, the measured phases and TOF measurements at the end of the linac are related by:
The relationship between BPM phase readings and time is as follows:
The scatter plot consists of points from each measurement that obeyed the following conditions:
1. There is no acceleration after BPM-a;
2. The TOF energy measurements are reliable.
For BPMs far from the end of the linac, TOF energy measurements may become unreliable because the bunch is significantly lengthened. In this case, BPM pairs closer to TOF-BPMs, with relative positions and phase offsets that have already been calibrated, can be utilized as TOF devices.
Cavity φin and Voltage Coefficient
For each cavity, once the relative position and phase offset between the nearest pair of downstream BPMs are known, they can be utilized in the analysis of the forward phase scan data to determine the incoming beam energy φin and the voltage coefficient. This is a common procedure in conventional phase scans, where the cavity model is used to calculate the output energy, and unknown quantities are fitted such that the calculated curve matches the measured φset vs (φb– φa) curve. The fitting is even simpler in this case, because the incoming energy is known from TOF measurements at zero cavity voltage as a part of the backward voltage scan. Therefore, only φin and voltage coefficient must be determined.
Cavity Positions
Once φin and the voltage coefficient for a cavity are known, the distance between the cavity and the BPM unit downstream can be obtained by following the same principle as in Sect. 3.3.1. However, this situation is more complex because the TOF within the cavity must be considered.
Based on the calibration setup illustrated in Fig. 1:
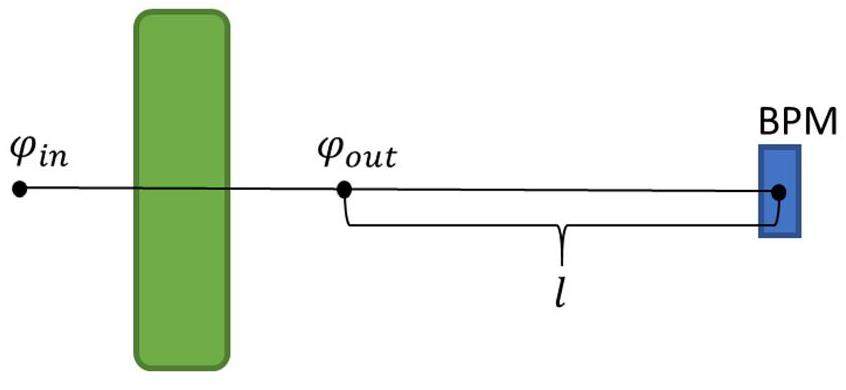
After leaving the electromagnetic field of the cavity, the particles drift uniformly until they reach the BPM, exhibiting a relationship similar to Eq. (6). Therefore, plotting the scatter graph of
Lattice Model
The position calculations in Sect. 3.3.1 and 3.3.3 enable the construction of a lattice model by following the steps illustrated in Fig. 2. Starting with a designated reference BPM, the positions of the downstream BPMs relative to the reference BPM can be determnined. Next, the relative positions of each cavity and its adjacent downstream BPM provide the locations of the respective cavities. Finally, if required, the calibrated BPMs can serve as TOF devices (as discussed at the end of Sect. 3.3.1) to determine the positions of elements upstream of the reference BPM.
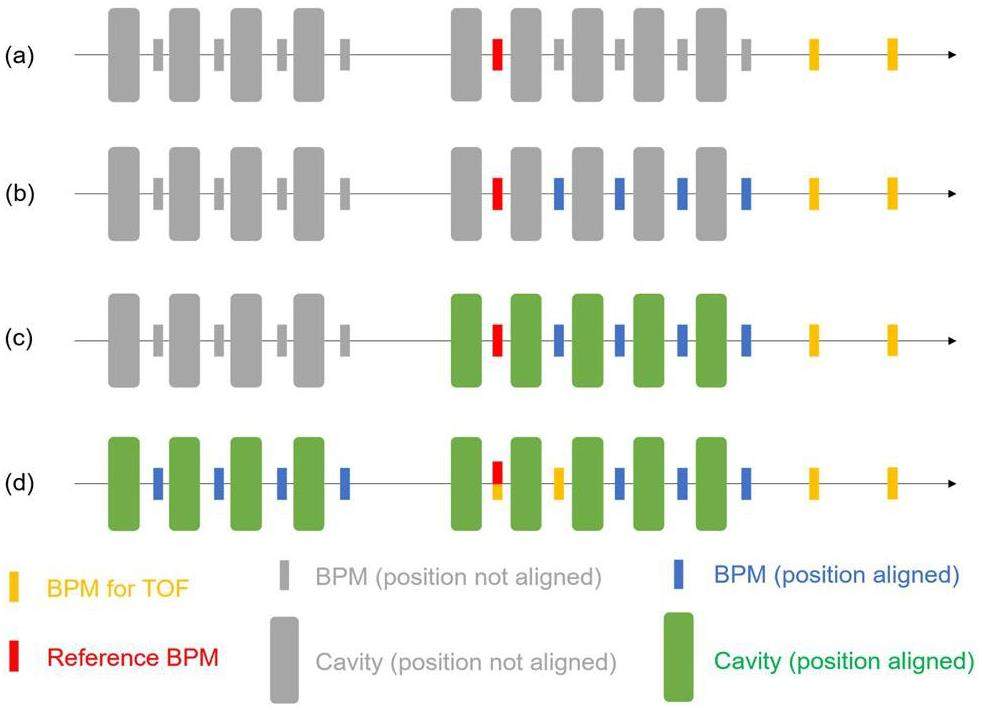
Assuming that calibrated BPMs were not used as TOF devices more than once, the uncertainties of all BPM positions relative to the reference BPM can be given directly by the calculations in Sect. 3.3.1. As each cavity position is obtained from the sum of two quantities, the uncertainties of the cavity positions
Cavity Phase Offsets
Finally, the relative phase offsets of the cavities and BPMs were obtained. In the previous analysis, the entrance phase φin and cavity voltage of each cavity have already been acquired, as well as the relative positions of all the cavities and BPMs. As discussed in Sect. 3.3.4, an accurate lattice model can then be constructed, starting from the entrance of the first cavity, where beam simulations can be conducted to determine the time required to travel from the entrance of the first cavity to those of every cavity and BPM. Although
Reference Point and Automatic Phase-Setting
The TOF experiment and data analysis provided the relative phase offsets and positions of all the cavities and BPMs of the linac. The absolute position of such a section is still unknown and determines the absolute phase offset of each element with the RF reference line.
In hadron linacs, the cavities with phases that must be set are commonly preceded by a radiofrequency quadrupole (RFQ). The beam is bunched out of the RFQ, and its energy does not change during medium-energy beam transport (MEBT), which connects the RFQ to the first cavity. Depending on whether the normally conducting structure upstream can vary its outgoing beam energy, there are two solutions to this problem to implement automatic phase-setting.
Fully Model-Based Phase-Setting
If the incoming energy to the superconducting section can be varied and there are warm BPMs upstream of the linac, measurements can be taken at several energy values, and techniques similar to those used in the calibration experiment can be used to obtain the distances between the warm elements and the first cold BPM. As the absolute positions of normal conducting structures and warm BPMs are known to be highly accurate based on mechanical alignment, this final calibration fixes the absolute position of the entire superconducting section.
The reference location where φRF-ref is considered zero is normally placed at the RFQ exit. With their absolute positions known, the absolute phase offsets of all the cavities and BPMs can be determined by calculating φRF-ref of the first cavity during the TOF experiment and applying Eq. (1). Therefore, given the beam conditions and lattice design, the required cavity phase settings can be obtained directly via fully model-based calculations.
First Cavity Phase Scan
If the accelerating structure directly upstream of the superconducting section is an RFQ, which is an increasingly common layout in modern hadron linacs [34], then adjusting the energy at the RFQ exit in a single-beam experiment may be inconvenient. In this case, automatic phase-setting must be achieved in the absence of an absolute position and phase offset of the first cavity. This can be achieved using a conventional phase scan of the first cavity in each run. With Ein and Eout being measurable from the calibrated BPMs and the known voltage coefficient, it is simple to determine φin of the first cavity from the phase scan. Subsequently, it is possible to place the phase reference point in the first cavity and use the relative phase offsets between the other cavities and the first cavity to complete the automatic phase-setting.
Experimental Verification of CAFe II
CAFe II Accelerator
The China Accelerator Facility for Superheavy Elements (CAFe II), is a superconducting heavy-ion linac located at the Institute of Modern Physics (IMP). In a modification of the CiADS demonstration facility [35], the main mission of CAFe II is the synthesis of superheavy elements. CAFe II can accelerate heavy-ion beams with charge-to-mass ratios from approximately 1/3 to 4-6.5 MeV/u. Designed for continuous-wave (CW) operation, the average particle current of the beam ranges from 1 to 10 uA.
The superconducting section of CAFe II consists of four CMs. Within each CM, there is a BPM between each pair of adjacent cavities. The first three CMs contain six cavities and five BPMs, whereas the last CM contains five cavities and four BPMs. A schematic of CAFe II is shown in Fig. 3; the cavity and BPM names are listed in Table 3. Cavities are named by both the CM to which they belong and their position within it; for example, CM1-3 denotes the third cavity in the first CM.

| Cryomodule | Beta | Cavity | BPM |
|---|---|---|---|
| CM1 | 0.1 | CM1-1~CM1-6 | BPM6-10 |
| CM2 | 0.1 | CM2-1~CM2-6 | BPM 11-15 |
| CM3 | 0.1 | CM3-1~CM3-6 | BPM16-20 |
| CM4 | 0.15 | CM4-1~CM4-5 | BPM21-24 |
TOF Alignment and Calibration Experiment
The TOF alignment and calibration experiment at CAFe II followed the procedure detailed in Sect. 3.2. After the forward phase scan, a 0.3 mA proton beam was accelerated by 22 superconducting cavities from 1.36 MeV at the RFQ exit to 17.78 MeV at the end of the superconducting linac. BPM25 and BPM26 after CM4, at the end of the linac, were used as energy measurement devices. These two BPMs were connected to an oscilloscope instead of an electronic system, which allowed observation of the waveform when the beam passed through them. With errors caused by cable transmission calibrated and corrected in advance, manually aligning the two waveforms of BPM25 and BPM26 provided the absolute TOF of the beam from BPM25 to BPM26.
TOF energy measurements from BPM25 and BPM26 were then used to calibrate the distances between the 19 pairs of BPMs, as well as the distances between each BPM and the preceding cavity. As discussed in Sect. 3.4, because the CAFe II superconducting section is directly downstream of the RFQ, the calibration ultimately provides the relative positions of all the cavities and BPMs, as well as their relative phase offsets.
It is also necessary to discuss the experimental details of BPMs. To perform the data analysis, the frequency of the BPM unit must be known, as shown in Eq. (6). At a frequency of 162.5 MHz, which is the working frequency of CAFe II, the phase readings of BPMs were susceptible to interference from the electromagnetic field in the cavity. To mitigate this interference, the BPM readings were measured at the experimental second harmonic frequency of 325 MHz. To minimize errors owing to beam fluctuations, 50 samples of BPM readings were conducted and the median value was selected. In the case of excessive variance, the dataset was excluded. The findings of the calibration experiment are presented subsequently.
Alignment and Calibration Results
The alignment and calibration results were obtained based on the data analysis scheme described in Sect. 3.3. First, the spacing between the BPMs was calculated. Figure 4a shows a scatter plot of
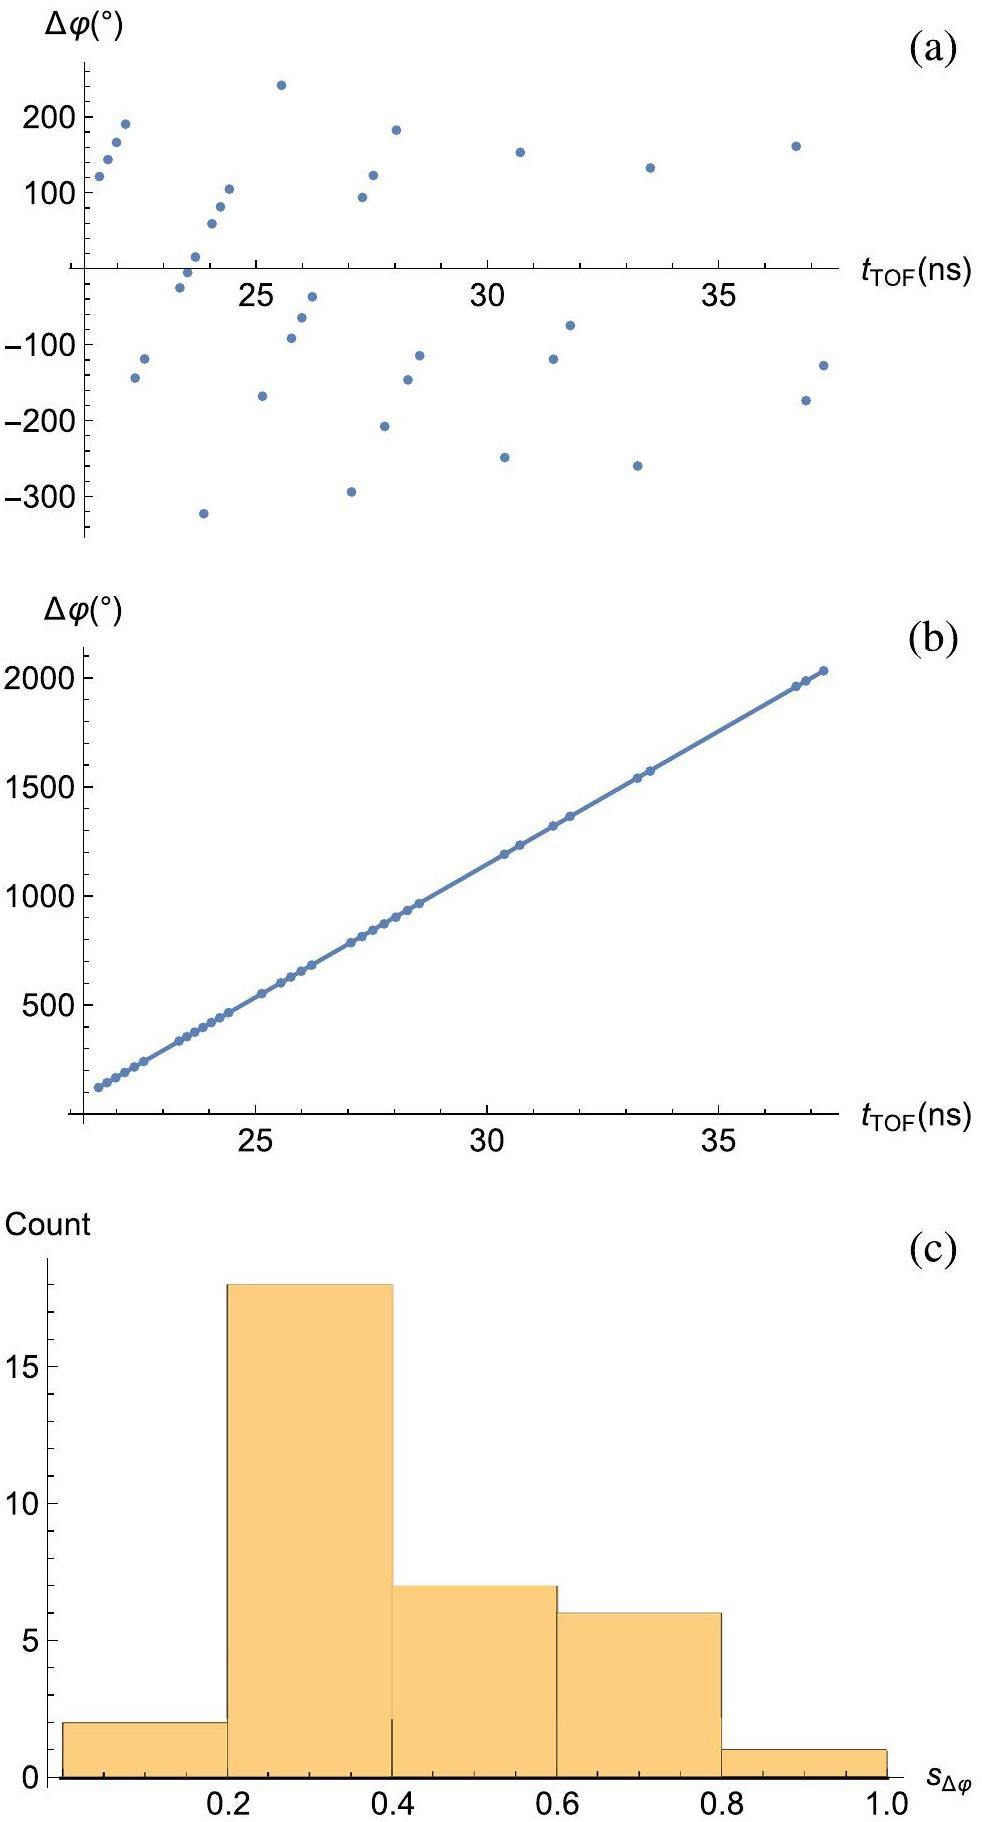
Next, the data in the forward phase scan were analyzed using the relative BPM positions. The electromagnetic field distributions of the HWR010 and HWR019 cavities were obtained using CST Studio software [38], and the particle transmission through the cavity was performed using TraceWin software [39], which provided the beam simulation code. The cavity voltage coefficient and φin in each cavity were determined as in the conventional phase scans.
These results enabled the distance between each cavity and the downstream BPM to be determined. Figure 5 shows a scatter plot of
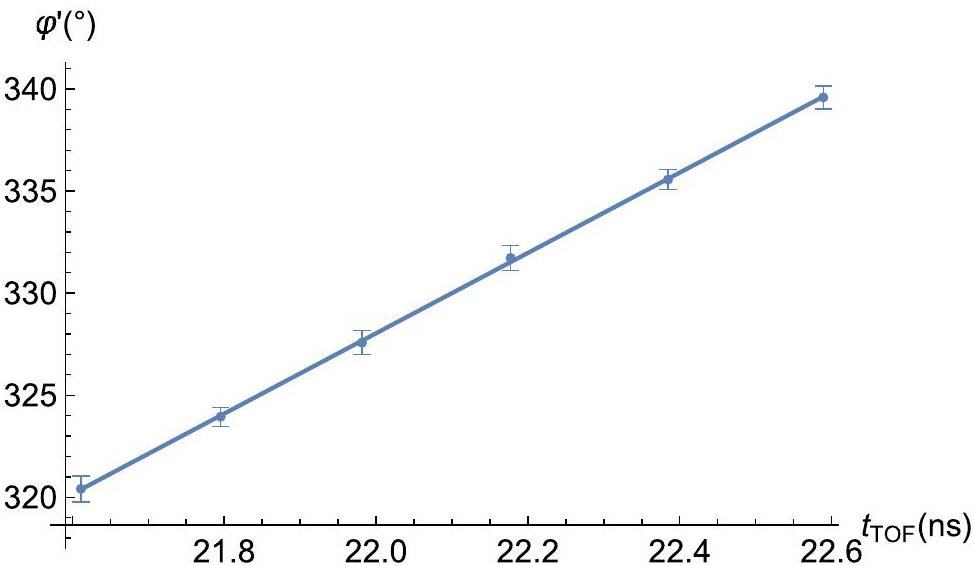
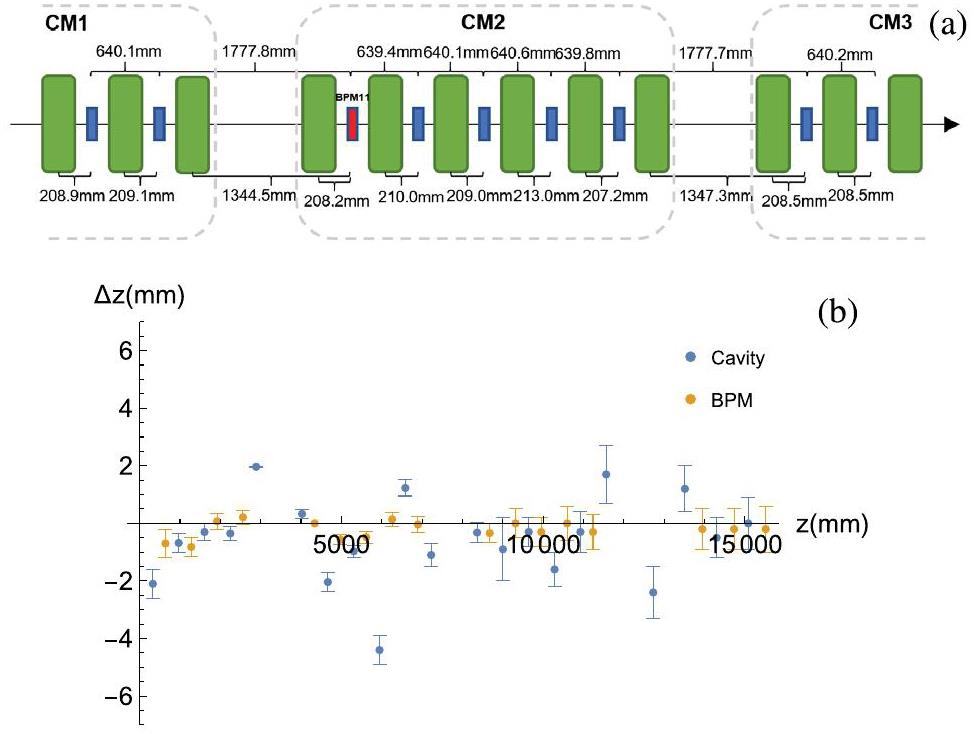
Figure 6 shows the TOF-aligned positions of one section of the CAFe II linac as well as the differences between TOF-aligned positions and their respective values in the original lattice design of CAFe II for all cavities and BPMs. Almost all the differences in position were smaller than the typical displacements within CMs discussed in Sect. 2.2, which shows that TOF alignment results are consistent with the lattice design.
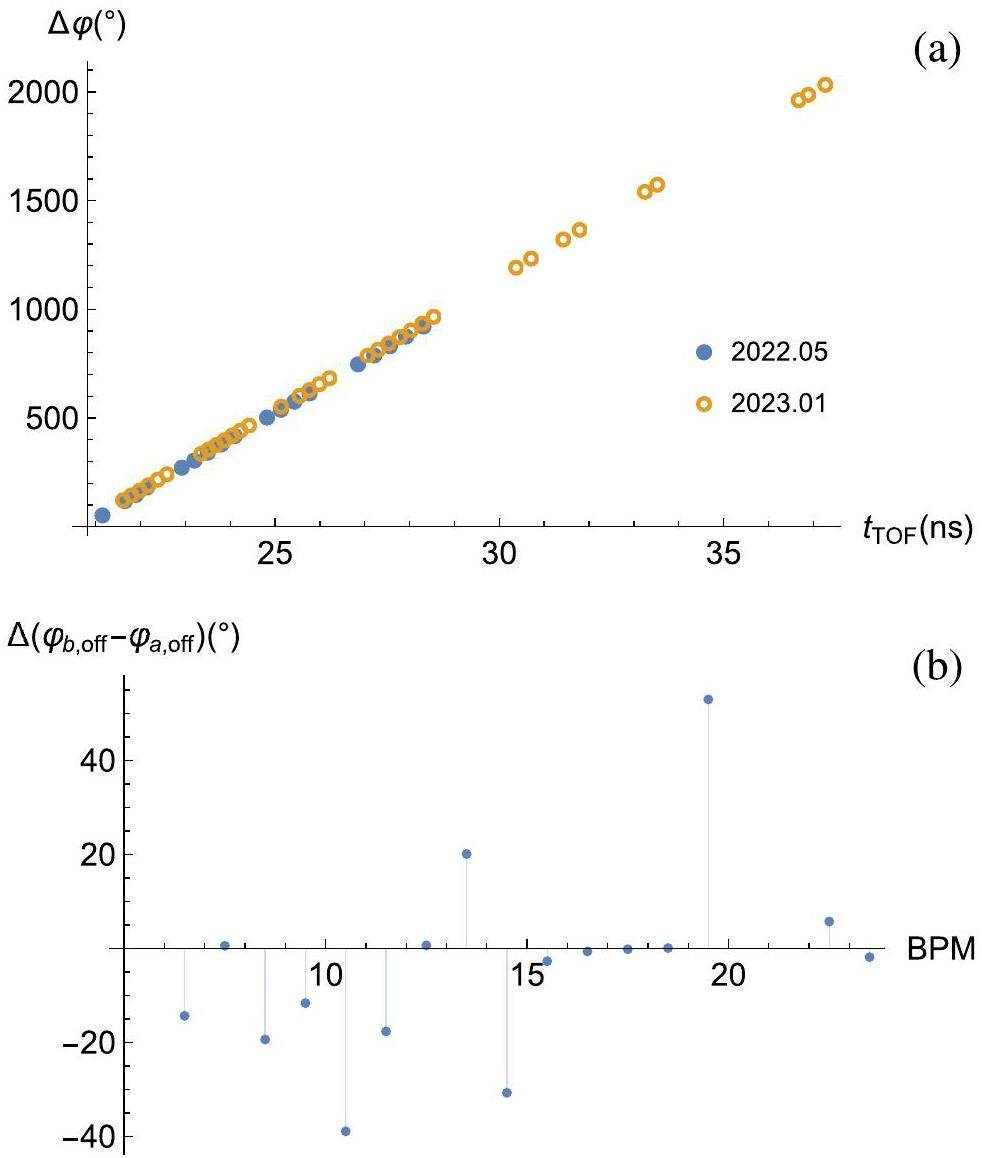
Eight months before this experiment, a TOF experiment that calibrated only BPMs was also conducted. Figure 7 illustrates the differences between the results of the two calibration experiments. While there were modifications in the low-level RF system between 2022.05 and 2023.01, which caused changes in some relative phase offsets, the relative phase offsets between BPMs unaffected by such modifications remained almost unchanged. These results corroborate the proposition that as long as the positions of the cavities and BPMs are fixed and the RF circuit structure remains unchanged, the phase offsets obtained from the calibration experiment remain constant.
Automatic Phase-Setting
To demonstrate automatic phase-setting and verify the calibration results, several new lattice designs were created and the predicted final energies were compared the with TOF energy measurements.
In each lattice design, zcav from the alignment results enabled φRF-ref and φin to be calculated via simulations. These two phases, combined with the phase calibration results φoffset (which were constant as long as the low-level circuits remained unchanged), allowed φset to be calculated using Eq. (1). Similar to the previous data analysis, all simulations were performed using TraceWin. Calculating φset for a CAFe II lattice design required only several minutes, which was a significant time saving compared to that required for the phase scan. Hence, this method can significantly expedite beam tune-up.
Furthermore, any design calculation is expected to have the same level of accuracy, regardless of the beam intensity. However, this is not the case for cavity phase scans, which suffer from larger errors owing to weaker BPM signals when the beam intensity is low. Such errors would pose significant problems for cavity phase scans in the tune-up of heavy-ion beams, which typically have low intensities compared to protons. With automatic phase-setting, low-intensity beams can achieve a highly accurate phase-setting as long as the TOF alignment and phase calibration experiments are performed using a high-intensity beam, which is the case for CAFe II.
To examine the accuracy of the phase calculations, a new set of lattice settings were constructed by introducing random variations in the cavity voltage and synchronous phase based on the original lattice. Owing to a malfunction in BPM21, the new lattice terminated at CM3-6 with a designed exit energy of 9.289 MeV. The operational phase of the cavity was calculated by using a previously described method. Subsequently, the TOF of the beam at the CM3-6 exit was measured as 14.65 ns, corresponding to an energy of 9.285 MeV, which closely matched the design value.
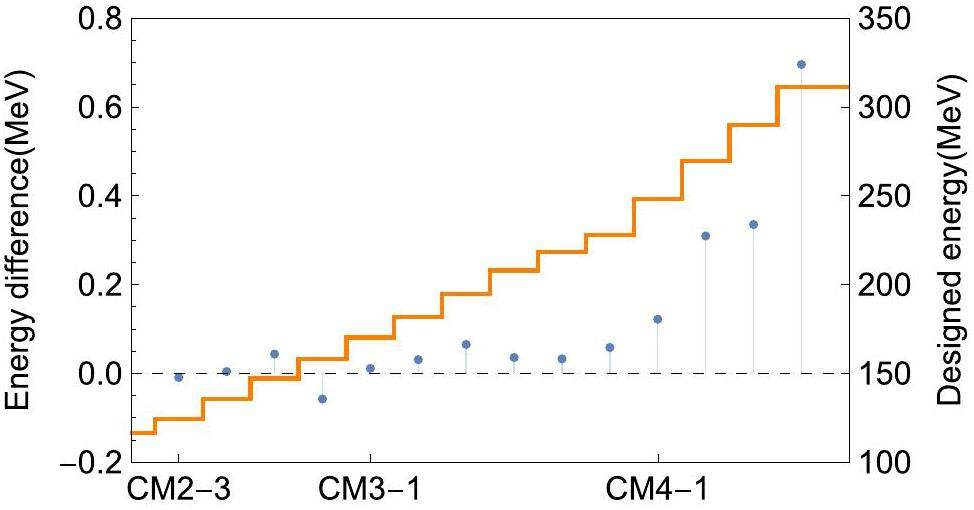
Next, the case in which φRF-ref changes in the first cavity was tested. This occurs when the particle type is changed to a particle other than a proton or when there are changes in the RFQ exit energy or the initial phase of the RFQ. To resolve this issue, a phase scan of CM1-1 was performed and the technique discussed in Sect. 3.4 was applied. Figure 8 shows the results for a beam tune-up using 54Cr17+, where the predicted output energy at each cavity closely agreed with the direct TOF energy measurements. These results confirmed the accuracy of the calibration results and validated the effectiveness of the automatic phase-setting.
Conclusion
This study proposed a method that employs systematic TOF experiments to calibrate both the positions and phase offsets of cavities and BPMs in a superconducting hadron linac. The method was verified on CAFe II, where the calibration results were utilized to achieve a rapid automatic phase-setting, and the predicted final beam energies matched the direct energy measurements. Its success with CAFe II proves that TOF alignment can resolve the problem of element position shifts within CMs during cool-down, thereby providing a beam-based alternative solution to the more expensive setup of CMs with online alignment capabilities.
After the position and phase calibration were conducted on CAFe II, the automatic phase-setting replaced the phase scan as the default procedure for beam tune-up, and generally accomplished cavity phase and voltage settings within 10 min. This achievement facilitated beam operation at CAFe II with various particle types, including 54Cr17+, 54Cr18+, 40Ar12+, H+, and 48Ca14+. The calibration results remained effective over months of operation and it is expected that they will continue to hold as long as the cavity positions and circuit structures remain unchanged.
Future research should incorporate the acceleration effects of transverse beam offsets into model calculations to improve the accuracy of the calibration data analysis and automatic phase setting. The optimal application of position and phase calibration via TOF in long hadron linacs should also be investigated, including the upcoming commissioning of the linac sections of CiADS [40] and HIAF [41], which are two ongoing large-scale accelerator projects under the auspices of the IMP. While the calibration principle remains the same as that in short linacs, such as CAFe II, long linacs may require multiple installations of absolute TOF measurement devices so that the linac can be calibrated in several separate sections. Understanding the effectiveness of different arrangements will aid linac tune-up at CiADS and HIAF and expand the applicability of TOF alignment and calibration in hadron linacs.
The PIP-II Reference Design Report. Tech. rep., FERMILAB-DESIGN-2015-01; 1607162; TRN: US1701926
. https://doi.org/10.2172/1365571Accelerator commissioning and rare isotope identification at the facility for rare isotope beams
. Mod. Phys. Let. A 37,The triumf-isac facility: two decades of discovery with rare isotope beams
. Physica Scripta 91,The SNS superconducting linac system
. Vol. 1, 2001, pp. 619–623 vol.1. https://doi.org/10.1109/PAC.2001.987585The ISIS spallation neutron and muon source-the first thirty-three years
. Nucl. Instrum. Meth. A 917, 61-67 (2019). https://doi.org/10.1016/j.nima.2018.11.129Introduction to J-PARC
. Prog. Theor. Exp. Phys. 2012, 2B001-0 (2012). https://doi.org/10.1093/ptep/pts025Back-n white neutron source at CSNS and its applications
. Nucl. Sci. Tech. 32, 11 (2021). https://doi.org/10.1007/s41365-021-00846-6IPAC 2014, The ess linac
. 2014. https://doi.org/10.18429/JACoW-IPAC2014-THPME043High frequency linacs for hadrontherapy
. Rev. Accel. Sci. Tech. 02, 111-131 (2009). https://doi.org/10.1142/S179362680900020XProton linac-based therapy facility for ultra-high dose rate (FLASH) treatment
. Nucl. Sci. Tech. 32, 34 (2021). https://doi.org/10.1007/s41365-021-00872-4Beam commissioning for a superconducting proton linac
. Phys. Rev. Accel. Beams 19,Slides, Development of accelerator driven advanced nuclear energy (ADANES) and nuclear fuel recycle
. 2019. https://doi.org/10.18429/JACoW-IPAC2019-TUYPLS2Design study on medium beta superconducting half-wave resonator at IMP
. Nucl. Sci. Tech. 27, 80 (2016). https://doi.org/10.1007/s41365-016-0081-yProceedings of International Conference on Particle Accelerators, Phase scan signature matching for linac tuning
. 1993, pp. 1691–1693 vol.3. https://doi.org/10.1109/PAC.1993.309100Longitudinal transit time factors of short independently phased accelerating structures for low velocity ions
. Nucl. Instrum. Meth. A 258, 15-25 (1987). https://doi.org/10.1016/0168-9002(87)90076-3Superconducting linear accelerators for heavy ions
. Annu. Rev. Nucl. Part. S. 36, 475-503 (1986). https://doi.org/10.1146/annurev.ns.36.120186.002355Fully Automated Tuning and Recover of a High Power SCL. No. 31 in International Linear Accelerator Conference
, (Instant Phase Setting in a Large Superconducting Linac. No. 5 in International Particle Accelerator Conference
, (First Tests of Model-Based Linac Phasing in ISAC-II. No. 15 in International Conference on Heavy Ion Accelerator Technology
, (Dynamic compensation of an rf cavity failure in a superconducting linac
. Phys. Rev. ST Accel. Beams 11,A new method for compensation and rematch of cavity failure in the C-ADS linac
. Chin. Phys. C 40,Alignment of beam position monitors in cryomodule of CADS injector II
. Nucl. Sci. Tech. 28, 75 (2017). https://doi.org/10.1007/s41365-017-0232-9Bayesian optimization algorithms for accelerator physics
. Phys. Rev. Accel. Beams 27,Time-drift aware rf optimization with machine learning techniques. No. 14 in IPAC’23 - 14th International Particle Accelerator Conference
, (Beam position monitoring
. AIP Conference Proceedings 212, 26-58 (1990). arXiv:https://pubs.aip.org/aip/acp/article-pdf/212/1/26/11956268/26_1_online.pdf, https://doi.org/10.1063/1.39710Physics design of an accelerator for an accelerator-driven subcritical system
. Phys. Rev. ST Accel. Beams 16,2012, Design of the frib cryomodule
. (2014, 4 k alignment of superconducting quarter-wave cavities and 9 t solenoids in the atlas intensity upgrade cryomodule
. (Error tolerance studies for the superconducting linac of raon
. J. Korean Phys. Soc. 67, 1358-1363 (2015). https://doi.org/10.3938/jkps.67.1358PASTA: An RF phase and amplitude scan and tuning application
.Benchmark of Superconducting Cavity Models at SNS Linac. No. 12 in International Particle Accelerator Conference
, (Time-of-Flight Calculations with Multiple Beam Phase Monitors: Calibration, Jitter Analysis & Energy Measurement. Tech. rep., ORNL/TM-2022/2395
(2022). https://doi.org/10.2172/1864413Laser-assisted charge exchange as an atomic yardstick for proton beam energy measurement and phase probe calibration
. Phys. Rev. Accel. Beams 24,Physics design of the ciads 25mev demo facility
. Nucl. Instrum. Meth. A 843, 11-17 (2017). https://doi.org/10.1016/j.nima.2016.10.055Capacitive beam position monitors for the low- beam of the Chinese ADS proton linac
. Chin. Phys. C 40,Libera Single Pass H, User Manual
. (2013) www.i-tech.siDassault Systèmes, CST Studio Suite
. https://www.3ds.com/products-services/simulia/products/cst-studio-suite/Status of TraceWin Code. No. 6 in International Particle Accelerator Conference
, (Beam physics design of a superconducting linac
. Phys. Rev. Accel. Beams 27,Status of the high-intensity heavy-ion accelerator facility in China
. AAPPS Bulletin 32, 35 (2022). https://doi.org/10.1007/s43673-022-00064-1This assumes that the voltage coefficient is one. From Table 2, the voltage coefficient is typically close to one, therefore deviations of the true voltage from the design voltage should be acceptable for the purposes of accelerating the beam through the linac.
The maximum bunch length required by TOF energy measurements varies with experimental conditions, such as the beam current and beam energy. As an example, in the experiment described in Sec. 4.2, the RMS bunch length should not exceed 50°.


