Introduction
Studies have shown that the optical and dosimetric properties of oxide matrix materials doped with rare-earth ions can be improved [1-5]. Double perovskites have attracted considerable attention among oxide matrix materials because of their excellent chemical structure and good stability [6]. AA1BB1O6-type double perovskites can be obtained by partially substituting A or B sites of ABO3-type simple perovskites with different A1 or B1 ions. The structure and luminescence properties of double perovskites, a new type of matrix material, have been extensively studied. For example, La2MgTiO6 [7], Gd2ZnTiO6 [8], La2MTiO6 (M=Co,Ni) [9] have good thermal stability and superior luminescence properties, which can be used as candidate materials in the field of lighting. However, their thermoluminescent properties have rarely been studied. Y2MgTiO6 matrix materials have become a research hotspot in recent years, owing to their physicochemical stability, easy preparation, and wide availability as raw materials [10].
Thermoluminescent materials contain a certain concentration of luminescent centers and traps. Under high-energy radiation excitation, free electrons and holes are generated in the crystal, some captured by traps. When a crystal is heated, the captured electrons (or holes) are thermally excited to become quasi-free carriers, and thermoluminescence is produced when the quasi-free carriers recombine with the luminescent centers [11, 12]. Analysis of the thermoluminescence glow curve can be used to estimate the types and activation energies of the traps [13-16]. Most current studies use the Computerized Glow Curve Deconvolution (CGCD) method for analysis. If the internal information of the system is unknown, the method lacks physical meaning. If the luminescence characteristics of thermoluminescent materials are further elucidated, the results can be more accurate and reliable. Many thermoluminescent materials have good dose response linearity, easy fabrication, and low cost [17-19], and can be used for ionizing radiation dose detection. For example, LiF:Mg,Cu,P [20], Li2B4O7:Mn [21] can be used for personal dose detection; BeO [22], CaSO4:Dy [23], CaF2:Dy [24]can be used for environmental dose detection; Al2O3:C [25], MgB4O7:Dy [26] can be applied to medical dose detection. In addition to the standard thermoluminescence dosimeters, there are other materials that may be used for dose detection, such as SrGd2O4:Sm, SrDy2O4:Eu,BaSi2O5:Dy, (Sr,Ba)AlO4:Eu/Dy, CaWO4:Pr, LaGa4O(BO3)3 and (Ba,Sr)TiO3:Pr[27-32]. Generally, the sensitivity of thermoluminescence dosimeters is high; however, the linear upper limit of the dose response is generally low (approximately 200 Gy). On special occasions (such as during irradiation preservation), it is often necessary to accurately measure the irradiation dose at the kGy level[33, 34]. Therefore, studying thermoluminescent materials with stable performance and a wide linear dose-response range can broaden the applications of thermoluminescence technology.
A Sm3+ single-doped Y2MgTiO6 phosphor was prepared using a high-temperature solid-state method, and its X-ray diffraction (XRD), photoluminescence (PL), and thermoluminescence (TL) were measured. The thermoluminescence mechanism of the sample exhibiting the highest TL yield, along with its potential for use as a thermoluminescent dosimeter and high-dose detection, was investigated using three-dimensional thermoluminescence spectroscopy(3D-TL), Tm-Tstop analysis, CGCD method and dose-response.
Experiment
Sample preparation
Y2-xSmxMgTiO6 (x=0, 0.001, 0.002, 0.005, 0.01, 0.02, 0.05, 0.1 and 0.2) phosphors were synthesized using a high-temperature solid-state method. Stoichiometric amounts of Y2O3 (99.99%), MgO (99.99%),TiO2 (99.99%), Sm2O3 (99.99%) were weighed and placed in an agate mortar for 0.5 h until a homogenous mixture was achieved. This uniformly ground powder was placed in a corundum crucible in a muffle furnace and pre-sintered in the air at 800 ℃ for 3 h. Subsequently, the temperature was rapidly increased to 1300 ℃ at a faster heating rate (7 ℃ s-1), and the samples were calcined at 1300 ℃ for 9 h. The resulting block-shaped sintered products were then crushed and ground again using an agate mortar to obtain the final phosphor powder.
Testing method
X-ray diffraction (XRD) patterns were recorded using a Rigaku Ultima IV X-ray diffractometer with a Cu-Kα radiation source, a scanning range of 10° to 80°, and a scanning rate of 5°/min. Photoluminescence (PL) spectra were measured using a HITACHI F-7000 fluorescence spectrometer with a Xe lamp excitation source and a spectral resolution of 0.2 nm. Thermoluminescence (TL) measurements were performed using a Risø TL/OSL-15-B/C thermoluminescence/optically stimulated luminescence measurement instrument equipped with a 90Srβ radiation source (1,4 GBq activity, 0.1 Gy/s dose rate). The distance between 90Srβ radiation source and the sample was 5 mm, the distance between the detector and the sample was 55 mm, and the heating rate was 5 K/s during measurement. The three-dimensional thermoluminescence spectroscopy of the samples was measured using an LTTL3DS thermoluminescence spectrometer (Guangzhou Ruidi Technology Co., Ltd.). The irradiation source was an X-ray tube, the working voltage of the X-ray tube was 50 kV, the current was 150 μA, the dose rate was about 0.1 Gy/s, the heating rate was 5 K/s during measurement, the heating range was 300–750 K, the spectral range was 300–1000 nm, and the spectral resolution was 1 nm.
Results and discussion
XRD analysis
The XRD patterns of Y2-xSmxMgTiO6 (x=0, 0.005, 0.01, 0.02, 0.05 and 0.1) series samples are shown in Fig. 1. No information on Y2MgTiO6 is available in the inorganic crystal information database. Shannon [35] used the Rietveld method to analyze data, and the results proved that Dy2MgTiO6 and Y2MgTiO6 have very similar structures. Therefore, the standard Dy2MgTiO6 (ICDD 04-021-1637) card was used as a reference. As shown in the figure, the number and positions of the diffraction peaks for all samples are consistent with the standard card. The diffraction angle at 33°, corresponding to the characteristic site of Y3+ shifts to a small angle [36, 37]. According to Bragg's equation [38, 39], this decrease in diffraction angle indicates an increase in lattice spacing. Given the ionic radii of rY3+=0.1019 nm, rMg2+ =0.0720 nm, rTi4+=0.0605 nm [40], and the ionic radius of Sm3+ is rSm3+=0.1132 nm. The shift in the diffraction angle of the characteristic site of Y3+ to a small angle confirms the successful substitution of Y3+ by the larger Sm3+ ions within the lattice. This substitution does not alter the overall lattice structure or charge configuration, and the samples retain the monoclinic P21/n [37].
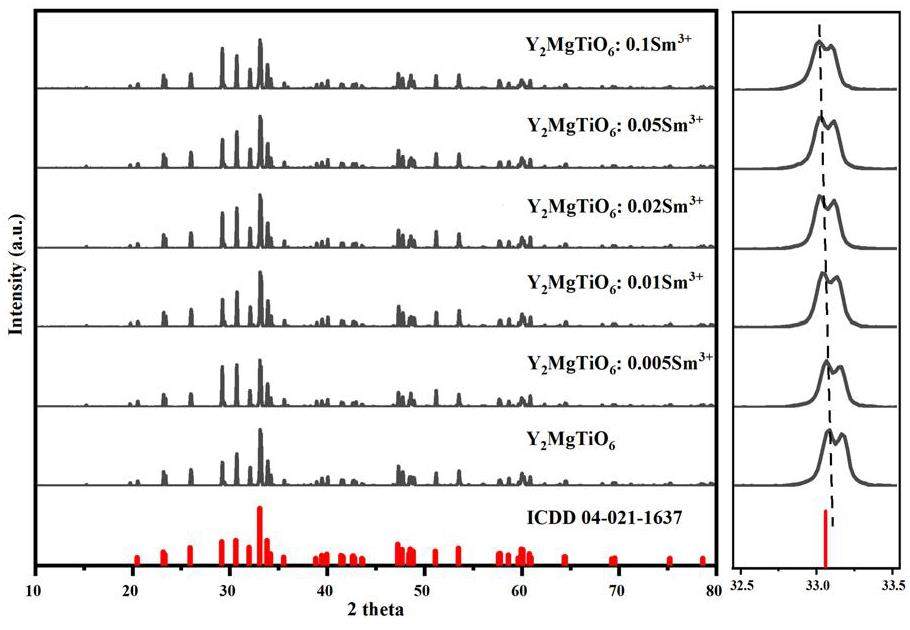
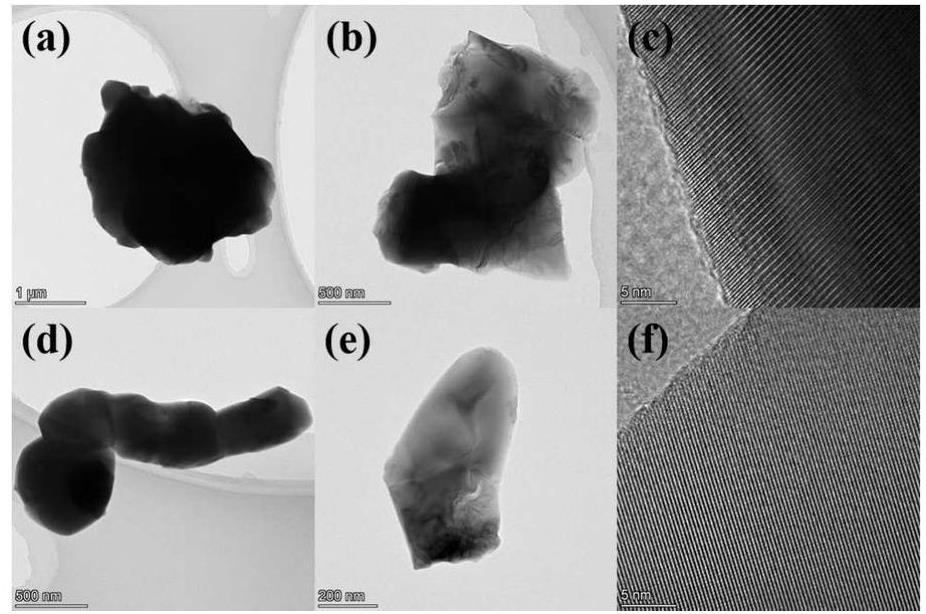
Figure 2 shows the morphology and lattice fringes of Y2MgTiO6 matrix and Y2MgTiO6:Sm. The figure reveals that the phosphor particles have irregular morphologies, with sizes ranging from approximately 400 nm to 2 μm. After Sm doping, the lattice fringes become denser, indicating decreased crystal plane spacing. This observation further supports the successful incorporation of the larger Sm ions into the matrix lattice. Combined with the XRD results, this confirms the successful synthesis of the phosphor under the described experimental conditions.
Photoluminescence analysis
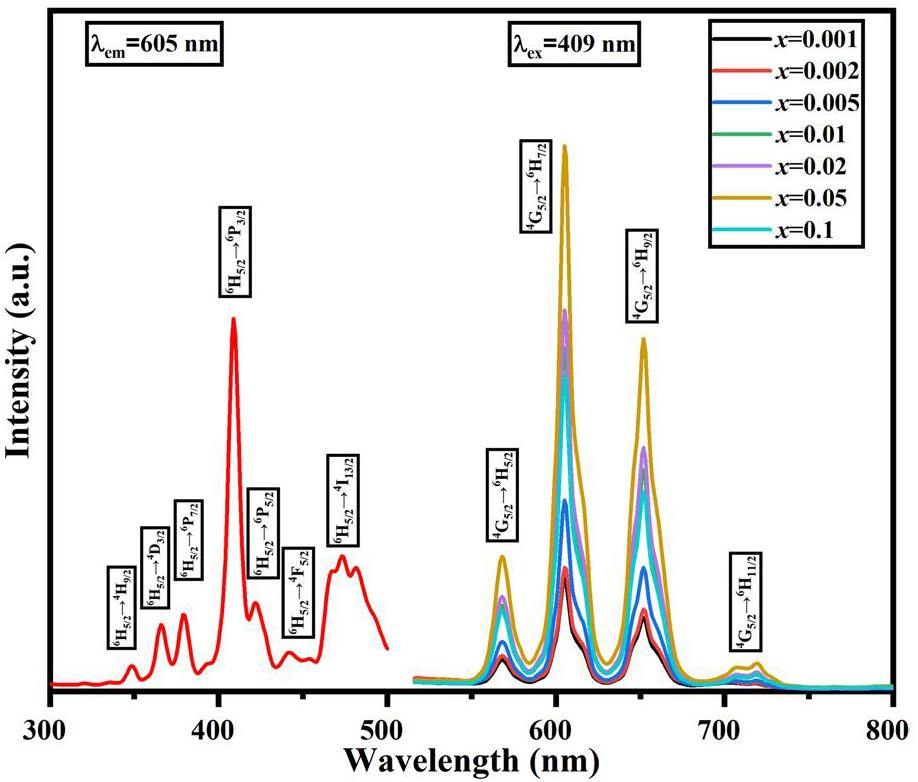
Figure 3 shows the PL of Y2-xSmxMgTiO6 (x=0.001, 0.002, 0.005, 0.01, 0.02, 0.05 and 0.1) series phosphors. With a monitoring wavelength of 605 nm, the excitation spectrum spanned from 340 to 500 nm. The strongest absorption peak is at 409 nm, which belongs to the characteristic transition of Sm3+ 6H5/2→6P3/2. The absorption peaks at 349 nm, 366 nm, 379 nm, 422 nm, 443 nm, and 474 nm correspond to the characteristic transitions of Sm3+ 6H5/2→4H9/2, 4D3/2, 6P7/2, 6P5/2, 4F5/2, 4I13/2, respectively[41]. When excited by 409 nm purple light, four prominent emission peaks are observed at 568 nm, 605 nm, 652 nm and 715 nm, corresponding to the characteristic transitions of Sm3+ 4G5/2→6H5/2, 6H7/2, 6H9/2, 6H11/2, respectively[42, 43]. With increasing Sm3+ doping concentration, the positions and shapes of the emission peaks remained unchanged, while the intensity initially increased and subsequently decreased. The optimal doping concentration was found to be x=0.05, where the photoluminescence emission intensity reached a maximum. Further increases in the Sm3+ doping concentration significantly decreased emission intensity, indicating concentration quenching.
Doping concentration optimization
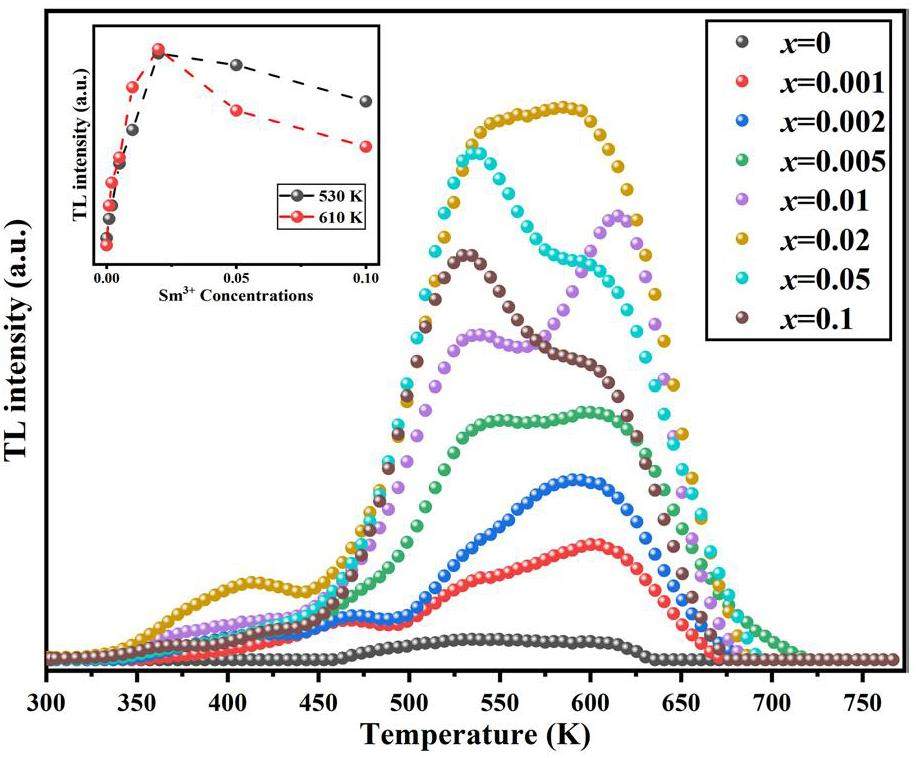
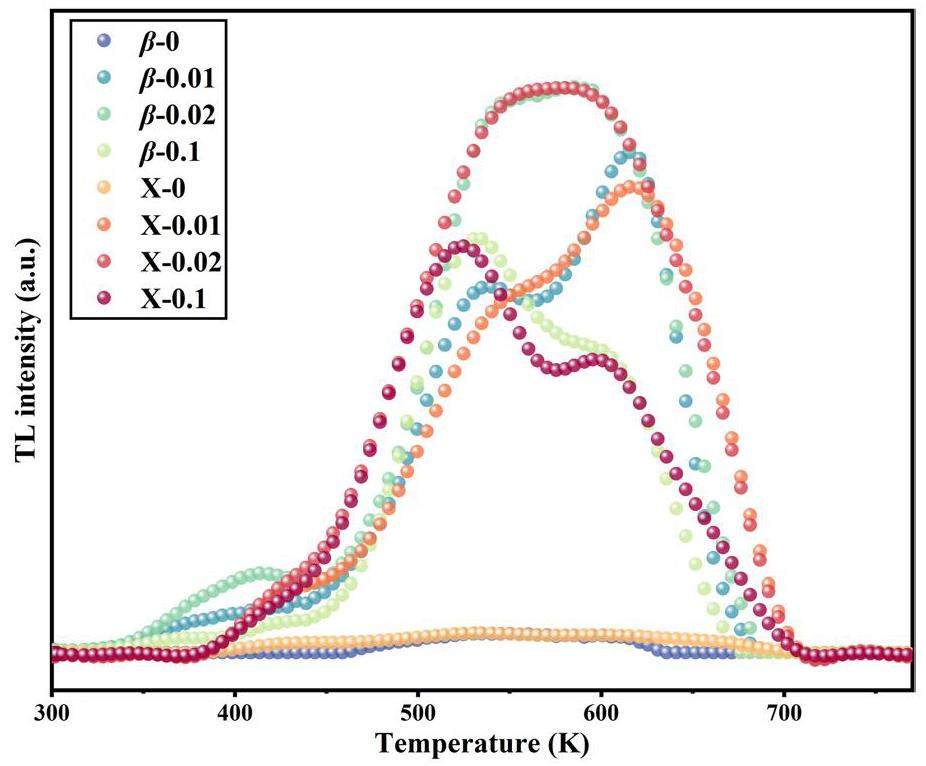
The thermoluminescence response was optimized by varying the doping concentration of Sm3+ to determine the phosphor with the best TL yield. Samples with different doping concentrations (30 mg each) underwent TL testing using the following procedure: (1) preheating to 773 K for 10 s; (2) cooling to room temperature; (3) irradiation with a 90Srβ radiation source at a dose of 100 Gy; 4) TL measurement at a heating rate of 5 K/s. The measurement results are presented in Fig. 4. As can be seen from the figure, with an increase in the Sm3+ doping concentration, the integrated TL intensity also increased, reaching a maximum at x=0.02, which was then selected for subsequent experiments. Further increases inSm3+ concentration led to concentration quenching and decreased integrated thermoluminescence intensity. It can be seen from the figure that the Y2MgTiO6 matrix has a weak thermoluminescence peak, and the thermoluminescence range is between 460 K and 630 K. After introducing Sm3+, the thermoluminescence peak of the phosphor extended to the high-temperature zone. There was evident thermoluminescence at 675 K. In addition, the shape of the thermoluminescence curve changes with the Sm3+ doping concentration. As shown in the inset of Fig. 3, when the Sm3+ doping concentration was x<0.02, the thermoluminescence peak around 610 K was more intense than the peak at approximately 530 K. Conversely, for Sm3+ doping concentrations x>0.02, the thermoluminescence peak at approximately 530 K exhibited a higher intensity than the peak at approximately 610 K. At a Sm3+ doping concentration of x=0.02, a balanced state is observed between the intensities of the two prominent TL peaks. However, when concentration quenching occurs at higher doping levels, the peak intensity at approximately 610 K decreases more rapidly than at approximately 530 K.
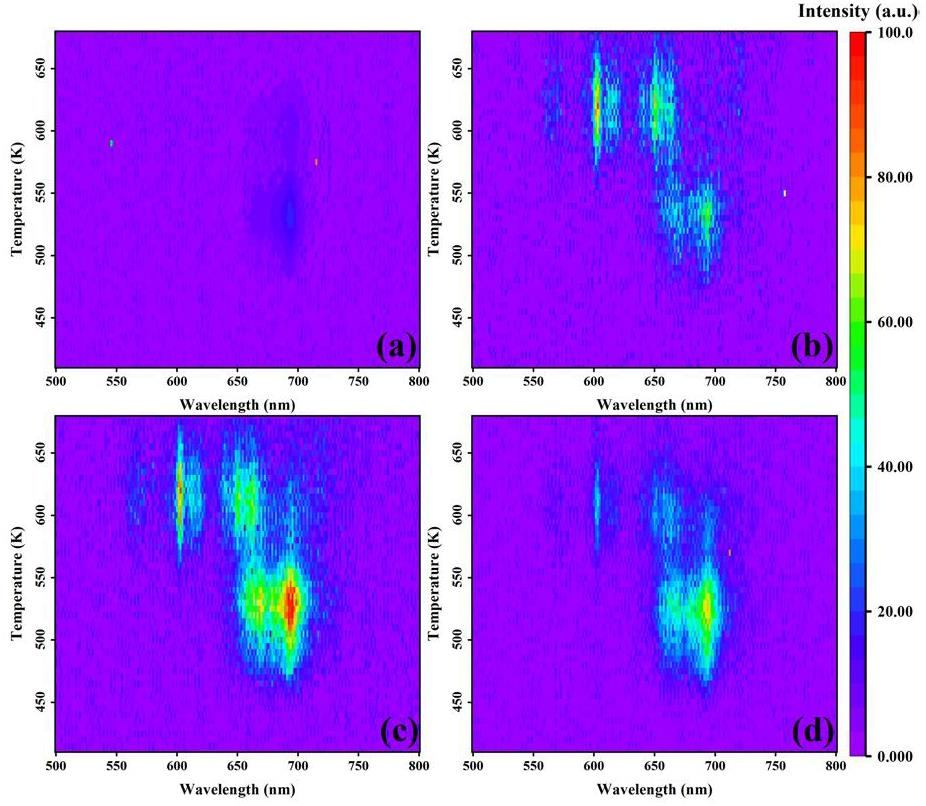
To elucidate the underlying mechanisms responsible for the observed thermoluminescence behavior of Y2-xSmxMgTiO6 series phosphors, three-dimensional thermoluminescence (3D-TL) spectra were acquired for four representative samples irradiated with 100 Gy of X-rays, as shown in Fig. 5. Figure 5a shows that the thermoluminescence range of Y2MgTiO6 matrix is between 480 K and 640 K, with peak temperatures at approximately 530 K and 600 K, consistent with the TL glow curve shown in Fig. 4. The characteristic emission band for Y2MgTiO6 matrix is centered at 698 nm. Figure 5b presents the three-dimensional thermoluminescence spectrum of the sample doped with 0.01 Sm3+. The introduction of Sm3+ enhances the thermoluminescence intensity of Y2MgTiO6 matrix without altering the peak temperature or emission band position of the matrix thermoluminescence. A new thermoluminescence peak appears around 610 K, with emission bands around 570 nm, 600 nm, and 650 nm, consistent with the characteristic, the emission band is around 570 nm, 600 nm, 650 nm, which is consistent with the characteristic Sm3+ emissions obtained in PL. This confirms that this TL peak originates from Sm3+. The Sm3+ -related TL intensity is significantly higher than that of the matrix, meaning that the peak intensity around 610 K is larger than that of 530 K, consistent with the curve in Fig. 4. The three-dimensional thermoluminescence spectrum for the Sm3+ doping concentration of x=0.02 is shown in Fig. 5c. As the Sm3+ doping concentration increases, the thermoluminescence intensity intensity of both Sm3+ and the matrix is enhanced. At this concentration x=0.02, the thermoluminescence peak intensity of Sm3+ (610 K) is comparable to that of the matrix (530 K), achieving a balanced state. Further increases inSm3+ concentration result in a significant decrease in the Sm3+ -related thermoluminescence intensity, while the matrix thermoluminescence intensity also decreases, but to a lesser extent. This indicates that the Sm3+ thermoluminescence emission is strongly affected by concentration quenching, while the matrix TL is less affected. This explains why the 530 K thermoluminescence peak becomes more intense than the 610 K peak at higher Sm3+ concentrations Th
To determine the energy dependence of the thermoluminescence under X-ray and β -particles irradiation, the thermoluminescence spectra of four samples under X-ray irradiation were measured using the Risø instrument and compared with the thermoluminescence spectra obtained under β -particles irradiation. The results are presented in Fig. 6. The thermoluminescence spectra under both X-ray and β -particle irradiation are broadly similar, with only minor differences observed in the low-temperature region.
Tm-Tstop method
To confirm the number of overlapping peaks and their respective peak temperatures in the thermoluminescence (TL) spectrum of Y1.98Sm0.02MgTiO6, fitting was performed using the CGCD method, and the thermal luminescence mechanism and kinetic parameters of the sample were further explored. Peak-separation experiments were performed using Tm-Tstop. The test steps for the Tm-Tstop method are as follows.
1. The samples were preheated to 773 K and held for 10 s.
2. The samples were then cooled to room temperature.
3. The samples were irradiated using a 90Srβ radiation source at a dose of 100 Gy.
4. The samples were then heated to a sufficiently high temperature (Tstop), to clear the TL signal prior to the Tstop temperature value.
5. The samples were rapidly cooled to room temperature.
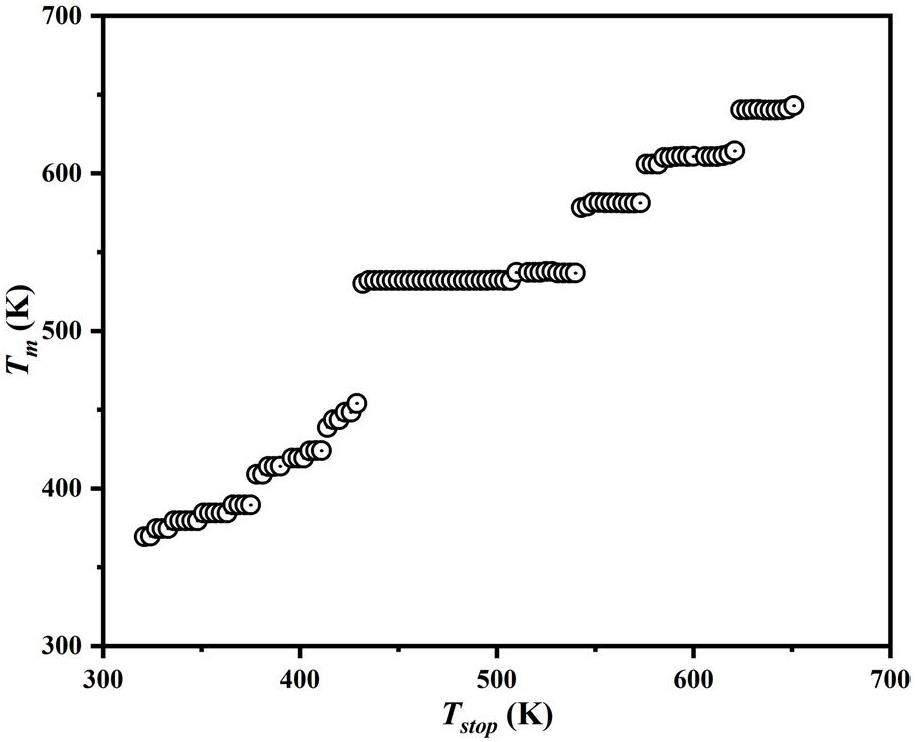
6. The samples were then reheated at the same heating rate (5 K/s), recording the remaining TL curve and noting the position of the first maximum, Tm, on the TL curve was recorded. This process was repeated with successively lower Tstop values (decreasing by approximately 3 K each time). Figure 7 shows the relationship between Tm and Tstop, revealing seven plateaus, each corresponding to a distinct TL peak. The Tm values for these overlapping peaks were determined to be 384, 419, 449, 532, 581, 610, and 640 K. Within the temperature range up to 449 K, the peak temperatures of the three lowest-temperature peaks varied with Tstop, indicating a significant trap recapture process characteristic of second-order kinetics. Above 532 K, the peak temperatures of the remaining four peaks remained relatively constant with changing Tstop, suggesting that trap recapture is negligible and consistent with first-order kinetics.
Computerized glow curve deconvolution (CGCD)
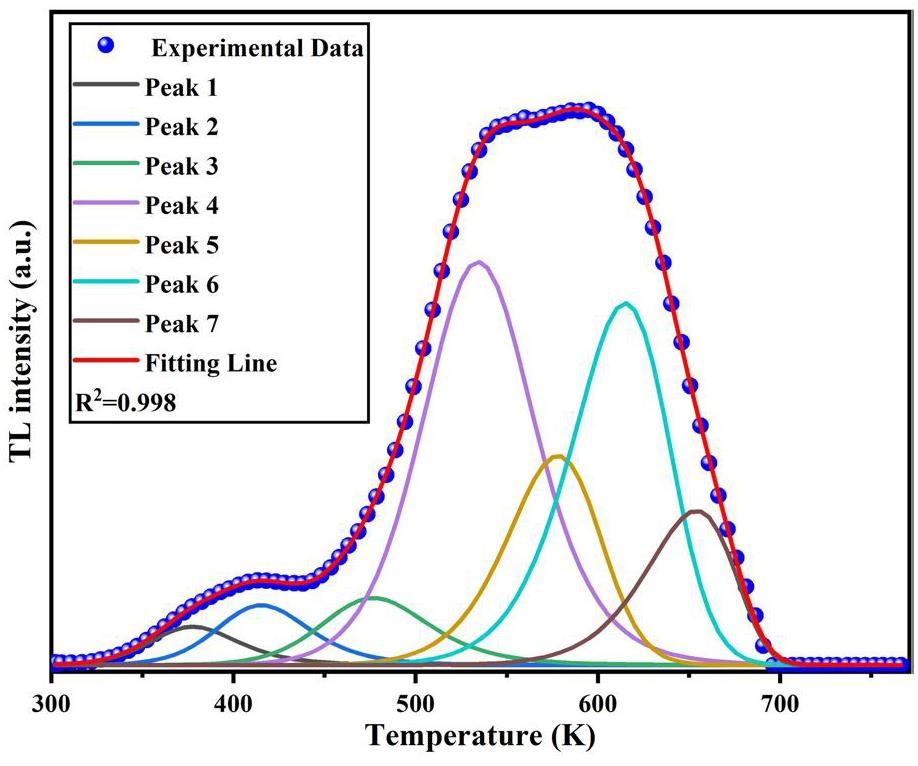
Computerized glow curve deconvolution (CGCD) is a widely used technique for analyzing complex TL mechanisms. It allows for determining the position, shape, and kinetic parameters of overlapping peaks within a TL glow curve[44]. In this study, CGCD, in conjunction with the results obtained from three-dimensional thermoluminescence spectroscopy and the Tm-Tstop method, was used to fit the TL glow curve of the Y1.98Sm0.02MgTiO6 sample irradiated with 100 Gy from a 90Srβ radiation source. Each overlapping peak can be described by Eq. 1 [45]:
| peaks | E(eV) | Tm(K) | b | s(s-1) | τ(s) |
|---|---|---|---|---|---|
| 1 | 0.69 | 378 | 2.0 | 3.95×10⁸ | 9.8×10² |
| 2 | 0.81 | 415 | 2.0 | 1.52×10⁹ | 2.6×10⁴ |
| 3 | 0.91 | 477 | 2.0 | 9.52×10⁸ | 2.0×10⁶ |
| 4 | 1.03 | 534 | 1.6 | 9.96×10⁸ | 2.0×10⁸ |
| 5 | 1.22 | 578 | 1.2 | 9.29×10⁹ | 3.3×10¹⁰ |
| 6 | 1.29 | 615 | 1.2 | 7.04×10⁹ | 6.5×10¹¹ |
| 7 | 1.49 | 654 | 1.0 | 5.93×10¹⁰ | 1.8×10¹⁴ |
Dose response
The TL dose response test of Y1.98Sm0.02MgTiO6 phosphor was investigated using the following procedure: (1) preheating the sample to 773 K for 10 s; (2) cooling to room temperature; (3) irradiating with 90Sr radiation source at a dose of 2 Gy; and (4) measuring the TL emission (heating rate: 5 K/s). These steps were repeated, varying the irradiation dose to 5 Gy, 10 Gy, 20 Gy, 50 Gy, 60 Gy, 70 Gy, 80 Gy, 90 Gy, 100 Gy, 110 Gy, 120 Gy, 150 Gy, 200 Gy, 300 Gy, 400 Gy, 500 Gy, 700 Gy, 800 Gy, 900 Gy, 1000 Gy, 2000 Gy, 5000 Gy, 10,000 Gy, 20,000 Gy and 25,000 Gy. The resulting TK grow curves were recorded and are shown in Fig. 9. It can be seen that as the irradiation dose increased, the shape of the TL curve of the sample exhibited apparent changes. When the irradiation dose is less than 90 Gy, the peak value around 530 K is stronger, and the irradiation dose is more than 90 Gy, the peak value around 610 K is stronger, which indicates that the characteristic thermoluminescence of Sm3+in Y1.98Sm0.02MgTiO6 exhibits significantly higher sensitivity to radiation dose than the Y2MgTiO6 matrix.
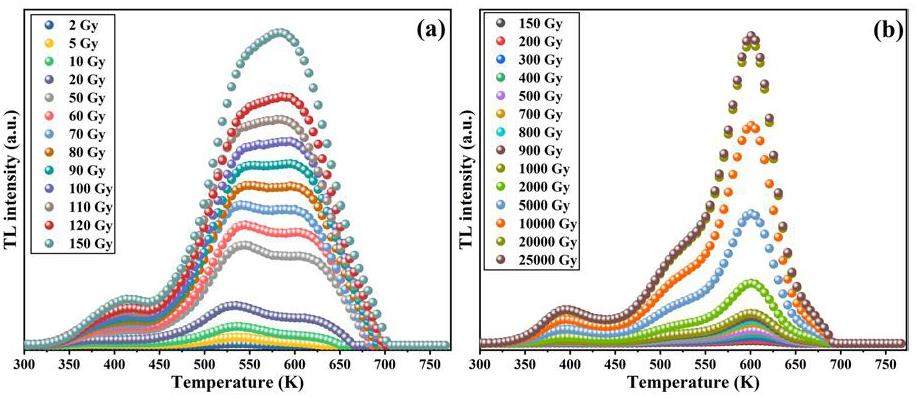
Figure 10 shows the change in integrated TL intensity with increasing dose. Each data point in the figure represents the area under the TL glow curve. The dose response appears to reach saturation and can be fitted using Eq. 3 [47]:
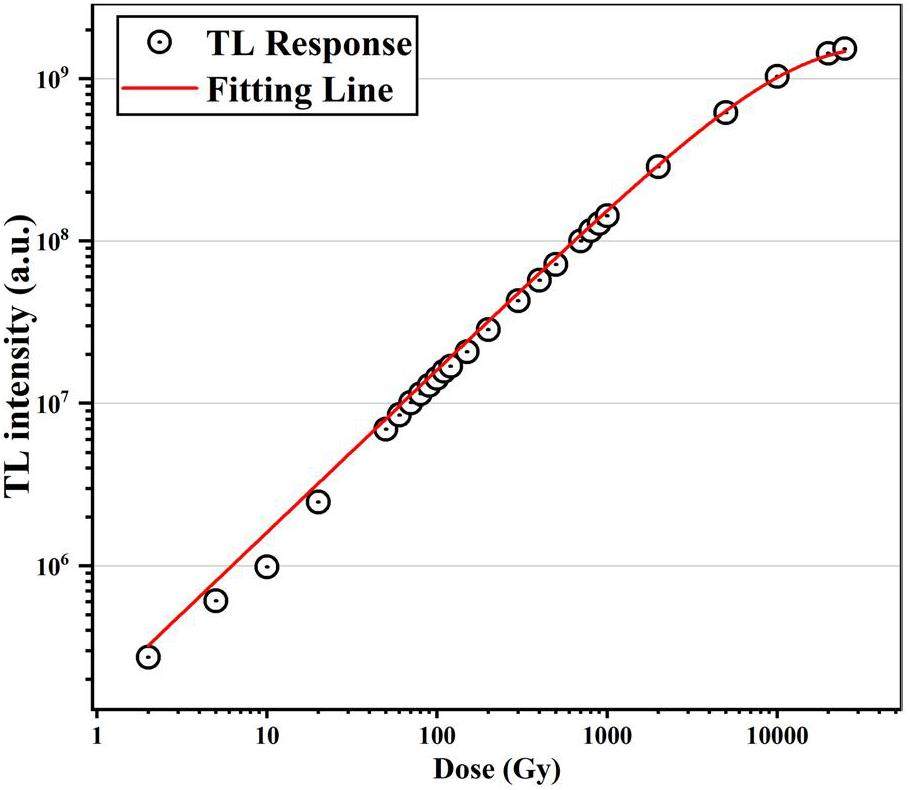
While it is possible to fit the dose response of a TL curve with multiple overlapping peaks using the total integrated TL intensity at various irradiation doses, the significant differences in energy-level lifetimes among these peaks can introduce theoretical deviations. However, these deviations may be negligible within specific dose ranges. To investigate the dose-response characteristics of each individual overlapping peak in the Y1.98Sm0.02MgTiO6 phosphor system, the CGCD method was employed to fit TL curves at various irradiation doses. The results are shown in Fig. 11. In Fig. 11, it can be observed that the peak temperatures Tm of Peaks 1, 2, and 3 shift toward lower temperatures as the irradiation dose increases, consistent with second-order kinetic behavior. Peaks 4, 5, 6, and 7, on the other hand, exhibit no significant change in Tm with increasing irradiation dose, aligning with first-order kinetic behavior and the results are consistent with those of Tm-Tstop method.

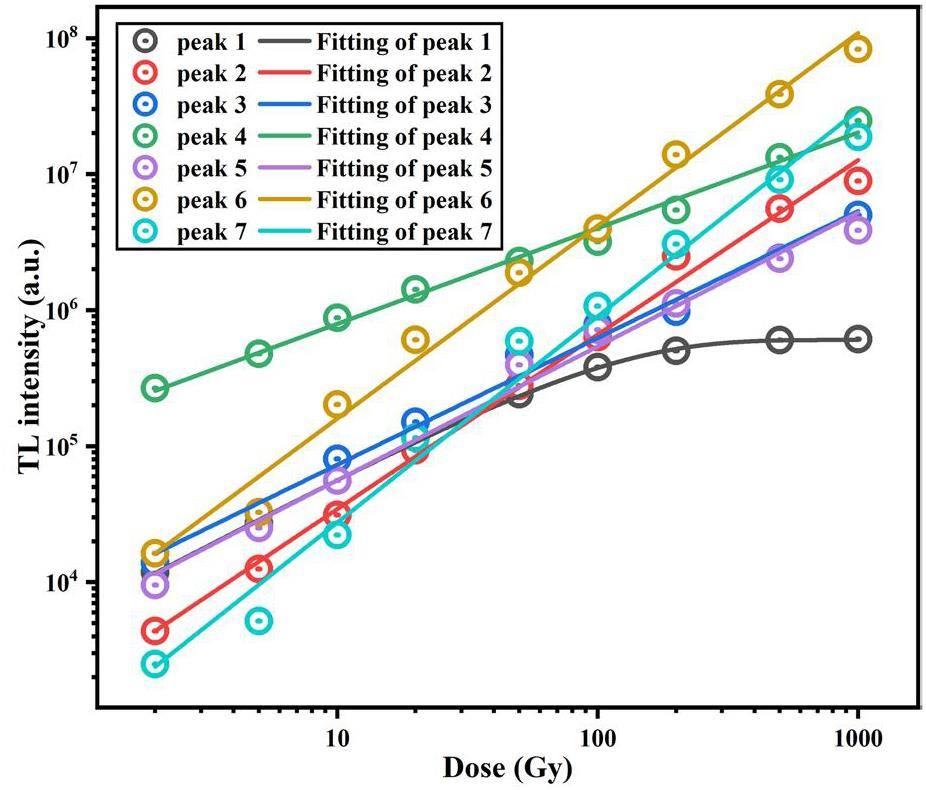
With increasing irradiation dose, the thermoluminescence intensity of peak 1 plateaus beyond 200 Gy. The thermoluminescence integral intensity of each overlapping peak under different irradiation doses was determined to explore the dose-response curves of the different overlapping peaks, as shown in Fig. 11. The results are presented in Fig. 12. The other overlapping peaks, except for Peak 1, exhibit good linear dose-response relationships. Peaks 6 and 7 show similar slopes, as do Peaks 3, 4, and 5, suggesting that Peaks 6 and 7 originate from Sm3+, while Peaks 3, 4, and 5 are associated with the matrix. The slope of peak 6 is significantly larger than that of peak 4, indicating that the characteristic thermoluminescence of Sm3+ is much more sensitive to the irradiation dose than the matrix. The dose response of Peak 1 appears to reach saturation. After fitting this response using Eq. 3, the saturation dose for Peak 1 was determined to be 102.5 ± 3.2 Gy. Considering that the dose rate of the 90Srβ radioactive source is 0.1 Gy/s, and the energy level lifetime of Peak 1 is 980 seconds, it is estimated that Peak 1 reaches saturation at an irradiation dose of approximately 98 Gy, which agrees well with the experimental dose-response measurements. To increase the saturation dose of Peak 1, a higher dose-rate radiation source could be used. For precise measurements below 1 kGy, it would be suitable to eliminate Peak 1 and integrate the TL signal above 378 K. For measurements above 1 kGy, eliminating Peaks 1 and 2 (with a saturation dose of approximately 2.6 kGy) and integrating the TL signal above 415 K would be more appropriate.
Repeatability test
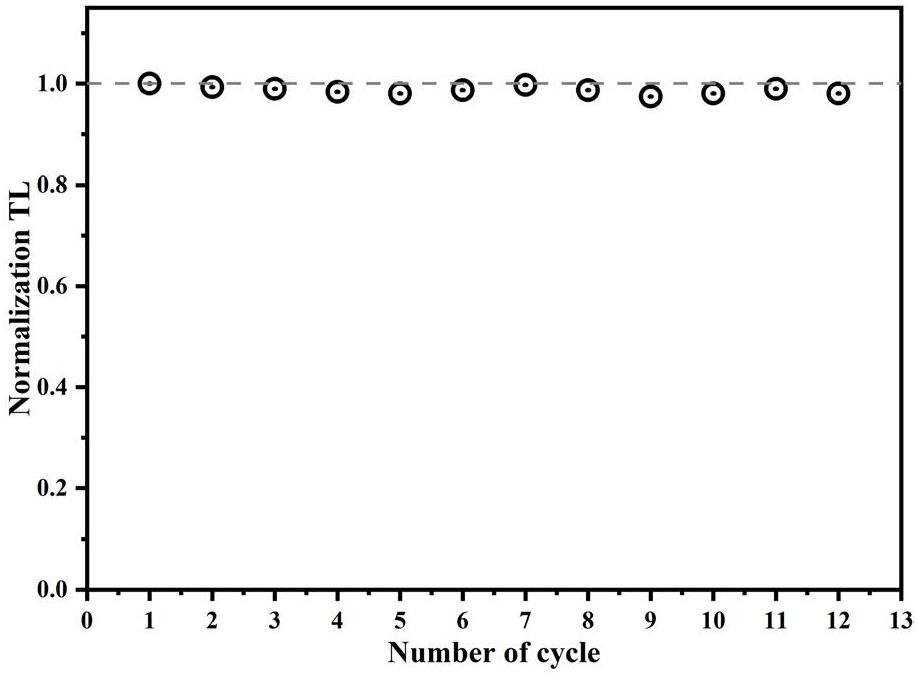
To verify the repeatability of the thermoluminescence (TL) signal, the TL curves of the Y1.98Sm0.02MgTiO6 phosphor was subjected to repeated measurements under 100 Gy irradiation. Figure 13 shows the results of 12 measurements, where the total integral of the TL curve from each measurement was selected as the outcome and normalized. The experimental results indicated a relative standard error of approximately 0.06% for the measured TL signal, indicating minimal influence of radiation and temperature on the TL measurements.
Conclusion
Y2-xSmxMgTiO6 (0≤x≤0.2) series phosphors were synthesized using a high-temperature solid-state method. XRD confirmed the successful incorporation of Sm3+ into the Y3+ lattice sites. PL analysis revealed four emission peaks at 568, 605, 652, and 715 nm under 409 nm excitation. By analyzing the TL curve of the sample, it was found that the TL of Y1.98Sm0.02MgTiO6 sample was the strongest, and three-dimensional thermoluminescence spectrum showed that the thermoluminescence around 530 K was attributed to Y2MgTiO6 matrix, and the thermoluminescence around 610 K was due to Sm3+ defects, which also proved that the matrix was less affected by concentration quenching than Sm3+. Tm-Tstop indicates that the thermoluminescence (TL) spectrum of this phosphor is a superposition of seven peaks. The Tm values for each overlapping peak were 384, 419, 449, 532, 581, 610, and 640 K. Additionally, the kinetic order of each peak was roughly estimated. Utilizing information from the three-dimensional thermoluminescence spectrum and the Tm-Tstop method, the TL curve of the sample was fitted using the CGCD method, yielding reliable results. The trap parameters corresponding to the seven overlapping peaks are as follows: 0.69, 0.81, 0.91, 1.03, 1.22, 1.29, and 1.49 eV, with energy level lifetimes of 9.8×10², 2.6×10⁴, 2.0×10⁶, 2.0×10⁸, 3.3×10¹⁰, 6.5×10¹¹, 1.8×10¹⁴, respectively. The saturation dose of the Y1.98Sm0.02MgTiO6 sample was 9956 Gy. Due to its good thermal stability and low production cost, this phosphor shows promise for high-dose radiation thermoluminescence dosimetry. Dose-response curves for each overlapping peak were generated for accurate dose monitoring. Within the 1 kGy range, Peak 1 saturated at 102 Gy, while the other peaks exhibited linear behavior. For precise dose measurements below 1 kGy, TL integration above 378 K is recommended; for doses above 1 kGy, integration above 415 K is preferable.
Radiation dose detection using a high-power portable optically stimulated luminescence real-time reading system
. Nucl. Sci. Tech. 29 (10), 63-71 (2018). https://doi.org/10.1007/s41365-018-0484-z.New flexible CsPbBr3-based scintillator for X-ray tomography
. Nucl. Sci. Tech. 33 (08), 36-46 (2022). https://doi.org/10.1007/s41365-022-01085-z.Preparation and characterization of Bi2O3/XNBR flexible films for attenuating gamma rays
. Nucl. Sci. Tech. 29 (07), 28-39 (2018). https://doi.org/10.1007/s41365-018-0436-7.Compact ultrabroadband light-emitting diodes based on lanthanide-doped lead-free double perovskites
. Light Sci. Appl. 11, 52 (2022). https://doi.org/10.1038/s41377-022-00739-2.Structural and luminescent properties of Eu3+-doped double perovskite BaLaMgNbO6 phosphor
. Ceram. Int. 44(2), 1909-1915 (2018). https://doi.org/10.1016/j.ceramint.2017.10.130.Study of the relationship between the local geometric structure and the stability of La0.6Sr0.4MnO3-δ and La0.6Sr0.4FeO3-δ electrodes
. Nucl. Sci. Tech. 30, 21 (2019). https://doi.org/10.1007/s41365-019-0550-1.Preparation and luminescent properties of double perovskite-type La2-x-yYxMgTiO6:yEu3+ red fluorescent materials
. J. Lumin. 243,Highly-efficient double perovskite Mn4+-activated Gd2ZnTiO6 phosphors: a bifunctional optical sensing platform for luminescence thermometry and manometry
. Chem. Eng. J. 446,A Mn4+ activated (Gd,La)2(Zn,Mg)TiO6 deep-red emission phosphor: The luminescence properties and potential application for full-spectrum pc-LEDs
. J. Lumin. 247,Multiwavelength near infrared downshift and downconversion emission of Tm3+ in double perovskite Y2MgTiO6:Mn4+/Tm3+ phosphors via resonance energy transfer
. J. Lumin. 213, 356-363 (2019). https://doi.org/10.1016/j.jlumin.2019.05.038.Persistent luminescence instead of phosphorescence:history, mechanism, and perspective
. J. Lumin. 205, 581-620 (2019). https://doi.org/10.1016/j.jlumin.2018.09.047.TLD calibration and absorbed dose measurement in a radiation-induced liver injury model under a linear accelerator
. Nucl. Sci. Tech. 34, 53 (2023). https://doi.org/10.1007/s41365-023-01211-5.Ionizing and non-ionizing kerma factors in silicon for China Spallation Neutron Source neutron spectrum
. Nucl. Sci. Tech. 30, 143 (2019). https://doi.org/10.1007/s41365-019-0664-5.Quantitative energy-dispersive X-ray fluorescence analysis for unknown samples using full-spectrum least-squares regression
. Nucl. Sci. Tech. 30, 52 (2019). https://doi.org/10.1007/s41365-019-0564-8.Simulation study of the dose and energy responses of FNTD personal neutron dosimetry
. Nucl. Sci. Tech. 30, 32 (2019). https://doi.org/10.1007/s41365-019-0546-x.A novel method for gamma spectrum analysis of low-level and intermediate-level radioactive waste
. Nucl. Sci. Tech. 34, 87 (2023). https://doi.org/10.1007/s41365-023-01236-w.Characterization of the new scintillator Cs2LiYCl6:Ce3+
. Nucl. Sci. Tech. 29, 11 (2018). https://doi.org/10.1007/s41365-017-0342-4.Exploiting intervalence charge-transfer engineering to finely control (Ba,Sr)TiO3:Pr3+ luminescence thermometers
. J. Lumin. 236,Thermoluminescence studies of β and γ-irradiated geological materials for environment monitoring
. J. Fluoresc. 30, 819-825 (2020). https://doi.org/10.1007/s10895-020-02536-9.A competitive radioluminescence material - LiF:Mg,Cu,P for real-time dosimetry
. Radiat. 151,Investigation of thermoluminescence in Li2B4O7 phosphors doped with Cu
, Ag and Mg. Sci. China. Ser. G. 50, 311-320 (2007). https://doi.org/10.1007/s11433-007-0020-3.Ab initio molecular dynamics simulation of pressure-induced phase transformation in BeO
. J. Mater. Sci. 46, 6408-6415 (2011). https://doi.org/10.1007/s10853-011-5590-9.Influence of Li dopants on thermoluminescence spectra of CaSO4 doped with Dy or Tm
. J. Lumin. 131(9), 1864-1868 (2011). https://doi.org/10.1016/j.jlumin.2011.04.042.Thermoluminescence glow curves of CaF2: Dy crystals irradiated by soft X-rays
. Z. Physik B - Condensed Matter. 93, 63-66 (1993). https://doi.org/10.1007/BF01308808.Influence of reaction of Al2O3 and carbonaceous materials in Al2O3–C refractories on aluminum and carbon pick-up of iron
. J. Iron Steel Res. Int. 27, 55-61 (2020). https://doi.org/10.1007/s42243-019-00352-5.Thermoluminescent spectra of MgB4O7 doped with Mn and Dy
. Nuclear Techniques 33(01), 31-34 (2010).(in Chinese)Investigation of novel Eu doped SrDy2O4 microphosphor for thermoluminescence dosimetry
. J. Lumin. 231,Investigation of novel Eu doped SrDy2O4 microphosphor for thermoluminescence dosimetry
. J. Lumin. 231,Thermoluminescence glow curve analysis and kinetic parameters of Dy-doped BaSi2O5 phosphor
. J. Rare Earths. 40, 234-242 (2022). https://doi.org/10.1016/j.jre.2020.10.020.Sol-gel synthesis and the effect of boron addition on the phosphorescent properties of SrAl2O4:Eu2+,Dy3+ phosphors
. J. Mater. 16, 644-651 (2001). https://doi.org/10.1557/JMR.2001.0122.Thermoluminescence and infrared stimulated luminescence in long persistent monoclinic SrAl2O4:Eu2+, Dy3+ and SrAl2O4:Eu2+, Nd3+ phosphors
. Opt. Mater. 92, 46-52 (2019). https://doi.org/10.1016/j.optmat.2019.04.015.Kinetic parameters of γ-irradiated Y2O3 phosphors: effect of doping/codoping and heating rate
. Radiat. Phys. Chem. 110, 51-58 (2015). https://doi.org/10.1016/j.radphyschem.2015.01.015.Inhibitory effect of gamma irradiation on Penicillium digitatum and its application in the preservation of Ponkan fruit
. Sci. Hortic. 272,Study on radiation preservation of frozen egg liquid
. Radiat. Phys. Chem. 57, 341-343 (2000). https://doi.org/10.1016/S0969-806X(99)00401-6.Revised Effective Ionic Radii and Systematic Study of Inter Atomic Distances in Halides and Chalcogenides
. Acta. Crystallogr. A. 32 (SEP1), 751-767 (1976). https://doi.org/10.1107/S0567739476001551.Vibrational spectroscopic and crystal chemical analyses of double perovskite Y2MgTiO6 microwave dielectric ceramics
. J. Am. Ceram. 103, 16737 (2019). https://doi.org/10.1111/jace.16737.Luminescence and temperature sensing properties of Y2-x-yTmxSmyMgTiO6 phosphors
. J. Lumin. 267,Photoluminescence properties and energy transfer of double perovskite Ca2LaTaO6:Bi3+, Tb3+ phosphor
. J. Lumin. 252,Synthesis and luminescence properties of a novel dazzling red-emitting phosphor NaSr3SbO6:Mn4+ for UV/n-UV w-LEDs
. Dalton Trans. 48, 3187-3192 (2019). https://doi.org/10.1039/C8DT04827D.Luminescence properties and energy-transfer behavior of Y2-x-yBixEuyMgTiO6 phosphors
. Heliyon. 9(8),Red light component tuning by n-UV/blue light excitations in Sm3+/Eu3+ co-doped Y2O3–Al2O3–Bi2O3–B2O3–SiO2 glasses for W-LED applications
. Opt. Mater. 134,BRIGHT: the three-dimensional X-ray crystal Bragg diffraction code
. Nucl. Sci. Tech. 30, 39 (2019). https://doi.org/10.1007/s41365-019-0559-5.Energy transfer induced color tunable photoluminescence in Tb3+/Sm3+ co-doped Y2O3 nano-phosphor for warm white LEDs
. J. Alloys Compd. 931,Luminescence characteristics of Y2-x-yBixEuyMgTiO6 phosphors
. Nuclear Techniques 46,Study of thermoluminescence, photoluminescence and dosimetry for the YAGG:Ce(Y2.96Al3.4Ga1.6O12:0.04Ce) phosphor
. Appl. Radiat. Isot. 193,Thermoluminescence of natural quartz grains beside Huguangyan Maar Lake
. J. Phys. Conf. Ser. 2470,Investigation on thermoluminescence of phosphor YGaAG:Ce(Y2.96Ce0.04Al3.4Ga1.6O12)
. Nuclear Techniques. 43,The authors declare that they have no competing interests.


