Introduction
Spills, leaks from unsealed sources, or breakage or breach of the integrity of sealed sources can result in radioactive contamination of material surfaces. This requires the effective monitoring of surface radioactive contamination in radiation workplaces. Large-area α- and β-plane sources are widely used to provide the necessary traceability for measurements [1-5]. For absolute measurements of α and β surface emission rates, large-area windowless multiwire gas-flow proportional counter systems are commonly used. In this approach, the measurement function of the surface emission rate E is modeled as follows [6-9]:
The conventional approach to the evaluation of surface emission rate uncertainty is the Guide to the Expression of Uncertainty in Measurement (GUM) method [10], which uses a nonlinear functional model to propagate uncertainty. This method determines the combined standard uncertainty of the output quantities using the law of uncertainty propagation. In the measurement function model of the surface emission rate E, the standard uncertainties of R and B are obtained by statistically determining the experimental standard deviation of the measured values, a process known as Type A evaluation of uncertainty. For counting measurement systems based on single-channel analysis techniques, the system dead time τ is typically obtained using the two-source measurement model, and the correction factor f is typically referred to as the voltage threshold correction factor fd. The value of fd is obtained by fitting the threshold extrapolation curve using the low-energy correction method. These two evaluation processes are usually classified as Type B uncertainty evaluations. This is due to the fact that when evaluating the uncertainty of surface emission rate using the GUM method, calibrators often make artificial assumptions about the probability distribution of measurement results from complex non-linear equation models, usually assuming a rectangular distribution, and the effect of this method on the uncertainty evaluation results is unknown.
Owing to the nonlinear nature of the measurement model and the challenges associated with calculating the partial derivatives of the model in the surface emission rate uncertainty, the uncertainty can be measured using the Monte Carlo method (MCM) proposed in ISO/IEC GUIDE 98-3 [11]. As shown in Fig. 1, the MCM obtains the probability distribution function (PDF) of the output quantity Y by randomly sampling the PDF of the input quantity Xi. On this basis, the best estimates of output quantity, standard uncertainty, and coverage interval are obtained.
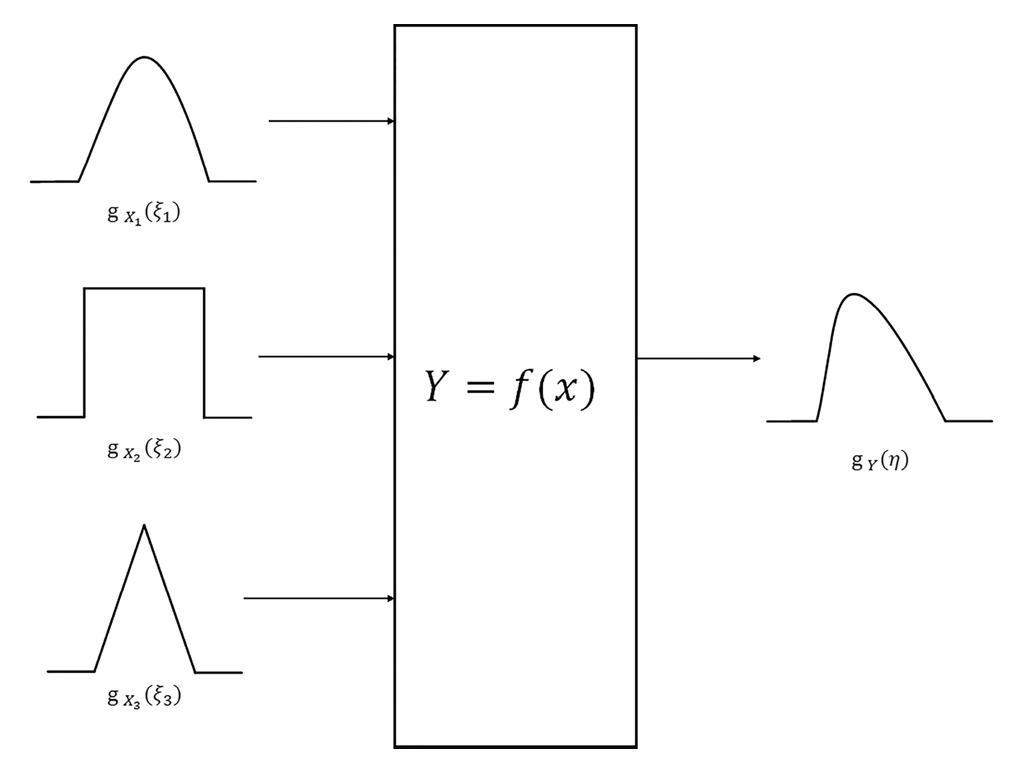
The MCM has been used less frequently in uncertainty assessment studies of nuclear measurements [12, 13]. This is due to the fact that, although the GUM method has a generalized law of propagation of uncertainty, a complete and specific measurement function model may differ due to the variations in experimental measurements for each measured quantity and the differences in function models for each component, resulting in a complex law of propagation of uncertainty with Taylor expansions. The staff may intentionally simplify the measurement model through known evaluation results, avoid complex terms in the evaluation process, or treat them as constants to regain uncertainty with a smaller value, which may affect the accuracy of the traceability of quantity values [14]. In contrast, the MCM can directly perform calculations for a variety of complex models to obtain the best estimate and standard uncertainty without considering the trade-offs between higher-order terms of the Taylor expansion in the law of the propagation of uncertainty. Therefore, the key to the MCM is to obtain a model of the function between the input and output quantities and its probability distribution for each measured quantity.
To evaluate the 2πα and 2πβ surface emission rate uncertainties, this study first describes the experimental setup, measurement method, and model for the system dead time and voltage threshold correction factor. The MCM is used to refine the surface emission rate measurement function model based on Eq. 1. Finally, the law of propagation of the uncertainty of the GUM is verified and compared with the functional model of the MCM.
Methods
Experimental set-up
In this study, a large-area windowless multiwire gas-flow proportional counter [15] developed by the China Institute of Atomic Energy (CIAE) was used as the detector. The working principle of this detector is based on the primary ionization of α and β particles in the sensitive volume of the proportional counter, which produces positive ions and electrons. These particles are then accelerated by an electric field to gain sufficient energy to trigger secondary ionization with gas molecules. The number of electron–ion pairs produced by this process is proportional to the number of electron–ion pairs produced by the primary ionization, resulting in a linear amplification of the primary ionization pulse signals from the α and β particles.
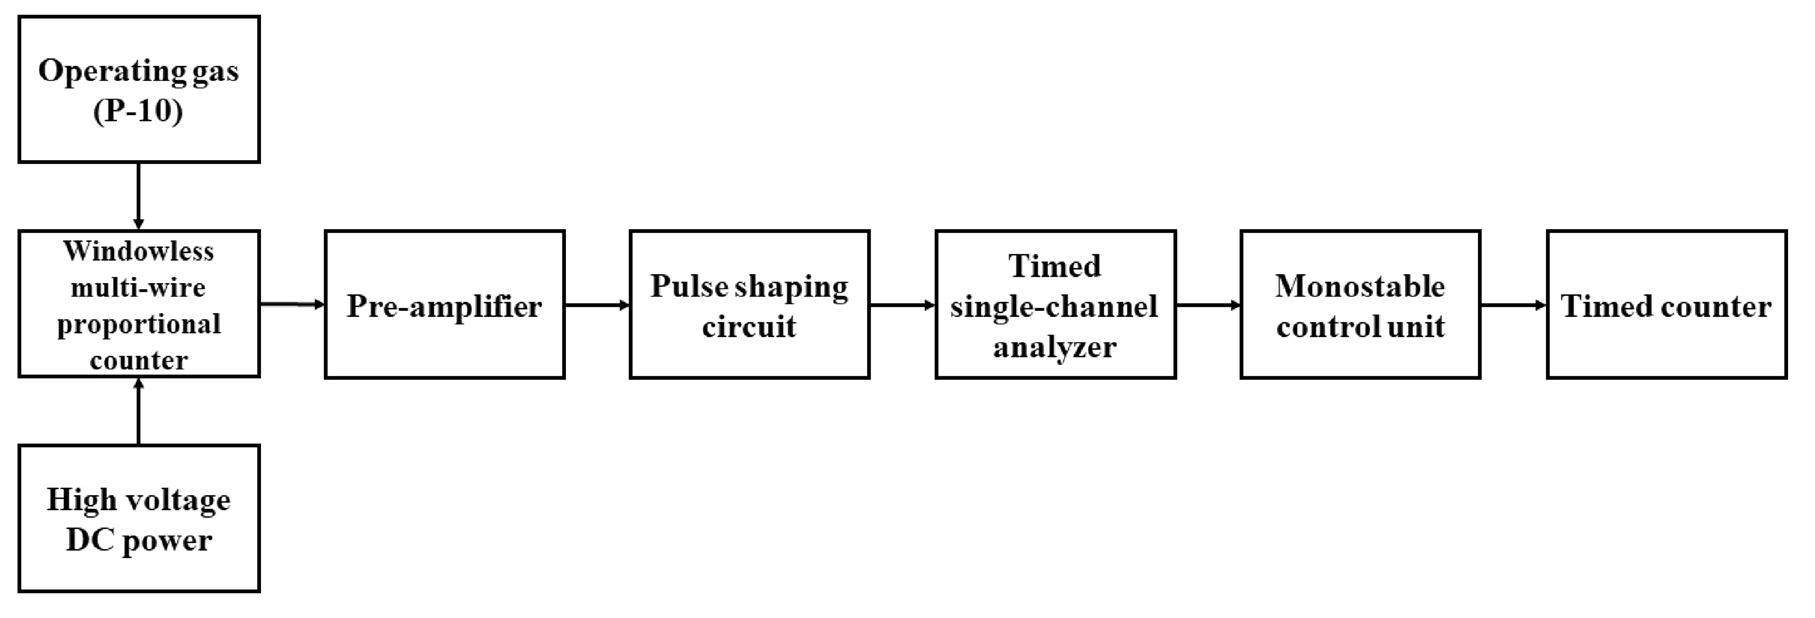
For the single-channel counting measurement requirements of this experiment, the electronic equipment included a high-voltage DC power supply, current-type pre-amplifier, pulse-shaping circuit, timing single-channel analyzer, monostable control unit, and timer/counter. A diagram of the instrument is shown in Fig. 2. P-10 gas (a mixture of 90% Ar and 10% CH4) was used as the operating gas at a flow rate of 100 mL/min. The working high voltage for the α-plane source was 2100 V, whereas that for the β-plane source was 2800 V. Measurements were performed on four plane sources (241Am, 238Pu, 90Sr, and 204Tl). According to oscilloscope observations, the pulse width of the pulse signal output from the main amplifier was generally less than 2 μs. The output pulse width of the single-channel analyzer was approximately 650 ns, whereas the pulse width of the monostable control unit had an adjustable range of 0.4–4 μs.
Dead time measurement
The surface emission rate of plane sources generally does not exceed 5000 s-1, resulting in a dead time that produces leakage counts that may have a small effect on the count rate measurements [16-22]. However, because the windowless proportional counter is an absolute measurement device, it is necessary to measure the dead time of the system to correct for leakage counts. The dead time provided by the monostable control unit within the measurement system is a non-extended dead time; however, the system dead time is also affected by various components. Therefore, it is necessary to measure the system dead time experimentally. ICRU Report 52 [23] recommends three methods for measuring the dead time. In this experiment, a two-source two-pulse method was used to measure the dead time of the system. In this method, pulse signals are generated from two different radioactive sources and input into the detector separately to obtain the measurement count rates of the two sources, n1 and n2. The two sources are then measured simultaneously using a detector to obtain the mixed measurement count rate n12. Ideally, the real count rate of three sets of pulse count rates
Threshold correction factor measurements
To avoid the influence of noise on count measurement, a discriminating voltage threshold must be set. Because the energy of α particles is high and the discriminating threshold is set low, small changes in the α-particle count rate measurement can be ignored. However, the energy spectrum of β sources is continuously distributed, and it is difficult to distinguish their low-energy signal from noise signals using the pulse amplitude. Consequently, setting the discriminating voltage threshold may result in a loss of the β-particle count rate, and a threshold correction for β sources must be performed [5, 24-26].
Some National Metrology Laboratories [27, 28] that use multichannel analyzers to construct measurement systems typically calibrate the site corresponding to the lower threshold by using 10% of the site of the 55Fe full-energy peak. This is primarily designed to correct for count-rate variations owing to fluctuations in the gain of the working gas. Although a measurement system based on a single-channel analyzer cannot set a lower threshold by determining the absolute energy, it is possible to set different lower discriminating voltage thresholds to obtain the count rate at different discriminating voltage thresholds, and then extrapolate to obtain the count rate when the threshold is zero.
The threshold extrapolation curves are influenced by low-energy noise interference and the characteristics of the beta smooth continuum spectrum and can only be assumed to be a straight line over a small threshold interval. As a rule of thumb, the normalized value (predicted value/fitted intercept) of the fitted curve should not exceed 90%. The threshold extrapolation curve fitted using the least-squares method [29-33] is a straight line, where x represents the voltage threshold and y represents the measured count rate. The equation for the fitted curve is as follows:
Evaluation by the GUM method
The evaluation process of the GUM method is divided into two types of evaluations: A and B. This study focuses on two uncertainty components: system dead time and voltage threshold correction factor, and the process is a Type B evaluation. The uncertainty obtained from the Type B evaluation of uncertainty can be obtained using Eq. (6).
a. Evaluation of system dead-time uncertainty
In the GUM method, the monostable control unit produces a square wave as the output signal. The pulse width of this signal is typically measured using an oscilloscope, which requires debugging the oscilloscope’s resolving power and sampling time interval. After debugging, the system dead-time interval half-width a is determined based on the time interval of the index value, as shown on the oscilloscope. Because the probability distribution function of the system’s dead time is unknown, it is generally assumed that the error follows a rectangular distribution, in which case
b. Evaluation of voltage threshold correction factors uncertainty
In this study, the threshold correction curves were fitted using the least-squares method. The expected corrections obtained from the calibration curves and their standard uncertainties were calculated using their intercepts, slopes, estimated variances, and covariances. Multiple sets of thresholds and the corresponding measurements were selected and substituted into Eqs. 4 and 5 to obtain the p and q values, which were substituted into the following equation:
The previous two subsections provide the system dead-time and voltage threshold correction factors and their uncertainty components, which can be used to obtain the relative uncertainty of each component. According to the GUM method, the relative combined standard uncertainty u(E) of the surface emission rate can be derived from Eq. 1 using the law of propagation of uncertainty proposed by Stanga [37].
Evaluation by the MCM
The MCM provides a general numerical approach for evaluating the measurement uncertainty for models with any number of input quantities that can be characterized by a PDF and a single output quantity. In this study, MATLAB was used as the Monte Carlo simulation platform to model the measurement between the output quantities Y and input quantities X1, …, XN. According to Equations (1), (2), and (12), a new measurement function for the surface emission rate E can be obtained as follows:
| Input (Xi) | Sources of data | Probability distribution |
|---|---|---|
| R | Experimental measurement results | Normal |
| B | Experimental measurement results | Normal |
| n1 | Experimental measurement results | Normal |
| n2 | Experimental measurement results | Normal |
| n12 | Experimental measurement results | Normal |
| x | Experimental scale readings | Rectangular |
| p | Calculated results | Normal |
| q | Calculated results | Normal |
Finally, the estimated and standard uncertainty of Y were calculated from the PDF of Y and the coverage interval of Y at a 95% coverage probability (k=2).
Results
The order of the experimental measurement was as follows: first, the system dead time was measured, then the voltage threshold correction factor was determined, followed by the count rate and background, and finally, the combined standard uncertainty was calculated.
GUM method
a. System dead time uncertainty The system dead-time measurements were performed using two α-plane sources with a count rate of 5000 s-1. Ten measurements were taken per set of experiments, and the statistical standard deviations obtained as the measurement uncertainties are listed in Table 2.
| Quantity of experiments | Measured value (s-1) | Standard deviation (s-1) |
|---|---|---|
| n1(239Pu) | 5229.78 | 26.10 |
| n2(241Am) | 5403.96 | 12.61 |
| n12(239Pu +241Am) | 10424.83 | 27.79 |
The measured values in Table 2 were substituted into Eq. (2) to obtain the system dead-time values. According to the method described in Sect. 2.4.1, the half-widths of the interval of the system dead time, a= 0.2 μs, and k =
| System dead time (s) | Standard uncertainty (s) |
|---|---|
| 3.696×10⁻⁶ | 0.115×10⁻⁶ |
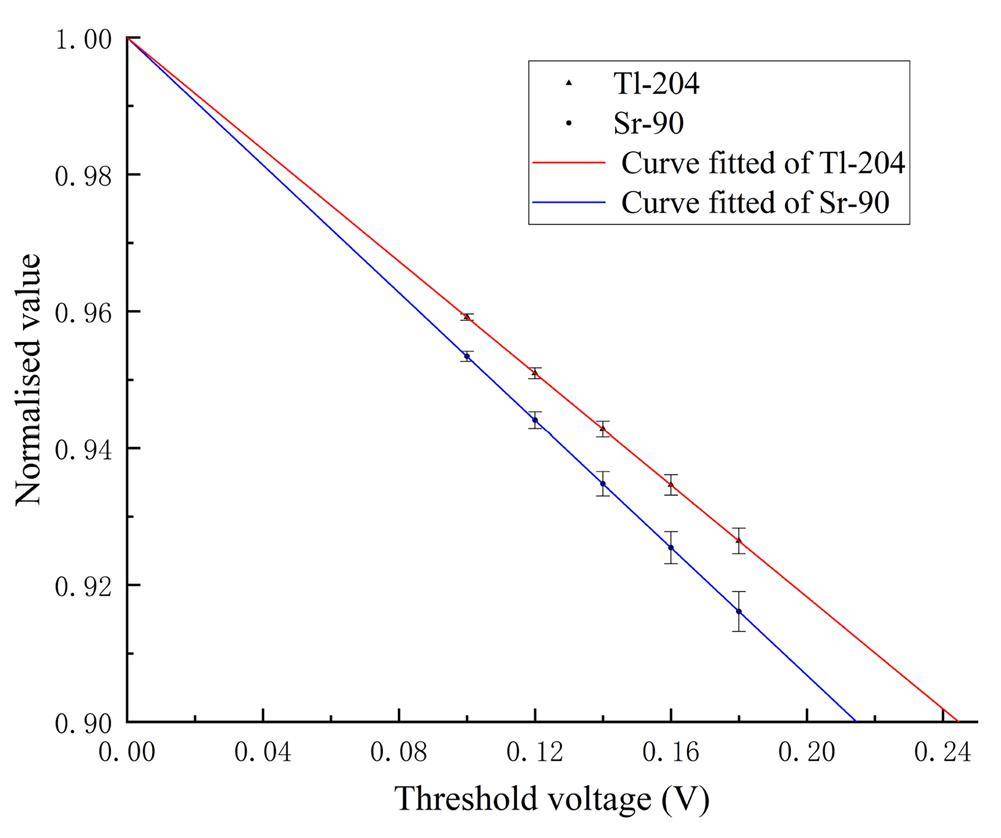
b. Voltage threshold correction factor uncertainty The threshold correction curves of the 90Sr and 204Tl plane sources were measured by increasing the threshold voltage from 0.040 V. The measured count rate at each set of voltages was recorded, and the obtained data are shown in Figs. 3 and 4.
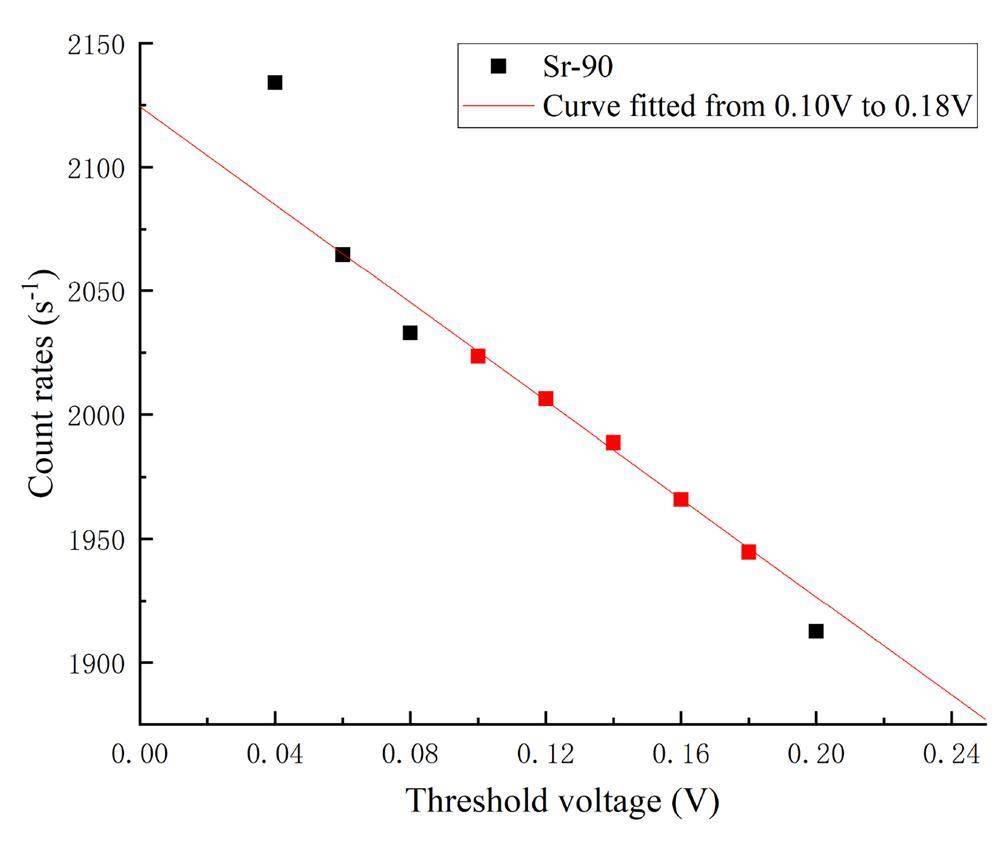
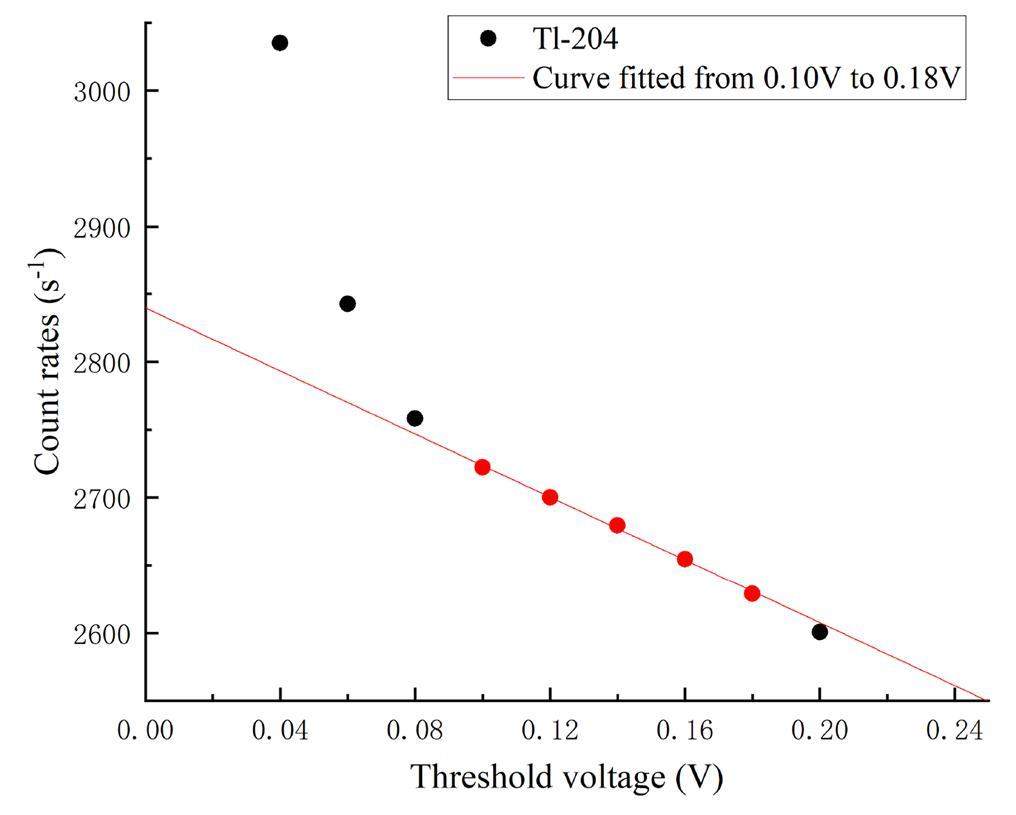
According to the threshold correction curve plots of the 90Sr and 204Tl plane sources, the following was found: at 0.04 to 0.10 V, the curve non-linearity fluctuated greatly, mainly because the count rate contained a large number of noise signals; at 0.10 to 0.18 V, the correlation coefficient of the fitted curves had the largest value of R2, the fitting effect was the best, and the normalized values of the count rate (predicted value/fitted intercept) were all greater than 90%. The normalized curve obtained is shown in Fig. 5. The above five sets of measurements were then entered into Eqs. (4) and (5), and the slopes p and intercepts q of the threshold correction curves for the 90Sr and 204Tl plane sources, as well as the standard deviation s(p) of the slopes, the standard deviation s(q) of the intercepts, the estimated variances s2, and the correlation coefficients r(p,q), were obtained and recorded in Table 4.
| β sources | p | q | s(p) | s(q) | s2 | r(p,q) |
|---|---|---|---|---|---|---|
| 90Sr | -989.76 | 2124.44 | 61.69 | 5.09 | 5.07 | -0.98020 |
| 204Tl | -1160.56 | 2839.67 | 52.89 | 4.36 | 3.73 | -0.98020 |
By substituting the calculation results in Table 4 into Equation (11), the uncertainty was evaluated for five sets of data in the range of 0.10 to 0.18 V, and the results are listed in Table 5.
| Coordinate | Threshold (V) | 90Sr | 204Tl | ||
|---|---|---|---|---|---|
| Standard deviation (s-1) | Relative standard deviation | Standard deviation (s -1) | Relative standard deviation | ||
| x1 | 0.10 | 1.554 | 0.08% | 1.332 | 0.05% |
| x2 | 0.12 | 2.618 | 0.13% | 2.244 | 0.08% |
| x3 | 0.14 | 3.787 | 0.19% | 3.246 | 0.12% |
| x4 | 0.16 | 4.987 | 0.25% | 4.275 | 0.16% |
| x5 | 0.18 | 6.200 | 0.32% | 5.315 | 0.20% |
Both relative standard uncertainties of the two β sources are minimized at the threshold x = 0.10 V. By substituting the predicted values at this threshold into Eq. (12), the voltage threshold correction factors and coverage intervals for the two sources were obtained, as shown in Table 6.
| β sources | q (s-1) | px1+q (s-1) | Standard deviation, px1+q (s-1) | Coverage interval, px1+q (s-1) | fd | Coverage interval, fd |
|---|---|---|---|---|---|---|
| 90Sr | 2124.44 | 2025.47 | 1.55 | [2023.91,2027.02] | 1.04887 | [1.04806,1.04967] |
| 204Tl | 2839.67 | 2723.61 | 1.33 | [2722.28,2724.94] | 1.04261 | [1.04210,1.04312] |
The voltage threshold correction factors and uncertainties for the two β sources were then obtained from Eq. (13), as listed in Table 7.
| β sources | fd | Standard uncertainty |
|---|---|---|
| 90Sr | 1.0489 | 0.00047 |
| 204Tl | 1.0426 | 0.00030 |
c. Combined standard uncertainty
The measured data were collated when the α source did not require threshold correction by setting its fd value to 1 and its u(fd) value to 0. The results are summarized in Table 8.
| Sources | E (s-1) | B (s-1) | R (s-1) | fd | τ (s) | urel(B) | urel(R) | urel(fd) | urel(τ) |
|---|---|---|---|---|---|---|---|---|---|
| 241Am | 5514.70 | 0.608 | 5403.96 | 1 | 3.696×10⁻⁶ | 15.57% | 0.23% | 0.000% | 3.12% |
| 239Pu | 5333.47 | 0.608 | 5229.78 | 1 | 3.696×10⁻⁶ | 15.57% | 0.50% | 0.000% | 3.12% |
| 90Sr | 2098.93 | 39.46 | 2025.47 | 1.0489 | 3.696×10⁻⁶ | 1.15% | 0.18% | 0.044% | 3.12% |
| 204Tl | 2827.70 | 39.46 | 2723.61 | 1.0426 | 3.696×10⁻⁶ | 1.15% | 0.32% | 0.028% | 3.12% |
By substituting various data from Table 8 into Eq. (14), the standard and relative standard uncertainties of the four plane sources were obtained, as listed in Table 9.
| Sources | Surface emission rate, EG (s-1) | Standard uncertainty uG (s-1) | Relative standard uncertainty, urel-G |
|---|---|---|---|
| 241Am | 5514.7 | 13.9 | 0.25% |
| 239Pu | 5333.5 | 27.9 | 0.52% |
| 90Sr | 2098.9 | 4.5 | 0.22% |
| 204Tl | 2827.7 | 10.4 | 0.37% |
Monte Carlo method (MCM)
According to the information in Table 1, the input quantity Xi for the Monte Carlo simulation was defined as follows: The input quantities (n1, n2, n12) and their normal distributions for the system dead time were obtained from Table 2. The standard deviations of p and q were obtained from Equations (8) and (9) and were assumed to be normally distributed by default. The threshold voltage reading x = 0.10 V had a rectangular distribution with a scale component value of 0.02 V, and its coverage interval was set to [0.08, 0.12]. The measurements of count rate R and background count rate B in Table 6 were used to obtain the coverage interval of the normal distribution of these two quantities using their standard deviations. In the Monte Carlo simulation, the random sample size for each input quantity was set to M = 107. The uncertainties for the system dead time, β-source voltage threshold correction factors, and combined standard uncertainty were obtained, and the results are presented in Tables 10, 11, and 12.
| Dead time (s) | Standard uncertainty (s) |
|---|---|
| 3.694×10⁻⁶ | 0.697×10⁻⁶ |
| β sources | fd | Standard uncertainty |
|---|---|---|
| 90Sr | 1.0489 | 0.0047 |
| 204Tl | 1.0426 | 0.0055 |
| Sources | Surface emission rate, EM (s-1) | Standard uncertainty uM (s-1) | Relative standard uncertainty, urel-G |
|---|---|---|---|
| 241Am | 5513.5 | 24.9 | 0.45% |
| 239Pu | 5332.3 | 33.6 | 0.63% |
| 90Sr | 2101.0 | 14.6 | 0.69% |
| 204Tl | 2829.1 | 18.6 | 0.66% |
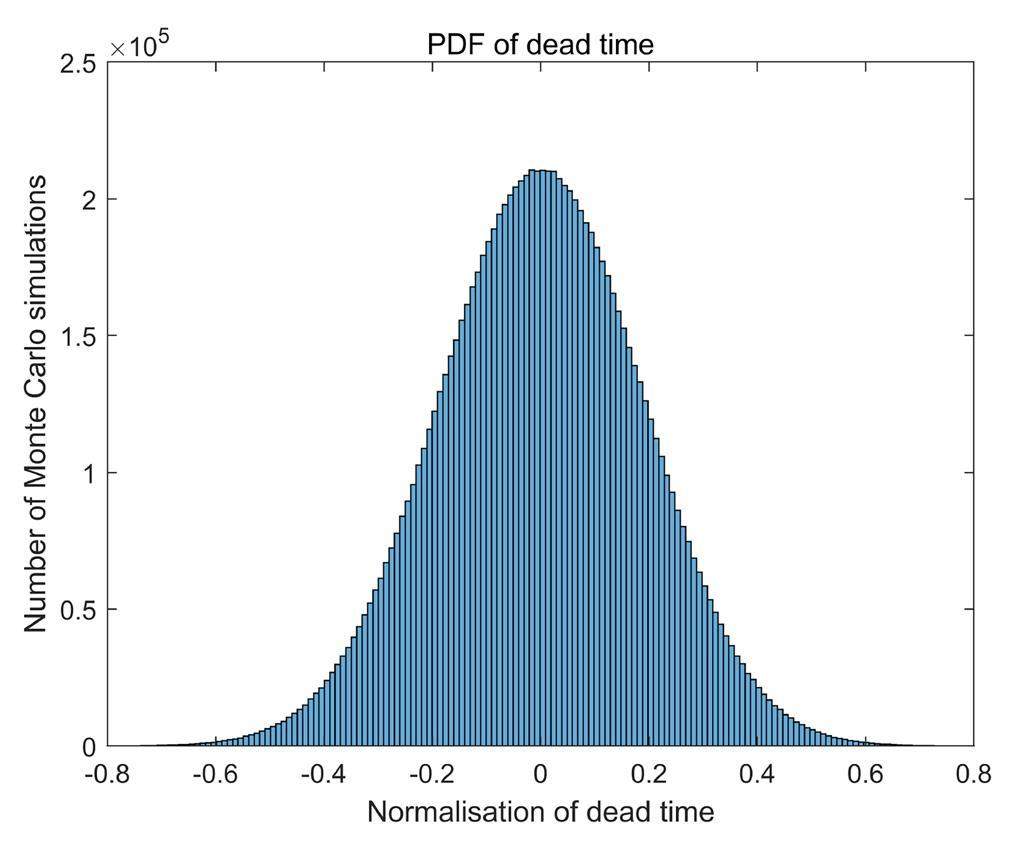
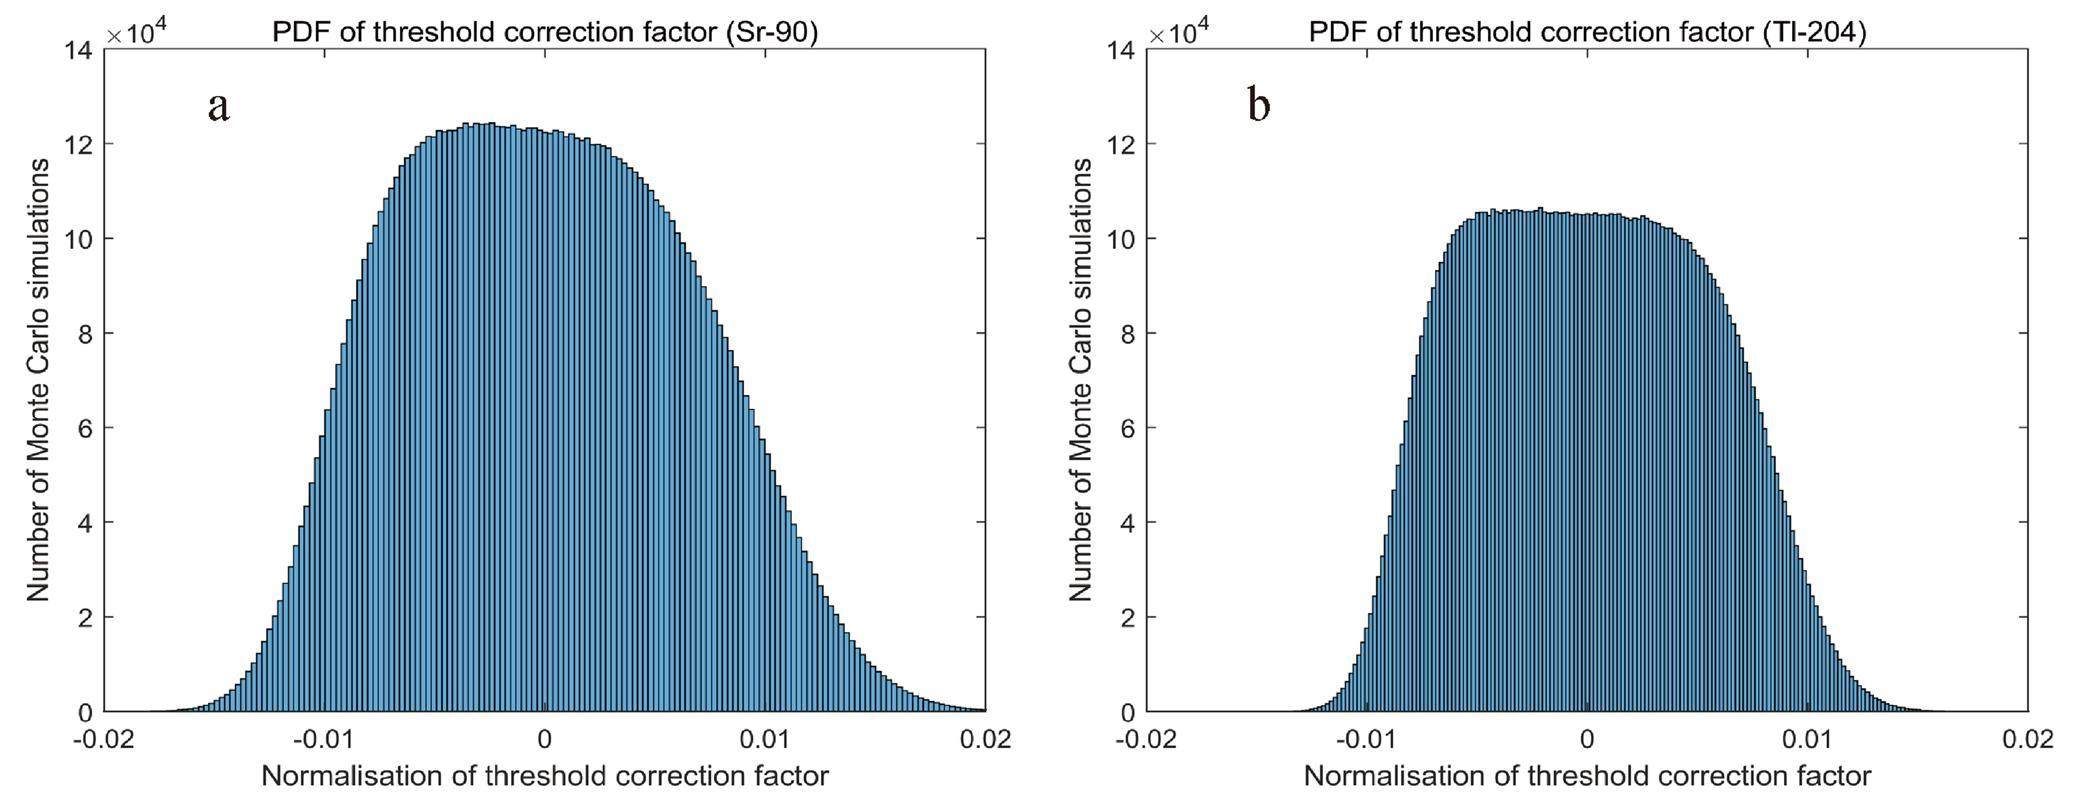
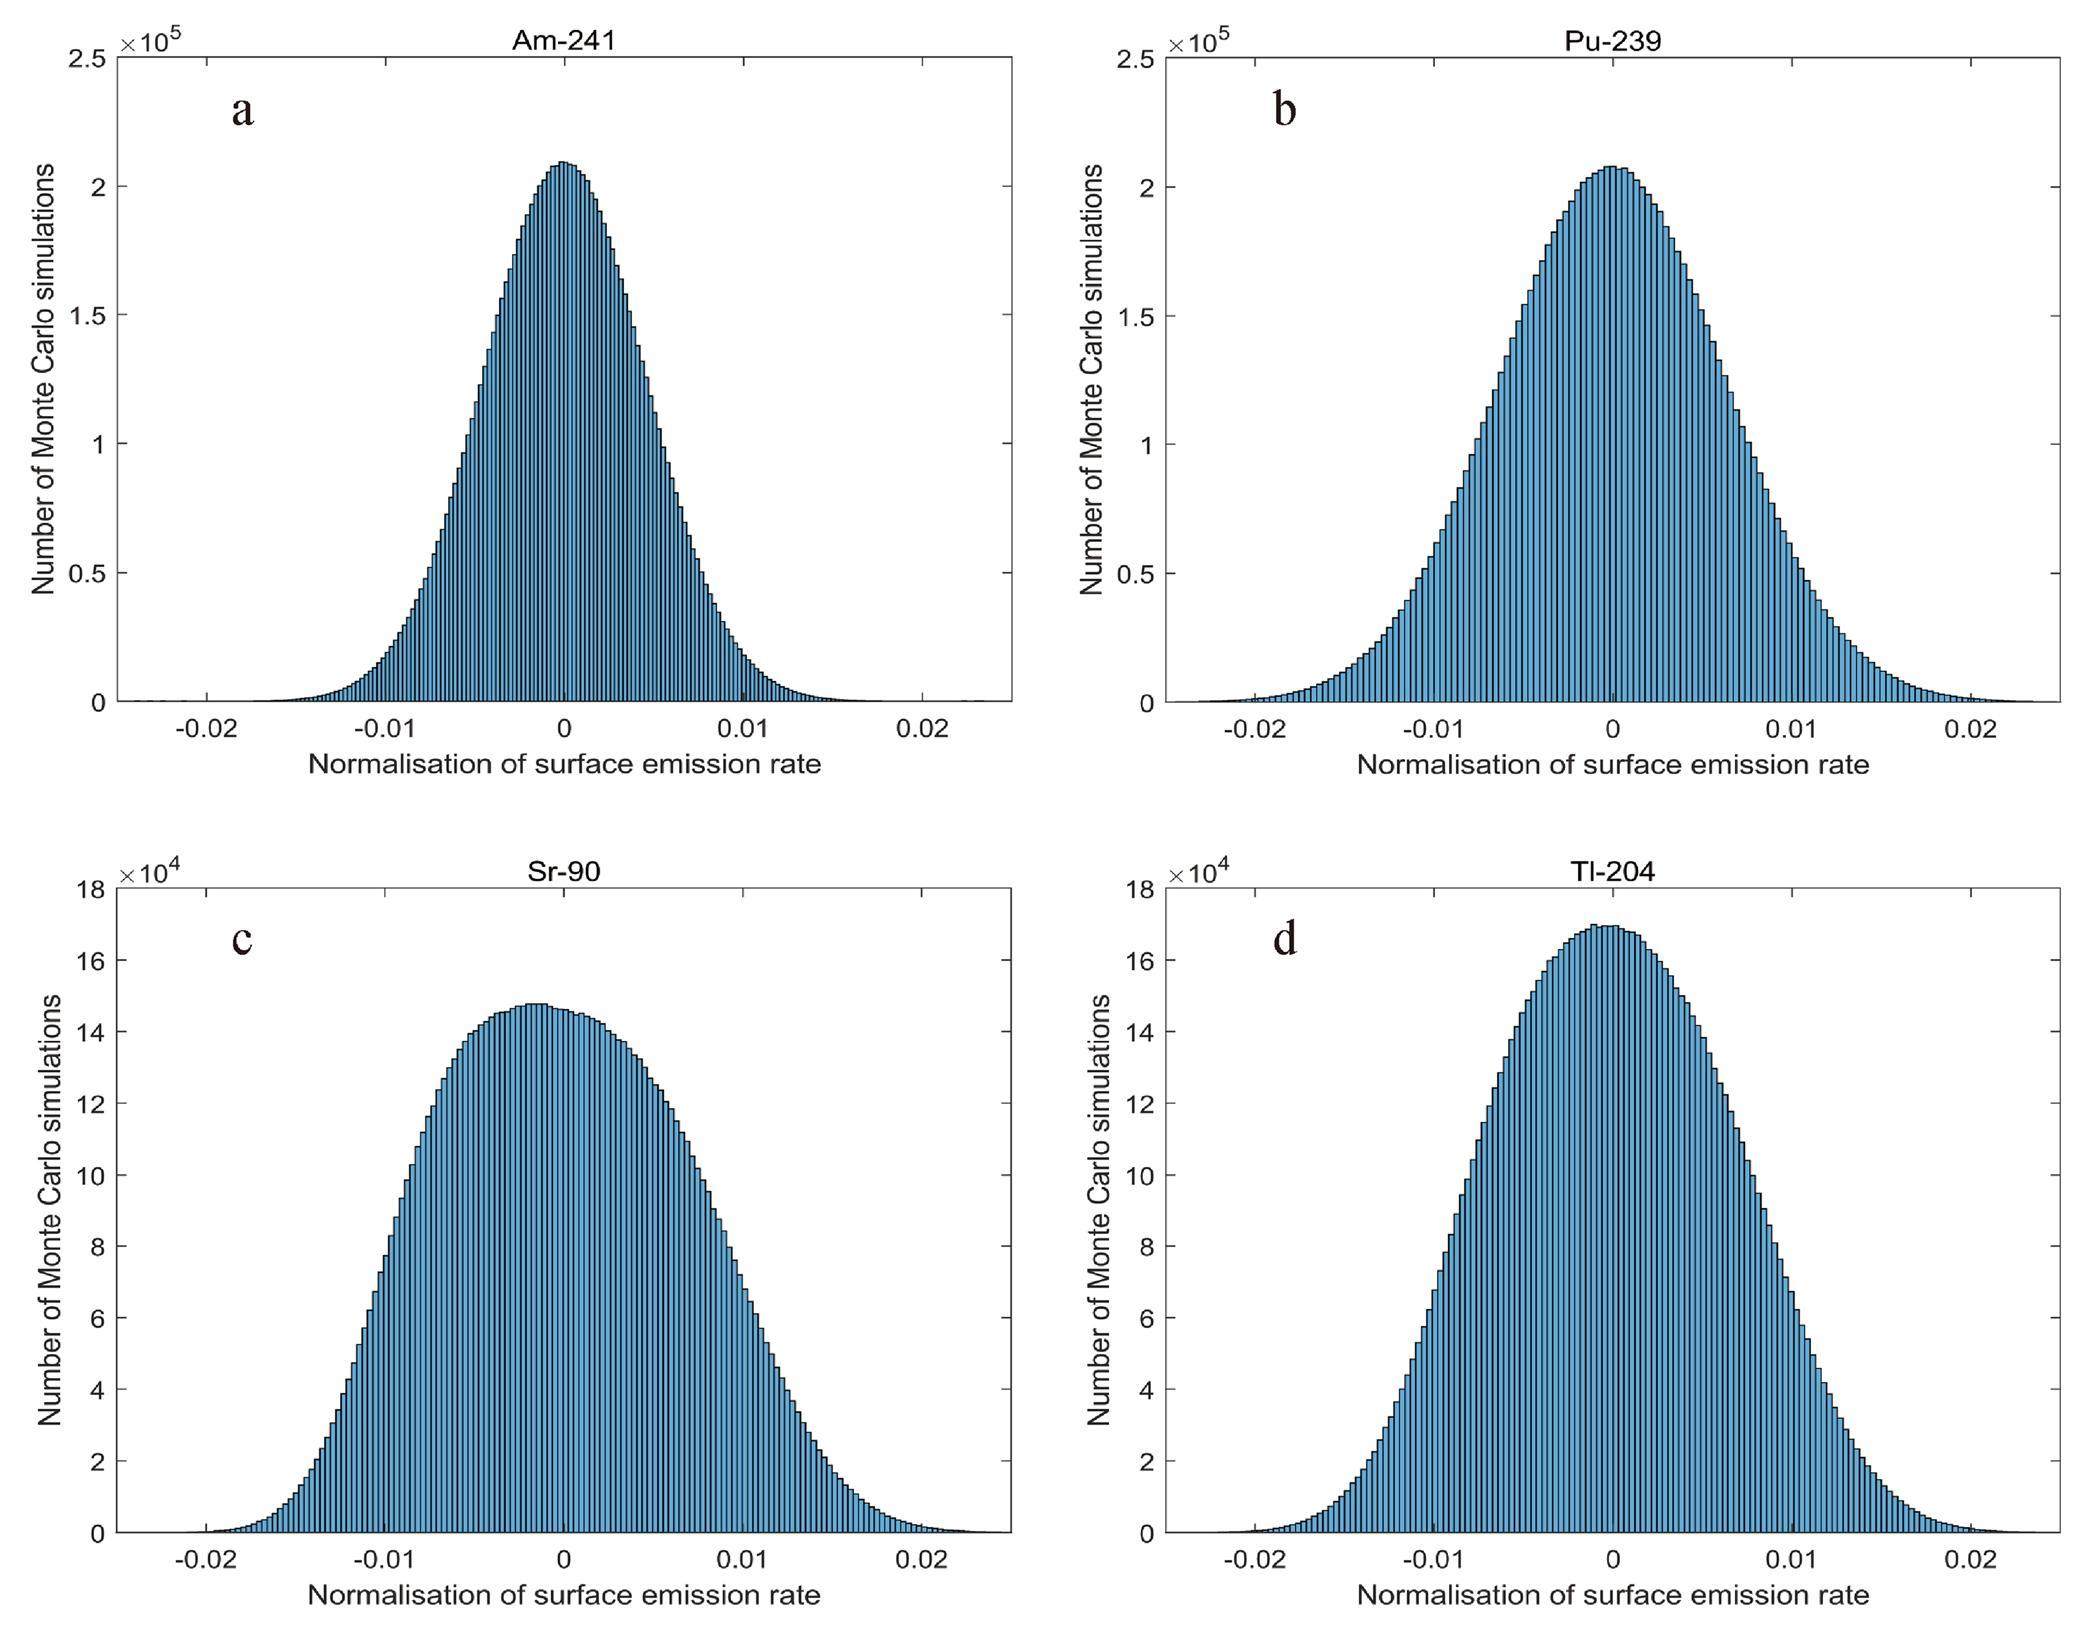
A normalized histogram of the distribution function of the system dead time obtained by the Monte Carlo simulation is shown in Fig. 6. A normalized histogram of the distribution function of the voltage threshold correction factors for the two β sources is shown in Fig. 7. A normalized histogram of the distribution function of the surface emission rate for the four sources is shown in Fig. 8. Each histogram contains 200 bars.
Finally, the value of En was used to determine whether the results of the two methods were consistent within the uncertainties. The En value is a statistical index used to evaluate the measurement capability of a laboratory. It is used to compare the difference between the laboratory measurement results and the reference value, as well as the measurement uncertainty. The closer the value of En is to zero, the closer the laboratory measurement results are to the reference values. If the absolute value of En is less than 1, the laboratory measurement results are considered consistent with the reference value. If the absolute value of En is greater than or equal to 1, it is considered that the laboratory measurement results are inconsistent with the reference value. The formula for calculating the value of En is shown in Eq. (16), where UG and UM are the expanded uncertainties (k=2) of the two methods. The results are summarized in Table 13.
| Sources | En |
|---|---|
| 241Am | 0.021 |
| 239Pu | 0.014 |
| 90Sr | 0.069 |
| 204Tl | 0.033 |
Discussion
In the GUM and MCM methods, the system dead-time measurement model and voltage threshold correction factor measurement methods were the same, but the uncertainty evaluation methods were different. Only the β-plane source must complete the voltage threshold correction factor measurement. The GUM method is based on a Type B evaluation of the uncertainty process, and the default probability distribution of the system dead time and threshold correction factors is rectangular. The MCM inputs the measurements from the system dead time measurement model and the voltage threshold correction factor measurement method into Equation (15), and the uncertainty results of the system dead time and voltage threshold correction factor can be obtained through the Monte Carlo procedure. Thus, the final combined standard uncertainty can be calculated directly. It should be noted that in the MCM, the probability distribution of the threshold voltage readings is set to a rectangular distribution according to the Type B evaluation of uncertainty; however, in reality, the range of the coverage interval of the threshold voltage readings is much smaller than the scale component value (0.02 V).
As can be observed from the evaluation results of the GUM and MCM methods, the system dead time and voltage threshold correction factor obtained by the MCM were similar to those of the GUM method; however, their measurement uncertainties were larger than those of the GUM method. Similarly, the final measurement estimates of the GUM and MCM methods for each source were similar. However, the uncertainty results of the MCM method were larger than those of the GUM method. This can be attributed to two reasons: (i) the combined standard uncertainty formula of the GUM method ignores the higher-order terms of the Taylor expansion in the process of partial derivation of the measurement model and (ii) the GUM method assumes that the probability distributions of the system dead time and voltage threshold correction factor have a rectangular distribution, which is more complex for both. Both reasons affected the evaluation results; however, the author believes that the second reason has more weight.
Compared to the GUM method, the MCM has unique advantages: the PDF of the output quantity Y can be output by the MCM, and the degree of discreteness of the output value can be observed. From the seven PDF histograms, it can be directly observed that (i) the probability distribution of the system dead time tends to be normally distributed, but the degree of discreteness is high, (ii) the probability distribution of the voltage threshold correction factors of the two β sources has a trapezoidal distribution characteristic, and (iii) it can be intuitively inferred from the PDFs of the four sources that the PDFs of 90Sr have the highest degree of dispersion.
To improve the measurement method, it is recommended to use a digital multichannel analysis measurement system to obtain the system dead time directly by measuring the live time. Additionally, for a complete measurement system, performance tests, such as stability and repeatability, should also be conducted.
Conclusion
In this study, methods for evaluating the uncertainty of α and β surface emission rate measurement models based on windowless proportional counters were studied using the GUM and MCM methods. The measurement methods and models of the system dead time and threshold correction factor were elaborated in detail, and the uncertainties of the surface emission rates of the four plane sources were evaluated using both the GUM and MCM methods.
The evaluation results of the GUM method were lower than those of the MCM method. However, the MCM method is considered to be more objective in its evaluation process and can better reflect the distribution characteristics of the surface emission rate measurement function through PDF graphs. To measure and calibrate the surface emission rate for α and β particles, the MCM constructs a mathematical model that is practical for stable environmental conditions and measurement methods in laboratories. The GUM method has greater flexibility in setting the coverage intervals of the measured quantities, whereas the MCM is more suitable for on-site calibration. Both methods can be used to validate the evaluation results.
Supplementary comparison of the measurement of the alpha and beta particle surface emission rates from large area sources (CCRI(II)-S10 LASCE)
. Metrologia 59, 06007 (2022). https://doi.org/10.1088/0026-1394/59/1A/06007Uncertainties in surface emission rate measurements
. Metrologia 52, S165 (2015). https://doi.org/10.1088/0026-1394/52/3/S165The absolute measurement for 2πα and 2πβ particle emission rate
. Acta Metrologica Sinica 37, 209-213 (2016) (in Chinese). https://doi.org/10.3969/j.issn.1000-1158.2016.02.22The alpha and beta emitter measurement system in INER
. Appl. Radiat. Isot. 56, 261-264 (2002). https://doi.org/10.1016/S0969-8043(01)00197-XThe establishment of the on-site calibration device for 2πα and 2πβ particle emission rate measurement
. Acta Metrologica Sinica 38, 117-122 (2017) (in Chinese). https://doi.org/10.3969/j.issn.1000-1158.2017.01.25Influence of conversion factors on the radioactivity evaluation of clearance objects consisting of several materials, Appl
. Radiat. Isot 200, 110984 (2023). https://doi.org/10.1016/j.apradiso.2023.110984Evaluation of the probability distribution of radioactivity estimated by inverse problem solution using Monte Carlo Method, Appl
. Radiat. Isot. 187, 110338 (2022). https://doi.org/10.1016/j.apradiso.2022.110338Simulation study on the fraction of environmental scattered radiation in mobile X-ray reference radiation field
. Nuclear Techniques 44, 100201 (2021) (in Chinese). https://doi.org/10.11889/j.0253-3219.2021.hjs.44.100201.Test of proportional counter system with effective detective area larger than 1000 cm2
. Atomic Energy Science and Technology 50, 713-719 (2016) (in Chinese). https://doi.org/10.7538/yzk.2016.50.04.0713Uncertainty of nuclear counting
, Metro. 52, S3-S17 (2015). https://doi.org/10.1088/0026-1394/52/3/S3Measurement of dead time by time interval distribution method
. Nucl. Instrum. Methods Res. Sect. A 774, 151-158 (2015). https://doi.org/10.1016/j.nima.2014.11.069Dead time corrections using the backward extrapolation method
. Nucl. Instrum. Methods Phys. Res. Sect. A 854, 53-60 (2017). https://doi.org/10.1016/j.nima.2017.02.026Simulation of a novel neutron detector based on multi-layer MWPC with 10B4C convertor
. Nuclear Physics Review 36, 71-77 (2019) (in Chinese). https://doi.org/10.11804/NuclPhysRev.36.01.071Research on repetition unit value for secondary standard of 2πα and 2πβ particle emission rate
. Nuclear Electronics & Detection Technology 32, 471-474 (2012) (in Chinese). https://doi.org/10.3969/j.issn.0258-0934.2012.04.023The large-area multi-wire proportional counting system for 2 alpha and beta emission measurement at the NIM China
. Appl. Radiat. Isot. 134, 366-369 (2018). https://doi.org/10.1016/j.apradiso.2017.08.014Gas pressure dependence in the multi-wire proportional counter on the absolute measurement for and sources surface emission rates
. Acta Metrologica Sinica 40, 153-158 (2019) (in Chinese). https://doi.org/10.3969/j.issn.1000-1158.2019.01.25Particle Counting in Radioactivity Measurements (ICRU Report 52)
, Metro. 32, 326 (1995). https://doi.org/10.1088/0026-1394/32/4/15APMP comparison of measurement of surface emission rate of 36Cl large area
. Appl. Radiat. Isot. 70, 1831-1835 (2012). https://doi.org/10.1016/j.apradiso.2012.02.034The development of a portable 2π particle emission rate measurement system
. Nuclear Electronics & Detection Technology 36, 1172-1177 (2016) (in Chinese). https://doi.org/10.3969/j.issn.0258-0934.2016.11.021A new digital pulse processing method for 2πα and 2πβ emitter measurement
. Nucl. Sci. Tech. 27, 138 (2016). https://doi.org/10.1007/s41365-016-0137-zDevelopment of a windowless multi-wire proportional chamber (MWPC) counting system for measuring extended-area beta source
. Appl. Radiat. Isot. 126, 175-178 (2017). https://doi.org/10.1016/j.apradiso.2017.01.031A new large-area 2π proportional counting system at NIST
. Appl. Radiat. Isot. 66, 877-880 (2008). https://doi.org/10.1016/j.apradiso.2008.02.079Useful and little-known applications of the Least Square Method and some consequences of covariances
. Nucl. Instrum. Methods Res. Sect. A 833, 82-87 (2016). https://doi.org/10.1016/j.nima.2016.06.126Simultaneous least-squares treatment of statistical and systematic uncertainties
. Nucl. Instrum. Methods Res. Sect. A 556, 325-330 (2006). https://doi.org/10.1016/j.nima.2016.10.006A modified Generalized Least Squares method for large scale nuclear data evaluation
. Nucl. Instrum. Methods Res. Sect. A 841, 87-96 (2017). https://doi.org/10.1016/j.nima.2016.10.006Application of the iterated weighted least-squares fit to counting experiments
. Nucl. Instrum. Methods Res. Sect. A 940, 135-141 (2019). https://doi.org/10.1016/j.nima.2019.05.086Determination of 89Sr and 90Sr radioactive concentrations from least-squares fits to the growth/decay curves
. Nucl. Instrum. Methods Res. Sect. A 312, 198-200 (1992). https://doi.org/10.1016/0168-9002(92)90153-UNew method to incorporate Type B uncertainty into least-squares procedures in radionuclide metrology
. Appl. Radiat. Isot. 109, 82-84 (2016). https://doi.org/10.1016/j.apradiso.2015.11.069Derivation of uncertainty propagation for clearance measurement
. Appl. Radiat. Isot. 170, 109630 (2021). https://doi.org/10.1016/j.apradiso.2021.109630Measuring, Estimating, and Deciding under Uncertainty
. Appl. Radiat. Isot. 109, 6-11 (2016). https://doi.org/10.1016/j.apradiso.2015.12.013Improvements in the absolute standardization of large-area reference sources, Appl
. Radiat. Isot. 67, 1716-1720 (2009). https://doi.org/10.1016/j.apradiso.2009.03.056The authors declare that they have no competing interests.

